HAL Id: halshs-01021376
https://halshs.archives-ouvertes.fr/halshs-01021376
Submitted on 9 Jul 2014
HAL is a multi-disciplinary open access
archive for the deposit and dissemination of sci-entific research documents, whether they are pub-lished or not. The documents may come from teaching and research institutions in France or
L’archive ouverte pluridisciplinaire HAL, est destinée au dépôt et à la diffusion de documents scientifiques de niveau recherche, publiés ou non, émanant des établissements d’enseignement et de recherche français ou étrangers, des laboratoires
Growth Strategy with social Capital and Physical
Capital- Theory and Evidence: the Case of Vietnam
Cuong Le Van, Anh Ngoc Nguyen, Ngoc-Minh Nguyen
To cite this version:
Cuong Le Van, Anh Ngoc Nguyen, Ngoc-Minh Nguyen. Growth Strategy with social Capital and Physical Capital- Theory and Evidence: the Case of Vietnam. 2014. �halshs-01021376�
Documents de Travail du
Centre d’Economie de la Sorbonne
Growth Strategy with Social Capital and Physical Capital- Theory and Evidence: the Case of Vietnam
Cuong LE VAN, Anh Ngoc NGUYEN, Ngoc-Minh NGUYEN
Growth Strategy with Social Capital and Physical
Capital- Theory and Evidence: the Case of
Vietnam
Cuong Le Van
⇤Anh Ngoc Nguyen
†Ngoc-Minh Nguyen
‡February 23, 2014
Abstract
We study the impact of social capital in both simple theoretical and em-pirical model with the main assumption is the price of physical capital is a decreasing function of social capital. In our theoretical model, there exists a critical value such that firm will not invest in social capital if its saving is lower than the critical value and otherwise. Moreover, the output depends positively and non-linearly on the social capital. Our empirical model that captures the impact of physical capital, human capital, and social capital using the database from Survey of Small and Medium Scale Manufactur-ing Enterprises (SMEs) in Vietnam 2011, confirms the conclusions of the theoretical model.
⇤IPAG Business School, CNRS, PSE, VCREME. E-mail: levan@univ-paris1.fr †DEPOCEN, Vietnam. e-mail: ngocanh@depocen.org
‡DEPOCEN, Vietnam. e-mail: ngocminh@depocen.org
Keywords: Social Capital, Optimal Growth JEL Classification Numbers: Z1, E2, O00
1
Introduction
Capital is one of the major elements that support the entrepreneurs in their produc-tion and business activities. The more capital firms own, the easier they improve quantity and quality of their tools and machines, consequently the higher prof-itability level they could achieve. Today, in sophisticated economies, the concept “capital” does not simply stand for “physical capital”, it also implies non-physical resources such as “human capital” in the form of managerial talent as well as education and training, skills of the labors working in enterprises, etc.; and “so-cial capital” in the form of so“so-cial networks, the relationships between individuals, norm, trust that have certain impact on the firm productivity.
In the recent years, there are a mass of studies on social capital as well as its e↵ects on a very wide-ranging set of socioeconomic phenomena (Durlauf 2002a; Krishna 2001). Through researches, the concept of social capital is still being dis-cussed and developed despite a lack of an agreed upon and consistent definition. Bourdieu (1986) classifies social capital as the aggregate of the actual or potential resources which are linked to possession of a durable network of more or less insti-tutionalized relationships of mutual acquaintance or recognition (Bourdieu 1986, p. 248) and made up of social obligations (‘connections’), which are convertible, in certain conditions, into economic capital and may be institutionalized in the
form of a title of nobility (Bourdieu 1986, p. 243).
The Organization for Economic Co-operation and Development (OECD) and the World Bank also have their own definitions of social capital. According to OECD, social capital is defined as “networks together with shared norm, values and understanding that facilitate co-operation within or among groups” (Cote and Healy, 2001:41). The World Bank suggests that “Social capital refers to the institutions, relationship, and norms that shape the quality and quantity of a society’s social interaction. Social capital is not just the sum of the institutions which underpin a society it is the glue that holds them together.”
However, the most popular definition belongs to Putnam (1993, 1995, and 2000) who successfully exported the concept out of academia and into the wider media and is also the most well-known theorist within the social capital paradigm. He showed that social capital is the “features of social organization such as net-works, norms, and social trust that facilitate coordination and cooperation for mutual benefit” (Putnam 1995, p. 67). Despite the diversity in definition, the widespread application of the concept verified the importance of social capital. Through researches, authors have provided generous evidence of its influence on political, economic and social aspects (Fine 2001; Jack and Jordan 1999; Mont-gomery 2000).
Kurt Amen (2001) pointed out the potential trade-o↵ between sustainability of self-enforcement and the magnitude of gains from trade in social networks as an explanation. Based on an infinitely repeated multi-player prisoners’ dilemma, the paper showed that inclusive social capital could combine both low enforcement cost and high gains from trade. Similarly, B.R. Routledge and J. von Amsberg (2003) used the structure of the prisoners’ dilemma to describe the trade between
two people and introduced a theoretical growth model in which they defined and characterized social capital as the social structure which facilitates cooperative trade as equilibrium. The key assumption of their model was that technological innovation, which drives growth, involves a reallocation of labour that a↵ects social capital. The connections between growth, labour mobility, and social capital were explored by the combination of trading model and growth model.
Besides theoretical studies, many empirical studies verified the e↵ect of social capital on economic growth. Using three measures: (i) an index of the extent of civic community; (ii) an index of various direct measures of the e↵ectiveness of regional government; and (iii) survey of citizen satisfaction with their regional governments, J.F. Helliwell and R.D. Putnam (1995) showed that there was a strong convergence of per capita incomes among the Italian regions during the 1960s and 1970s, and the more social capital a region has, the faster convergence is, as well as the higher equilibrium income level is. They also provided evidence of a sharp reversal of convergence in the period 1983 1990, indicated by increasing in the levels of real per capita GDP among regions since the regional government reforms. In the USA, there is an outstanding diversity of social capital by region (S.Iyer, M. Kitson, and B.Toh 2005). The social capital data from the Social Capital Community Benchmark Survey 2000 showed education is important for almost indicators of social capital, and ethnic diversity is associated with lower levels of social capital.
The role of social capital is also verified through cross-country empirical works. S.Knack and P. Keeper (1997) realized that trust and civic norm are stronger in countries with higher and more equal incomes, with institutions that restrain predatory actions of chief executives, and with better-educated and ethnically
social capital memberships in formal group that is not associated with improved economic performance. A study on a cross section of 54 European regions also confirmed that growth di↵erentials in European regions are positively related to social capital as associational activity (S.Beugelsdijk, T. Schaik 2004). In case of Africa, social capital is one of three most important initial conditions that mainly a↵ect growth by determining policy outcomes; developing countries with relatively low social capital seem more likely to have bad policy outcomes, low investment and slow growth (J. Temple 1998).
Recently, W.Stam, S.Arzlanian, and T. Elfring (2013) have conducted a meta-analysis of the link between entrepreneurs’ personal networks and small firm per-formance to examine the role of social capital in the entrepreneurial process. The authors collected the population of 59 empirical studies (of which 10 are unpub-lished) that considered the relationship between social capital of entrepreneurs and small firm performance. The results showed that the relationship is positive, significant, and depends on the age of small firms, the industry and institutional contexts they operate, and on the specific network or performance measures used. In Vietnam, there are 2 branches of research on social capital. The first branch concerns the summary and introduction of the theory of social capital. Some ex-amples of research papers produced this branch are “Understanding the concept of social capital” (H.Q.Tran, 2006), “Social capital and Economics” (H.D.Tran, 2003 and 2006), “Social capital and Development” (N.B.Nguyen, 2006), “Capital and Social capital” (Q.A.Nguyen, 2006) and “Social capital in Vietnam” (V.P.Nguyen, 2006), etc., however, these papers simply introduced and discussed the general theory, and did not prepare a specified theory for empirical research. The second branch focuses on empirical research. S.J.Appold and Q.T.Nguyen highlighted the role of social capital in small enterprises’ performance. “Social capital, human
capital and social networks some studies in Vietnam” (N.H.Le, 2008) discussed some of the di↵erent concepts of social capital. T.A.Nguyen and Fleur Thomse (2007) applied the concept of social capital to examine the phenomenon of land consolidation in agricultural production through the study “Kinships and land consolidation in term of social capital perspective in a North Central village”.
All of the studies mentioned above demonstrated the role of social capital in the “Doi moi” (reform) period of Vietnam, it could help to promote industrialization, modernization and international integration. However, almost all of these studies were only concerned with kinship and limited their scope to the village level. In this paper, we are able to analyze the e↵ect of social capital on productions and business activities, using the database from Survey of Small and Medium Scale Manufacturing Enterprises (SMEs) in Vietnam 2011. To the best of our knowledge, this is the first time social capital is considered as a key determinant of Vietnamese firm performance.
Our empirical analysis is guided by a theoretical model in which there exists a certain value of total saving such that upon this threshold the investment in social capital is efficient. Moreover, the more resourceful the social capital technology is and/or the lower investment in social capital is required, the slighter the value of total saving is needed. Our theoretical model also shows that the steady state of the optimal path of total saving when firm invests in social capital is always higher than the steady state of the optimal path without social capital.
Although, the theoretical model of B.R. Routledge and J. von Amsberg (2003) focused more on the social aspect of social capital as influencing cooperative be-haviour, and confirmed the ability of government to increase the social capital at the expense of a less efficient allocation of labour by setting laws that reduce
mo-bility like a rigid seniority system or harsh unemployment scheme, the authors did not provide any empirical evidence. By contrast, we verified through our empirical results that the social capital is not really a capital in the sense we cannot produce with social capital as the only input.
The rest of this paper is organized as follows. Section 2 discusses the theoret-ical model, analyzed the link between social capital and growth, and showed the conditions that promote firms to invest in social capital. Section 3 presents our data and shows the empirical model as well as its results. Section 4 summarizes and concludes.
2
Theoretical Model
2.1
Model
We consider the Social Planner problem which consists to maximize the intertem-poral utility of a representative consumer
max {ct} 1 X t=0 tu(c t)
where ct denotes her/his consumption at date t, 2 (0, 1) is the discount factor,
u is a strictly concave, strictly increasing function. The constraints for this agent are, for any period t:
mt is the amount devoted for the social capital t, Zt+1 is the amount devoted
for the purchase of the physical capital kt+1 which will be used in period t + 1
to produce the consumption good of this period. The technology used for that is represented by the function F . This function is strictly concave, strictly in-creasing, F (0, L) = 0. For simplicity, we assume exogenous labour supply and full employment of labour. Hence, the production function does not involve labour and we will write F (Kt) instead of F (Kt, Lt). Finally, pt is the price (in terms of
consumption good) of the physical capital.
Why is the social capital useful? Assume that the consumer (who is also the producer of the consumption good) has on hand a quantity Z of savings (in terms of consumption goods). The quantity of physical capital she gets is k = Z
p. The
price p of the capital changes with the social capital. We assume that the price p is a decreasing function of the social capital .
We can also interpret slightly di↵erently the role of the social capital. Suppose the firm wants to get a loan to buy a quantity of physical capital k with a saving Z. Let q denote the price of the physical capital. If r is the interest rate, we then have q(1 + r)k = Z. The unit cost of the physical capital now is p = q(1 + r). In presence of the social capital, the interest r varies. Eventually it is negative (this corresponds to a subsidy from the government) and p is lower than the market price q. We assume the interest rate is a decreasing function of the social capital.
For simplicity, we assume that p = 1 and hence Z = k.
We now suppose that with an amount m, the consumer will get a social capital
Let St be the total saving at period t, i.e.
St = Zt+1+ mt
and ✓t is the share of this saving devoted to Zt+1. Then
Zt+1 = ✓tSt+1
mt = (1 ✓t)St+1, ✓t 2 [0, 1]
pt =
1
t
The constraints for the consumer can be written as:
c0+ S1 F (k0) + (1 k)p0k0 ct+1+ St+2 F (kt+1) + (1 k) kt+1 t , for t 0 F ( t✓tSt+1) + (1 k)✓tSt+1 where t = (mt) = ((1 ✓t)St+1). Let H(S) = max F ( ✓S) + (1 k)✓S : ✓ 2 [0, 1], = ((1 ✓)S)
The problem of the social planner now becomes:
max 1 X t=0 tu(c t)
under the constraints
c0+ S1 F (k0) + (1 k)p0k0
ct+1+ St+2 H(St+1)
2.2
When does Firm invest in Social Capital?
In this section we will show that, when the technology has a threshold then there exists a critical value Sc such that if S < Sc then firm will not invest in social
capital and when S > Sc, it will do. We assume for simplicity that k = 1 (full
depreciation of the physical capital), and
(m) = 1, if m ˆm
and (m) = a(m m) + 1, a > 0, when m > ˆˆ m
The parameter a measures the efficiency of the technology . Let us consider again the function H:
H(S) = max F ( ✓S) : ✓2 [0, 1], = ((1 ✓)S)
First, observe that, from the Maximum Theorem, H is increasing. We can write:
H(S) = max F ( ((1 ✓)S) ✓S) : ✓2 [0, 1]
Let ✓(S) denote the solution to this problem. We wonder whether exists Sc such
It is obvious that ✓(S) actually solves the problem
max{ ((1 ✓)S)✓ : ✓2 [0, 1]
Proposition 1 There exists Sc > ˆm + 1
a such that 1 ✓(S) = 0 for S < Sc and
1 ✓(S) > 0 for S > Sc. Moreover, when a increases then Sc decreases, and when
ˆ
m increases then Sc increases.
Proof. Let G(S,✓ ) = ((1 ✓)S) ✓ and Z(S) = max{G(S,✓ ) : ✓ 2 [0, 1]}.
(1) If S ˆm then (1 ✓)S ˆm for any ✓ 2 [0, 1]. In this case G(S,✓ ) = ✓ ) Z(S) = 1, ✓(S) = 1 and 1 ✓(S) = 0 (Firm will not invest in social capital).
(2) Now consider the case S > ˆm.
• (a) ✓ 1 mˆ
S or equivalently (1 ✓)S ˆm. In this case, G(S,✓ ) = ✓ )
Z(S) = 1, ✓(S) = 1 and 1 ✓(S) = 0.
• (b) Let 0 ✓ 1 mˆ
S. The maximum cannot be obtained with ✓(S) = 0 since
if it is true then Z(S) = 0. If the solution ˜✓ is interior, i.e. ˜✓2 (0, 1 mˆ S) then
we get ˜✓ = 12(1 mSˆ) + 2aS1 . (This value is obtained by writing @G@✓(S,✓ ) = 0). It is smaller than 1 mSˆ if, and only if, S > ˆm + 1a.
Hence if S ˆm + 1 a then ˜✓ = 1 ˆ m S. In this case ((1 ✓)S)˜˜ ✓ = ˜✓ = 1 ˆ m S.
It is smaller than the value we obtained in (a). Hence, 1 mˆ
S cannot be
✓(S). We can summarize at this stage that S ˆm + 1
a ) Z(S) = 1, ✓(S) =
1, 1 ✓(S) = 0.
Now, assume S > ˆm+1a. Again, ✓(S) > 0. If it is strictly smaller than 1 then ✓(S) = ˜✓ = 12(1 mSˆ) +2aS1 . (This value is obtained by writing @G@✓(S,✓ ) = 0).
We have G(S, ˜✓) = (S) = a 4S S + 1 a mˆ 2 = a 4 S + 2(1 a m) + (ˆ 1 a m)ˆ 21 S We have 0(S) = a 4S2 S2 (1 a m)ˆ 2 Since S > ˆm + 1
a, we have 0(S) > 0. It is obvious that (+ 1) = +1.
When S ! ˆm + 1
a, we have (S)! 1
a ˆm+1 < 1. Hence there exists a unique
Sc > ˆm + 1
a such that ( S
c) = 1.
For ˆm + 1a < S < Sc we have (S) < 1. Since G(S, 1) = 1, ✓(S) cannot be
less than 1. Hence ✓(S) = 1 and Z(S) = 1.
For S > Sc, we have (S) > 1 and hence Z(S) > 1 with ✓(S) = ˜✓ = 1 2(1 ˆ m S) + 1
2aS. One can easily check that ✓(S) < 1.
Observe that S > ˆm + 1 a ) S + 1 a m > 0. We then getˆ @ ln( ) @a (S) = 1 a 2 a2 1 S + 1a mˆ = 1 a S (1 a + ˆm) ⇥ 1 S + 1a mˆ > 0 @ ln( ) @ ˆm = 2 S + 1a mˆ < 0
The graph of the function ( S) 1 shifts up when a increases. Hence Sc, which
is the unique solution to ( S) 1 = 0, decreases when a increases. Now, when ˆm increases, the graph of ( S) 1 shifts down and Sc increases.
nology increases, the critical value Sc becomes bigger.
Let (S) = ((1 ✓(S))S).
Proposition 2 Assume F (xx2) ! +1 when x ! +1. Then F ( (S)✓(S)S)(S) ! 0
when S! +1.
Proof. When S ! +1 then ✓(S) = 1
2(1 ˆ m S)+ 1 2aS ! 1 2 and (S) S = a((1 ✓(S))S m)+1ˆ S ! a 2. Hence (S) F ( (S)✓(S)S) is equivalent to aS
2F (aS22 ) and converges to 0.
Remark 1 Observe that the output is given by y = F ( k). Given k, since F is concave, the ratio F ( k)/ decreases when increases.
A function F which satisfies the assumption of Proposition 2 is F (x) = Ax↵, ↵ > 1 2.
The interpretation of Proposition 2 is that the role of the social capital becomes very small when Firm becomes very rich.
2.3
Growth and Social Capital
In this section, we study the contribution of the social capital to economic growth. Assume that the function F is Cobb-Douglas, F (k) = Ak↵ with ↵2 (0, 1) and the
utility function u satisfies the additional assumptions that it is twice continuously di↵erentiable and satisfies the Inada condition u0(0) = +1.
Let ¯S be defined by A↵ ¯S↵ 1 = 1. This ¯S is the steady state to which will
converge the optimal path when Firm never invests in social capital. We have the following preliminary results. Let {S⇤
t+1}t 1 denote the optimal
sequence of the total saving.
Lemma 1 The optimal path (S⇤
Proof. From what we wrote above, for t > 0, the model can be stated as: max 1 X t=1 tu(H(S t) St+1) s.t. 8t > 0, 0 St+1 H(St)
Since H is increasing and @2u
@St@St+1 > 0, we apply the result in Amir (1996).
Lemma 2 Assume ( ¯S) > 1. Then there exists T such that 1 ✓(ST⇤) > 0, i.e. Firm will invest in social capital at date T .
Proof. If Firm never invests in Social Capital then the optimal path (St⇤) will converge to ¯S. Since ¯S > Sc, there exists a date T with S⇤
T > Sc. From Proposition
1, Firm will invest at T in social capital.
Lemma 3 The optimal path (St⇤) cannot converge to zero.
Proof. We have the Euler equation:
8t, u0(H(St⇤) St+1⇤ ) = u0(H(St+1⇤ ) St+2⇤ )H0(St+1⇤ ) Let us compute H0(0). It is obvious that H(0) = 0. We have
H0(0) = lim
S!0
H(S)
S = limS!0AS
↵ 1[ ((1 ✓(S))S)✓(S)]↵
When S is close to zero ((1 ✓(S))S) = 1 and ✓(S) = 1. Hence limS!0 H(S)S =
+1.
Consider again the Euler equation. If S⇤
T such that, for any t > T, H0(St+1⇤ ) > 1. This implies
u0(c⇤t) = u0(H(St⇤) St+1⇤ ) > u0(c⇤t+1) = u0(H(St+1⇤ ) St+2⇤ ),8t T
Equivalently, c⇤t+1 > c⇤T > 0, for any t > T . However, if St⇤ goes to zero then c⇤t goes to zero too. We get a contradiction which ends the proof.
Lemma 4 Let ¯S denote the steady state of the optimal path of the total saving when Firm never invest in social capital, and ˜S denote the steady state (if it exists) of the optimal steady state of the optimal path with social capital. Then ˜S > ¯S.
Proof. The steady states ¯S and ˜S are respectively defined by F0( ¯S) = H0( ˜S) = 1. Observe that F (S) = AS↵ and H(S) = AS↵ (S)↵. We then have:
1
= A↵ ¯S↵ 1 = A↵ ˜S↵ 1[ ( ˜S)↵+ ˜S ( ˜S)↵ 1 0( ˜S)]
Since ( ˜S) > (Sc) = 1, 0 > 0, we have ¯S↵ 1 > ˜S↵ 1 or equivalently ˜S > ¯S.
From these Lemma we obtain the main result of this paper.
Theorem 1 Assume ( ¯S) > 1. Then there exists T such that 1 ✓(St⇤) > 0,8t T , i.e. Firm will invest in social capital after date T . Either the optimal path will converge to infinity (growth without bound) or converges to a steady state higher than the one without social capital.
Proof. Since the optimal sequence (St⇤) is monotonic and cannot converge to
zero, there exists T such that S⇤
t > Sc for any t T . The remaining claims follow
We now give conditions for which the optimal paths (St⇤) will grow without
bound.
Theorem 2 Assume ¯S = (A↵ )1 ↵1 > ˆm and ↵ > 1 2.
(i) Then there exists ¯a such that if a > ¯a then S⇤
t ! +1 when t ! +1.
(ii) And the ratio t
H(St) converges to zero when t goes to infinity.
Proof. (i) The idea is to prove when a is large enough, the equation H0(S) = 1 has no solution, i.e., there is no steady state for the optimal (S⇤
t). Hence this one
will converge to infinity. We have H(S) = A⇣a 4 ⌘↵✓ S + 1 a mˆ ◆2↵ and hence H0(S) = 2↵A⇣a 4 ⌘↵✓ S + 1 a mˆ ◆2↵ 1 Since ˜S > ¯S, we have H0(S) > 2↵A⇣a 4 ⌘↵ ¯ S mˆ 2↵ 1
which converges to infinity when a converges to infinity. (ii) The statement follows (i) and Proposition 2.
Comment If ↵ > 1
2 and the TFP A is sufficiently large or the threshold ˆm is
small, then the economy which uses optimally the social capital, grows without bound if the social capital technology is sufficiently efficient. Second, the role of the social capital diminishes when the revenue becomes very large.
3
Empirical Results
3.1
Data Description
Prior to the econometric investigation of how social capital a↵ects firm perfor-mance, it is useful to provide a description of dataset and some key variables used in our study.
A firm-level dataset is compiled from database of the Survey of Small and Medium Scale Manufacturing Enterprises (SMEs) in Vietnam. The survey is con-ducted every 2 year and in 2011 the dataset contains information of over 2500 Vietnamese SMEs from 10 provinces. The total revenue of surveyed firms was about 100 US billions. For each interviewed enterprise, two types of questionnaire were taken: (i) the main questionnaire asked about various characteristics and performance of enterprise; (ii) the labour questionnaire was to collect information on wages, work and job satisfaction of workers. One advantages of using data from Vietnamese SMEs survey is that it collects information about all aspects of busi-ness activities such as enterprise history, production characteristics, investments, assets, liabilities, credit, networks of enterprise and entrepreneurs, economic con-straints and potential, etc. It is a fruitful source for study on Vietnamese SMEs performance.
In Vietnamese SMEs survey, collected information about social capital of firm are: (i) the information on social network such as the number of business contacts that the manager/entrepreneur has, who is the most important contact for firm performance, and the number of support the firm received from these contacts in last year, etc.; (ii) the information about business associations that the firm partic-ipates in such as the number of associations that the firm is their member, whether
the members have to pay the fee or not, the reason why firm participated in these associations, the assessment of firms about supportability of these association.
The Vietnamese SMEs database showed that the number of firms who are participated in a formal business association is very modest, it decreased from 9.58% (equivalent to 270/2821 surveyed firms) in 2005 to 7.56% (193/2552 sur-veyed firms) in 2011. In fact, Vietnamese business associations do not have the key role in supporting the business activities of firms. Therefore, it is inappro-priate to choose participating in associations or the number associations that the firms participated in as a proxy for social capital. In our empirical model, the total people with whom the manager/the entrepreneur has regular contact in their business activities was chosen as the explanatory variable of interest. These con-tacts include business people, bank officials (both formal and informal creditors), and politicians and civil servants, etc.
3.2
Empirical Specification
In our empirical model, we suggest that social capital has an e↵ect on revenue of firms using the following regression specification:
lnRevenue = 0+ 1lnP hysical + 2lnLabour
+ 3lnP roLabour + 4T otalContact
where lnRevenue measured as the logarithm of the total revenue of firm in the end of 2010.
All dataset are lagged one year, and computed in their log value. LnPhysical is proxy variable for physical capital, LnLabour and LnProLabour are proxy variable for human capital. Professional Employer is covered to estimate the impact of labour quality on firm performance.
The proxy variable for e↵ect of social capital is TotalContact that indicates the number of contact a firm has.
As the theoretical model implied, there exists a threshold Sc of total saving
such that if the total saving of firm is smaller than this threshold Sc, the investment
in social capital will be inefficient. In addition, the steady state in case of investing in social capital is always higher than the one without social capital.
In empirical model, we analyse the impact of social capital and make an e↵ort to prove that social capital only impacts on the performance of certain firms whose revenue is larger than a critical value. Since proficient social capital also requires a fixed cost, if the firm’s saving is not large enough, it could not invest in social capital, or the social capital that it achieves could not support its performance. Simultaneously, it should be noted that the higher revenue a firm reaches, the larger saving it could make, as a result, only these firms could be employ social capital as a determinant of its growth.
In order to examine whether the link between social capital and firm revenue is nonlinear as we expected or not, as well as to detect the threshold, we regress the log value of firm revenue on the proxy variables of social capital and the control variables, using OLS regression and Quantile regression methods.
Quantile regression is a type of regression analysis used in statistics and econo-metrics that intended to estimate, and conduct inference about, conditional quan-tile functions. Whereas the method of least squares results in estimates that
ap-proximate the conditional mean of the response variable given certain values of the predictor variables, quantile regression methods o↵er a mechanism for estimating models for the conditional median function, and the full range of other conditional quantile functions. By supplementing the estimation of conditional mean functions with techniques for estimating an entire family of conditional quantile functions, quantile regression is capable of providing a more complete statistical analysis of the stochastic relationships among random variables. Based on quantile regres-sion, we could detect a critical value such that the model is significant in case of all observations that are upper the critical value and otherwise.
3.3
Empirical Results
In our empirical model, we postulate that the revenue of firm is determined by the elements listed in the censored regression. The empirical model predicts that social capital a↵ects on firm performance in a certain range of revenue.
In tables 1 and 2, we introduce the results of OLS and Quantile regression method at several levels of firm revenue, i.e., column QR(0.01) shows results using quantile regression method which estimates the e↵ect of the change of conditioning variables on the position of 1% level of quantile of the distribution of firm revenue (the similar explanation for the other columns from QR(0.018) to QR(0.72)).
As can be seen in the table 1, in line with other standard control variables, the number of contacts in business activities normally has a affirmative impact on revenue of firm (indeed, the estimate of TotalContact variable is positive in all regressions). In OLS regression, the estimate of TotalContact is positive, and significant at 1% level. Generally, quantile regression is more robust to outliers
dian estimate is not similar to the OLS point estimate. The di↵erence between median and mean estimates could be clearly seen in the figure 1, the coefficient of TotalContact in case of OLS method is slightly higher than in case of QR(0.5) -Quantile Regression method at median level of firm revenue.
When we use quantile regression method and separate the dataset into 3 groups as (i) the 1.8% of lowest revenue firms, (ii) the medium revenue firms (from 1.9 71%), and (iii) the 28% of highest revenue firms, we could receive di↵erent p-values of TotalContact (as well as p-p-values of the other variables) for each group. In quantile regressions, the firms are arranged in ascending order of their revenue. For 1.8% of firms that have lowest revenue and 28% of ones that have highest revenue, the estimate of TotalContact is insignificant at 10% level (p-values of TotalContact in case of QR(0.018) and QR(0.72) are 0.341 and 0.102, respectively). By contrast, the estimate is significant in case of 70% of firms whose revenue is at medium level from QR(0.2) to QR(0.71).
In case of 1.8% of firms that have lowest revenue, it could be said that their revenues are not large enough to saving and invest in efficient social capital or efficient business contacts. This is appropriate with the results of our theoretical model. However, it is clearly that the proportion of these firms is very small. The role of social capital in Vietnamese SMEs performance is considerable so that a very small firm should use social capital to improve their performance.
The insignificant estimate of social capital in case of firms that have highest revenue provides evidence that social capital only has a certain e↵ect on firm performance. In order to increase their revenue as well as their performance, firms cannot only concern in their social capital, they also need to improve other types of capital such as physical capital, human capital, etc.
Based on above empirical results, we could see the fluctuation of the coeffi-cient of TotalContact across each quantile level and conclude that firm revenue affirmatively and non-linearly depends on the social capital.
4
Conclusion
This paper has explored the potential impact of the number of contacts in business activities on firm performance, how and in which conditions firms should invest in social capital in generally, and social network in particularly. The empirical results were guided by a theoretical model that analyses the contribution of social capital to economic growth and allows us to make progress along two lines. First, we have showed if the saving is not large enough, or equivalently if the revenue is very modest, it is not optimal for firms in social capital is not efficient. Second, we have found out that social capital only has a certain e↵ect on revenue of firm; it cannot take over from physical capital or human capital in order to produce goods (i.e., by itself, social capital is not an input).
From the empirical results, we make two observations: (1) The elasticities for the physical capital and labour are respectively around 0.3 and 0.7. That corresponds to the usual values for a Cobb-Douglas production function. (2) The empirical critical value of the saving is very low. If we interpret social capital as lobbying or bribery, one may be attempted to say that bribery exists at almost any level of the administration in Vietnam.
REFERENCES
R. Amir, 1996, Sensitivity analysis of multisector optimal economic dynamics, Journal of Mathematical Economics Vol. 25, 123-141.
K. Annen, 2003, Social Capital, Inclusive Networks, and Economics Perfor-mance, Journal of Economics Behavior and Organization, Vol. 50, 449 - 463.
S.Beugelsdijk, T.v.Schaik, 2005, Social Capital and Growth in European Regions: an Empirical Test, European Journal of Political Economy, Vol.21, 301 -324.
J.F.Helliwell, R.D.Putnam, 1995, Economic Growth and Social Capital in Italy, Eastern Economic Journal, Vol.21, No.3, Summer 1995.
S.Iyer, M.Kitson, B.Toh, 2005, Social Capital, Economic Growth, and Regional Development, Regional Studies, Vol.39.8, 1015 - 1040.
S. Knack, P. Keefer, 1997. Does Social Capital Have an Economic Payo↵? A Cross-Country Investigation, the Quarterly Journal of Economics, Vol. 112, No. 4 , pp 1251- 1288
B.R.Routledge, J.v.Amsberg, 2003, Social Capital and Growth, Journal of Monetary Economics 50, 167 - 193.
W.Stam, S.Arzlanian, T.Elfring, 2013, Social Capital of Entrepreneurs and Small Firm Performance: A Meta-analysis of Contextual and methodological mod-erators, Journal of Business Venturing 29, 152 - 173
J.Temple, 1998, Initial Conditions, Social Capital and Growth in Africa, Jour-nal of African Economies, Vol.07, No.3, 309 - 347.
M.Woolcook, D.Narayan, Social Capital: Implications for Development The-ory, Research and Policy, The World Bank Research Observers, 15,2; ABI/INFORM Global, p.225.
APPENDIX: Empirical Results
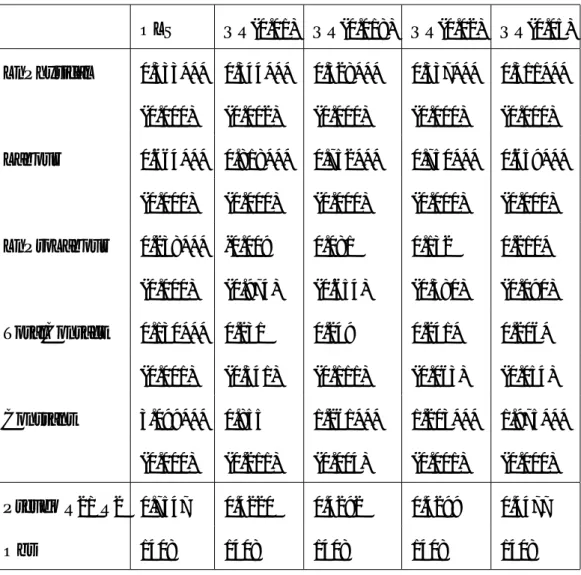
Table 1: Results of social capital and firm performance with OLS and quantile regressions OLS QR(0.01) QR(0.018) QR(0.02) QR(0.05) LnPhysical 0.333*** 0.344*** 0.328*** 0.337*** 0.311*** (0.000) (0.002) (0.000) (0.000) (0.000) Labour 0.664*** 0.818*** 0.752*** 0.750*** 0.659*** (0.000) (0.000) (0.000) (0.000) (0.000) LnProLabour 0.238*** -0.009 0.081 0.132 0.210* (0.000) (0.974) (0.654) (0.380) (0.090) TotalContact 0.130*** 0.231 0.249 0.241* 0.206* (0.001) (0.341) (0.111) (0.063) (0.054) Constant 3.099*** 0.855 1.261*** 1.203*** 1.975*** (0.000) (0.211) (0.004) (0.001) (0.000) Pseudo R2/ R2 0.7547 0.4220 0.4292 0.4299 0.4477 Obs 1408 1408 1408 1408 1408
Note: The table reports the results of estimation equation (1) corresponding to each specified threshold. Robust errors are in parentheses underneath coefficient estimates. ***, **, * indicate 1%, 5%, and 10% level of significance, respectively.
Table 2: Results of social capital and firm performance with OLS and quantile regressions (cont) QR(0.10) QR(0.25) QR(0.50) QR(0.71) QR(0.72) LnPhysical 0.291*** 0.273*** 0.331*** 0.343*** 0.340 (0.000) (0.000) (0.000) (0.000) (0.000) Labour 0.595*** 0.615*** 0.648*** 0.677*** 0.679*** (0.000) (0.000) (0.000) (0.000) (0.000) LnProLabour 0.323*** 0.343*** 0.234*** 0.199*** 0.206*** (0.000) (0.000) (0.000) (0.000) (0.000) TotalContact 0.179*** 0.160*** 0.118*** 0.084* 0.081 (0.002) (0.001) (0.009) (0.069) (0.102) Constant 2.465*** 3.041*** 3.158*** 3.440*** 3.487*** (0.000) (0.000) (0.000) (0.000) (0.000) Pseudo R2/ R2 0.4656 0.4895 0.5194 0.5362 0.5364 Obs 1408 1408 1408 1408 1408
Note: The table reports the results of estimation equation (1) corresponding to each specified threshold. Robust errors are in parentheses underneath coefficient estimates. ***, **, * indicate 1%, 5%, and 10% level of significance, respectively.