HAL Id: inserm-00431923
https://www.hal.inserm.fr/inserm-00431923
Submitted on 13 May 2010HAL is a multi-disciplinary open access archive for the deposit and dissemination of sci-entific research documents, whether they are pub-lished or not. The documents may come from teaching and research institutions in France or abroad, or from public or private research centers.
L’archive ouverte pluridisciplinaire HAL, est destinée au dépôt et à la diffusion de documents scientifiques de niveau recherche, publiés ou non, émanant des établissements d’enseignement et de recherche français ou étrangers, des laboratoires publics ou privés.
Low pessimism protects against stroke: the Health and
Social Support (HeSSup) prospective cohort study.
Hermann Nabi, Markku Koskenvuo, Archana Singh-Manoux, Jyrki Korkeila,
Sakari Suominen, Katariina Korkeila, Jussi Vahtera, Mika Kivimäki
To cite this version:
Hermann Nabi, Markku Koskenvuo, Archana Singh-Manoux, Jyrki Korkeila, Sakari Suomi-nen, et al.. Low pessimism protects against stroke: the Health and Social Support (HeS-Sup) prospective cohort study.. Stroke, American Heart Association, 2010, 41 (1), pp.187-90. �10.1161/STROKEAHA.109.565440�. �inserm-00431923�
Low pessimism protects against stroke: The HeSSup prospective cohort study Hermann Nabi 1* PhD Markku Koskenvuo 2 MD, PhD Archana Singh-Manoux 1,3 PhD Jyrki Korkeila 4 MD, PhD Sakari Suominen 5 MD, PhD Katariina Korkeila 6 MD, PhD Jussi Vahtera 5, 7 MD, PhD Mika Kivimäki 3,7 PhD
1INSERM U687-IFR69, Villejuif, AP-HP, F-94807 France. 2 Department of Public Health, University of Helsinki, Finland
3 Department of Epidemiology and Public Health, University College London, UK 4 Department of Psychiatry, University of Turku and Harjavalta Hospital, Finland
5Department of Public Health, University of Turku and Turku University Hospital, Finland 6 Municipal Health Care, Turku, Finland
7 Finnish Institute of Occupational Health, Helsinki, Finland
Manuscript word count = 1722
* INSERM Unité 687
16 avenue Paul Vaillant Couturier 94807 Villejuif Cedex
Email: Hermann.Nabi@inserm.fr
This is an un-copyedited author manuscript that was accepted for publication in Stroke, copyright The American Heart Association. This may not be duplicated or reproduced, other than for personal use or within the “Fair Use of Copyrighted Materials” (section 107, title 17, U.S. Code) without prior permission of the copyright owner, The American Heart Association. The final copyedited article, which is the
Abstract
Background and Purpose: The association between optimism and pessimism and health
outcomes has attracted increasing research interest. To date, the association between these
psychological variables and risk of stroke remains unclear. We examined the relationship
between pessimism and the 7-year incidence of stroke.
Methods: A random sample of 23 216 adults (9 480 men, 13 796 women) aged 20-54 years
completed the pessimism scale in 1998, i.e., at study baseline. Fatal and first non-fatal stroke
events during a mean follow-up of 7.0 years were documented by linkage to the
National-hospital-discharge and mortality registers, leading to 105 events.
Results: Unadjusted hazard ratio was 0.44 (95% CI 0.25-0.77) for participants in the lowest
quartile (a low pessimism level) when compared to those in the highest quartile (a high
pessimism level). After serial adjustments for sociodemographic characteristics, cardiovascular
biobehavioral risk factors, depression, general feeling of stressfulness, and ischemic-heart
disease the fully-adjusted hazard ratio was 0.52 (95% CI 0.29-0.93).
Conclusions: In this population of adult men and women, low level of pessimism had a robust
INTRODUCTION
There is a growing research interest in the relationship between dispositional
optimism and pessimism, defined as a general tendency to exhibit positive and negative
expectancies about future, and health outcomes.1-3 Although findings from well-conducted prospective studies suggest an association between optimismand pessimism as separate
constructs and the risk of incident coronary heart disease (CHD) and cardiovascular (CVD)
mortality,1, 4, 5 no evidence to date is available of an association with the incidence of stroke. We used prospective data from a large sample of the Finnish population to examine the
association between dispositionalpessimism and the incidence of stroke.
METHODS Population
The Health and Social Support (HeSSup) study is a prospective cohort study on a
population sample representative of the Finnish population of the following four age groups:
20-24, 30-34, 40-44, and 50-54 years at baseline in 1998, a total of 10,628 men and 15,267
women. The Turku University Central Hospital Ethics Committee approved the study.
Dispositional pessimism was assessed using the revised Life Orientation Test (LOT-R)6, 7 (Cronbach's = 0.74). The measure includes six statements, of which three are worded
positively for optimism, and three are worded negatively to indicate pessimism. We
categorized pessimism mean scores into 4 groupsbased on the nearest approximate of the quartiles
as in previous studies.4 The highest quartile (high pessimism) was the reference category in the analysis.
Follow-up of stroke events
Linkage to the National Hospital Discharge Register and theStatistics Finland
Mortality Register provided a virtually completefollow-up for hospitalizations and death for all
participants who were treated in a hospital or died between January 1, 1999 and December 31,
2005. Stroke was determined by the International Classification of Disease (ICD)-10 codes I60
(subarachnoid haemorrhage), I61 (intracerebral haemorrhage) and I63 (cerebral infarction) as
the main diagnosis of hospitalisation or death.
Cardiovascular risk factors
History of hypertension, CHD and diabetes mellitus at the time of questionnaire in
1998 (i.e. the survey year) were ascertained based on strict criteria 8. We excluded all participants hospitalized for CHD or cerebrovascular disease and those with medication for
CHD during or before 1998. Incident CHD events (ICD-10 codes I20-I25) that occurred during
the follow up were used as a covariate in the analysis. Behaviour-related risk factors include
current smokingstatus, alcohol consumption, physical activity and obesity. Depressive
symptoms were assessed using the Beck Depression Inventory (BDI score <10 vs 10+). The
general feeling of stressfulness in daily life was measured using the Reeder Stress Inventory 9.
Statistical Analysis
We examined the relationship between pessimism and subsequent stroke events using
seven serially adjusted Cox regression models. We combined men and women in the analyses
(p >0.05 for interaction with sex) and verified that the assumption of proportional hazards held
(all p>0.05).
Data linkage to national health registers, on the basis of a written consent, was
successful for 24 128 (93%) participants. A total of 23 216 participants had complete data on
the pessimism scale and all covariates. Of them, 105 incident stroke events (fatal and non-fatal
25 subarachnoid haemorrhages, 23 intracerebral haemorrhages, and 57 cerebral infarctions)
were documented during a mean follow-up of 7.0 (range, 0.02-7.01) years.
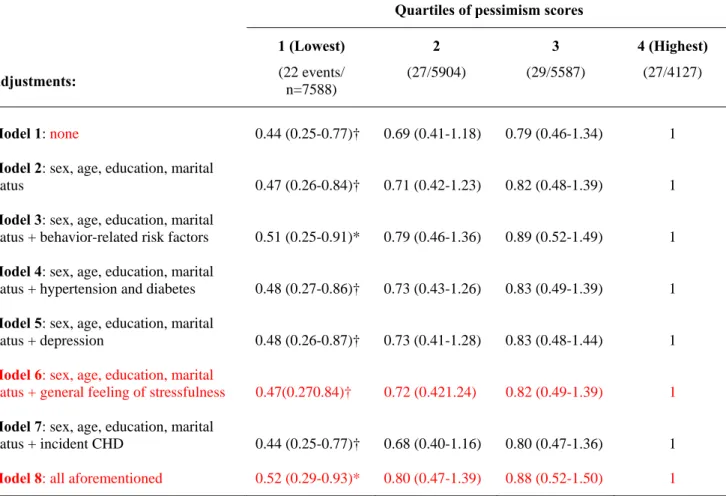
Table 2 presents the association of pessimism levels with incident stroke events.
Compared with participants with a high level of pessimism (the highest quartile), those
reporting a low level of pessimism (the lowest quartile) were at lower risk of stroke (HR= 0.44,
95% CI 0.25-0.77). After serial adjustments the fully adjusted hazard for stroke was 0.52 (95%
CI, 0.29-0.93) among those with low pessimism.
The survival curve for stroke among participants with the lowest quartile of pessimism
differed significantly (log-rank test, p<0.05) from those in the other quartiles and the difference
between the groups grew as a function of time (Figure 1).
Further analyses were run examining the role of optimism (in quartiles) in the risk of stroke. We found no evidence to suggest an association between optimism and incidence of stroke (p=0.53), lending support to the idea that pessimism and optimism are separate constructs. We also examined the association between pessimism and stroke incidence in analysis adjusted for optimism in addition to age, sex, education and marital status. The adjustment did not alter the reduced incidence of stroke associated with low pessimism (HR=0.49, 95% CI 0.26-0.90).
DISCUSSION
We examined the prospective association between dispositional pessimism and subsequent
stroke events in a large population of men and women with no history of ischemic heart disease
or cerebrovascular disease. We found that participants with a low pessimism level had a 48%
confounders. We found no evidence to suggest that the association was attributable to
depressive symptoms, a correlate of both pessimism and the risk of stroke,10,11It must be noted that we assessed depressive symptoms with the Beck Depression inventory, which is a
validated survey instrument, but not a diagnostic tool for clinical depression
The present study was based on a representative sample ofthe Finnish population in four
age groups, but did not include elderly participants which may limit the generalizability of our
findings. Our findings are broadly consistent with previous studies on the associations between
pessimism and optimism and the risk of CHD or death,4,12,Our results highlight the importance of pessimism in particular for the incidence of stroke, even in analyses adjusted for optimism. In agreement with the present results, a recent clinical study showed a lower survival rate for pessimistic cancer patients than their less pessimistic counterparts, but no difference between individuals with high levels of optimism and those with low levels of optimism.13 The precise mechanisms underlying the link between pessimism and stroke remain unclear. Both
behavioural (lifestyle behaviors) and biological (autonomic nervous system activity)
mechanisms are plausible.10,11,5, 14Low pessimism may also be related to favorable trajectories of stroke risk factors over time.Further longitudinal studies are needed to examine these mechanisms in detail and whether interventions designed to reduce pessimism would alter
Acknowledgements
The HeSSup study is supported by the Academy of Finland (three grants) and the Yrjö Jahnson
Foundation (three grants) and the Finnish heart Foundation (one grant). MKiv. and JV are
supported by the Academy of Finland (grants #117604, #124271, #124322 and #129262).
MKiv is supported by the BUPA foundation specialist research grant, the UK and AS-M by a
EUYRI award from the European Science Foundation.
REFERENCES
1. Scheier MF, Matthews KA, Owens JF, Magovern GJ, Sr., Lefebvre RC, Abbott RA, Carver CS. Dispositional optimism and recovery from coronary artery bypass surgery: The beneficial effects on physical and psychological well-being. J Pers Soc Psychol. 1989;57:1024-1040 2. Scheier MF, Matthews KA, Owens JF, Schulz R, Bridges MW, Magovern GJ, Carver CS.
Optimism and rehospitalization after coronary artery bypass graft surgery. Arch Intern Med. 1999;159:829-835
3. Peterson C, Seligman ME, Vaillant GE. Pessimistic explanatory style is a risk factor for physical illness: A thirty-five-year longitudinal study. J Pers Soc Psychol. 1988;55:23-27 4. Giltay EJ, Geleijnse JM, Zitman FG, Hoekstra T, Schouten EG. Dispositional optimism and
all-cause and cardiovascular mortality in a prospective cohort of elderly dutch men and women.
Arch Gen Psychiatry. 2004;61:1126-1135
5. Tindle HA, Chang YF, Kuller LH, Manson JE, Robinson JG, Rosal MC, Siegle GJ, Matthews KA. Optimism, cynical hostility, and incident coronary heart disease and mortality in the women's health initiative. Circulation. 2009;120:656-662
6. Scheier MF, Carver CS, Bridges MW. Distinguishing optimism from neuroticism (and trait anxiety, self-mastery, and self-esteem): A reevaluation of the life orientation test. J Pers Soc
Psychol. 1994;67:1063-1078
7. Kivimaki M, Vahtera J, Elovainio M, Helenius H, Singh-Manoux A, Pentti J. Optimism and pessimism as predictors of change in health after death or onset of severe illness in family.
Health Psychol. 2005;24:413-421
8. Kivimaki M, Gimeno D, Ferrie JE, Batty GD, Oksanen T, Jokela M, Virtanen M, Salo P, Akbaraly TN, Elovainio M, Pentti J, Vahtera J. Socioeconomic position, psychosocial work environment and cerebrovascular disease among women: The finnish public sector study. Int J
Epidemiol. 2009
9. Vahtera J, Kivimaki M, Hublin C, Korkeila K, Suominen S, Paunio T, Koskenvuo M. Liability to anxiety and severe life events as predictors of new-onset sleep disturbances. Sleep.
2007;30:1537-1546
10. Giltay EJ, Zitman FG, Kromhout D. Dispositional optimism and the risk of depressive symptoms during 15 years of follow-up: The zutphen elderly study. J Affect Disord. 2006;91:45-52
11. Larson SL, Owens PL, Ford D, Eaton W. Depressive disorder, dysthymia, and risk of stroke: Thirteen-year follow-up from the baltimore epidemiologic catchment area study. Stroke. 2001;32:1979-1983
12. Kubzansky LD, Sparrow D, Vokonas P, Kawachi I. Is the glass half empty or half full? A prospective study of optimism and coronary heart disease in the normative aging study.
Psychosom Med. 2001;63:910-916
13. Schulz R, Bookwala J, Knapp JE, Scheier M, Williamson GM. Pessimism, age, and cancer mortality. Psychol Aging. 1996;11:304-309
14. MacMahon S, Rodgers A. Blood pressure, antihypertensive treatment and stroke risk. J
Table 1: Sample characteristics as a function of the number of stroke events and pessimism score levels
Quartiles of pessimism score Baseline Covariates N events/N
participants 1 Lowest 2 3 4 Highest P value /for trend Sex 0.243 Men 59/9480 3124 (33.0) 2333 (24.6) 2268 (23.9) 1755 (18.5) Women 46/13736 4467 (32.5) 3571 (26.0) 3319 (24.2) 2379 (17.3) Age-group 0.001 20-24 3/6324 1938 (30.6) 1518 (24.0) 1664 (26.3) 1204 (19.0) 30-34 8/5533 1937 (35.0) 1399 (25.3) 1273 (23.0) 924 (16.7) 40-44 28/5555 1831 (33.0) 1473 (26.5) 1262 (22.7) 989 (17.8) 50-54 66/5804 1885 (32.5) 1514 (26.1) 1388 (23.9) 1017 (17.5) Level of education < 0.001 Basic (compulsory) 44/7412 2136 (28.8) 1756 (23.7) 1911 (25.8) 1609 (21.7) Secondary 24/5232 1367 (26.1) 1273 (24.3) 1441 (27.5) 1151 (22.0) College 26/7400 2696 (36.4) 2033 (27.5) 1654 (22.4) 1017 (13.7) University 11/3172 1392 (43.9) 842 (26.5) 581 (18.3) 357 (11.3) Marital Status < 0.001 Other 25/7674 2325 (30.3) 1735 (22.6) 1881 (24.5) 1733 (22.6) Married /cohabiting 80/15542 5266 (33.9) 4169 (26.8) 3706 (23.8) 2401 (15.4) Current smoker < 0.001 No 62/15508 5256 (33.9) 4114 (26.5) 3714 (23.9) 2424 (15.6) Yes 35/5862 1717 (29.3) 1311 (22.4) 1441 (24.6) 1393 (23.8) Missing 8/1846 618 (33.5) 479 (25.9) 432 (23.4) 317 (17.2)
High alcohol intake (200 g
of alcohol /weeka) < 0.001
No 87/20956 6950 (33.2) 5412 (25.8) 5034 (24.0) 3560 (17.0)
Yes 18/2260 641 (28.4) 492 (21.8) 553 (24.5) 574 (25.4)
Obesity (body mass index ≥
30 kg/m2) < 0.001
No 83/20992 6973 (33.2) 5395 (25.7) 5050 (24.1) 3574 (17.0)
Yes 22/2224 618 (27.8) 509 (22.9) 537 (24.1) 560 (25.2)
Sedentary life style (<2
MET b hours per day) < 0.001
No 69/17855 6072 (34.0) 4672 (26.2) 4205 (23.6) 2906 (16.3)
Yes 36/5361 1519 (28.3) 1232 (23.0) 1382 (25.8) 1228 (22.9)
Depression (BDI score ≥ 10) < 0.001
No 97/22159 7559 (34.1) 5833 (26.3) 5408 (24.4) 3359 (15.2)
Yes 8/1057 32 (3.0) 71 (6.7) 179 (16.9) 775 (73.3)
General feeling of stressfulness in daily life
0.715 Low 46/10497 3464 (33.0) 2604 (24.8) 2574 (24.5) 1855 (17.7) Intermediate 27/5547 1790 (32.3) 1426 (25.7) 1312 (23.7) 1019 (18.4) High 31/7020 2294 (32.7) 1833 (26.1) 1666 (23.7) 1227 (17.5) Missing 1/152 43 (28.3) 41 (27.0) 35 (23.0) 33 (21.7) Hypertension or diabetes < 0.001 No 85/22136 7299 (33.0) 5648 (25.5) 5300 (23.9) 3889 (17.6) Yes 20/1080 292 (27.0) 256 (23.7) 287 (26.6) 245 (22.7)
Ischemic heart disease 0.002
No 102/23016 7566 (32.7) 5864 (25.5) 5533 (24.0) 4083 (17.7)
Yes 3/200 55 (27.5) 40 (20.0) 54 (27.0) 51 (25.5)
a
200 g of alcohol represent 16 drinks per week b
Table 2: Hazard ratios (95% confidence intervals) for the association between quartiles of pessimism score and incident stroke events.
Quartiles of pessimism scores
1 (Lowest) 2 3 4 (Highest)
Adjustments: (22 events/
n=7588)
(27/5904) (29/5587) (27/4127)
Model 1: none 0.44 (0.25-0.77)† 0.69 (0.41-1.18) 0.79 (0.46-1.34) 1
Model 2: sex, age, education, marital
status 0.47 (0.26-0.84)† 0.71 (0.42-1.23) 0.82 (0.48-1.39) 1
Model 3: sex, age, education, marital
status + behavior-related risk factors 0.51 (0.25-0.91)* 0.79 (0.46-1.36) 0.89 (0.52-1.49) 1 Model 4: sex, age, education, marital
status + hypertension and diabetes 0.48 (0.27-0.86)† 0.73 (0.43-1.26) 0.83 (0.49-1.39) 1 Model 5: sex, age, education, marital
status + depression 0.48 (0.26-0.87)† 0.73 (0.41-1.28) 0.83 (0.48-1.44) 1
Model 6: sex, age, education, marital
status + general feeling of stressfulness 0.47(0.270.84)† 0.72 (0.421.24) 0.82 (0.49-1.39) 1
Model 7: sex, age, education, marital
status + incident CHD 0.44 (0.25-0.77)† 0.68 (0.40-1.16) 0.80 (0.47-1.36) 1 Model 8: all aforementioned 0.52 (0.29-0.93)* 0.80 (0.47-1.39) 0.88 (0.52-1.50) 1
* p<0.05, † p<0.01, ‡ p<0.001
Figure 1: Cumulative incidence of stroke (fully adjusted*) by pessimism scores quartiles 7 6 5 4 3 2 1 0 Time (Years) 1,0000 0,9995 0,9990 0,9985 0,9980 0,9975 0,9970 Surv ival func tion 4 (Highest) 3 2 1 (Lowest)
* Sex, age, education, marital status, smoking, alcohol consumption, sedentary lifestyle, obesity, hypertension and diabetes, depression, general feeling of stressfulness andincident CHD