HAL Id: tel-02469689
https://hal.archives-ouvertes.fr/tel-02469689
Submitted on 3 Mar 2020HAL is a multi-disciplinary open access archive for the deposit and dissemination of sci-entific research documents, whether they are pub-lished or not. The documents may come from teaching and research institutions in France or
L’archive ouverte pluridisciplinaire HAL, est destinée au dépôt et à la diffusion de documents scientifiques de niveau recherche, publiés ou non, émanant des établissements d’enseignement et de recherche français ou étrangers, des laboratoires
the astroparticle connection
Andreas Zech
To cite this version:
Andreas Zech. Very-high-energy γ-rays from Active Galactic Nuclei and the astroparticle connection. High Energy Astrophysical Phenomena [astro-ph.HE]. Observatoire de Paris, 2016. �tel-02469689�
Galactic Nuclei and the
astroparticle connection
Research Summary and Prospectives submitted for the
HDR diploma by Andreas Zech
defended on June 30th, 2016 at the Observatoire de Paris
Jury members :
P. Coyle ( DR, rapporteur )
G. Henri ( professeur, rapporteur )
N. Webb ( astronome, rapportrice )
A. Djannati-Ataï ( DR )
J.-C. Hamilton ( DR )
B. Lott ( DR )
O. Martineau-Huynh ( MCF )
D. Rouan ( DR, président du jury )
Active Galactic Nuclei and the
astroparticle connection
Andreas Zech
Laboratoire Univers et Th´eories Observatoire de Paris
Research Summary and Prospectives submitted for the HDR diploma. 2016
Research on ultra-high-energy cosmic rays and on TeV γ-rays investigates the most energetic phenomena in the Universe. Connections between these two fields are not only given by the common indirect detection methods, but also by the possibility of common astrophysical sources. Among the very few objects proposed as sites for the acceleration of ultra-high-energy cosmic rays, Active Galactic Nuclei (AGNs) are still prime candidates. They also represent the almost exclusive class of extragalactic sources detected at the highest observable photon energies with ground-based Cherenkov telescopes.
The present document proposes an overview of a few selected observations of AGNs of the blazar class seen in TeV γ-rays with the H.E.S.S. experi-ment, together with interpretations of their multi-waveband emission based on different radiative transfer models. A special emphasis is put on so-called hadronic models, which try to provide a direct link between the observed electromagnetic emission and a possible accompanying flux of highly ener-getic cosmic rays and neutrinos.
The future of very-high-energy astronomy will be determined by the first open observatory in this domain, the Cherenkov Telescope Array. The ongo-ing preparation of this project is described, with a focus on the simulations of air showers and telescopes, necessary to determine its performance, and on the science case for AGNs.
Whoever ceases to be a student has never been a student. (George Iles)
J’aimerais remercier d’abord tr`es chaleureusement mes coll`egues les plus proches du LUTH — Catherine Boisson, H´el`ene Sol, Didier Pelat, Christophe Sauty — pour leur soutien quotidien depuis le d´ebut.
Mon travail pour le Master serait sans doute plus dur et moins agr´eable sans l’aide de Jacqueline Plancy, G´eraldine Gaillant et Pascal Gallais. Je tiens aussi `a remercier les administratrices et les informaticiens du LUTH pour leur soutien dans les luttes quotidiennes avec la bureaucratie et la technique...
Dans un environnement qui me semble devenir de moins en moins propice `a l’investissement personnel, au profit d’une hi´erarchie de plus en plus rigide, il est essentiel d’avoir des coll`egues comme vous !
Un grand merci `a Florence et Selma pour plusieurs longs week-ends com-muns sacrifi´es pour que je puisse finir ce document (et d’autres encore) !
Acronyms v
1 Introduction 1
2 Of air showers and deserts 5
2.1 Searching for cosmic rays at Dugway Proving Ground . . . 5
2.2 Searching for cosmic rays in the Pampa Amarilla . . . 10
2.3 Searching for γ-rays in the Khomas Highland . . . 13
3 AGN physics at very high energies with H.E.S.S. 17 3.1 An overview of extragalactic TeV emitters . . . 17
3.2 Two examples of VHE emitting blazars detected with H.E.S.S. . . 22
3.2.1 PKS 2155-304: multi-wavelength correlations . . . 22
3.2.2 PKS 0447-439: a redshift limit from GeV and TeV data . . . 29
3.3 First AGN observations with H.E.S.S.-II . . . 33
4 CTA, SST-GATE and the Future of VHE γ-ray Physics 37 4.1 Introduction to the Cherenkov Telescope Array . . . 37
4.2 Monte Carlo studies for CTA . . . 40
4.3 SST-GATE: a prototype telescope for CTA . . . 45
4.4 Prospects for AGN science with CTA . . . 53
4.4.1 The AGN science case . . . 54
4.4.2 Towards an observation programme for AGNs . . . 61
5 Interpreting blazar emission 71 5.1 SSC models . . . 71
5.1.2 SSC modelling of PKS 0447-439 and redshift constraints . . . 76
5.1.3 A systematic search of the SSC parameter space . . . 80
5.1.4 Time-dependent SSC modelling of flares . . . 83
5.2 External Inverse Compton models and equipartition . . . 87
5.3 A new lepto-hadronic model . . . 90
5.3.1 A short description of the LEHA code . . . 91
5.3.2 Physical constraints on our model . . . 93
5.3.3 A first application to extreme blazars . . . 95
6 Future prospects for the lepto-hadronic model 101 6.1 Hadronic spectral signatures for CTA (preliminary) . . . 101
6.1.1 Hadronic models for PKS 2155-304 and Mkn 421 . . . 102
6.1.2 SSC and mixed lepto-hadronic models . . . 109
6.1.3 Expected “cascade bump” signatures for CTA . . . 110
6.2 Towards a “complete” stationary lepto-hadronic blazar model . . . 116
6.3 Thoughts on time-dependent lepto-hadronic modelling . . . 120
7 (Preliminary) Conclusions 123
Acronyms
AGN Active Galactic Nucleus
AIRES Air Shower Extended Simulations
ALP Axion-Like Particle
ANTARES Astronomy with a Neutrino Tele-scope and Abyss environmental RE-Search
ARA Askaryan Radio Array
ARGO-YBJ Astrophysical Radiation with
Ground-based Observatory at Yang-BaJing
BLR Broad Line Region
CAT Cherenkov Array at Themis
CHEC Compact High-Energy Camera
CMB Cosmic Microwave Background
CORSIKA Cosmic Ray Simulations for Kas-cade
CTA Cherenkov Telescope Array
D-C Davies-Cotton (optical system) EBL Extragalactic Background Light
EIC External Inverse Compton
eLISA enhanced Laser Interferometer Space Antenna
FADC Flash Analog-to-Digital Converter
FACT First G-APD Cherenkov Telescope
FLASH Fluorescence in Air from Showers (experiment)
FRI or FRII radio galaxies of Fanaroff-Riley class I or II
GAPD Geiger-mode Avalanche Photodiode
GATE Gamma-ray Telescope Elements
GCT Gamma Cherenkov Telescope
GRAND Giant Radio Array for Neutrino De-tection
GRB Gamma-Ray Burst
GZK Greisen-Zatsepin-Kuzmin (cutoff in the UHECR spectrum)
HAWC High-Altitude Water Cherenkov Ob-servatory
HBL High-frequency-peaked BL Lac
ob-ject
HEGRA High Energy Gamma Ray
Astron-omy (telescopes)
H.E.S.S. High Energy Stereoscopic System HiRes High Resolution Fly’s Eye
experi-ment
IACT Imaging Air Cherenkov Telescope
IBL Intermediate-frequency-peaked BL
Lac object
IC Inverse Compton
IGMF Inter-Galactic Magnetic Field JEM-EUSO Extreme Universe Space
Obser-vatory on the Japanese Experiment Module (Int. Space Station) KM3NeT Cubic Kilometre Neutrino Telescope
KSP Key Science Project
LAT Large Array Telescope
LBL Low-frequency-peaked BL Lac object
LEHA Lepto-Hadronic code
LMC Large Magellanic Cloud
LST Large-Size Telescope for CTA
MAGIC Major Atmospheric Gamma Imaging
Cherenkov Telescopes
MC Monte Carlo (simulation)
MM Multi Messenger
MST Medium-Size Telescope for CTA
MWL Multi Wavelength
NLSy1 Narrow-Line Seyfert 1 (galaxy) NRT Nan¸cay Radio Telescope
PMT Photo-Multiplier Tube
PSF Point Spread Function
SC Schwarzschild-Couder (optical
de-sign)
SED Spectral Energy Distribution
SLAC Stanford Linear Accelerator
SMBH Supper-Massive Black Hole
SOPHIA Simulations Of Photo Hadronic In-teractions in Astrophysics
SSC Synchrotron Self-Compton
SST Small-Size Telescope for CTA
TA Telescope Array
TDR Technical Design Report
UHBL Ultra-High-frequency peaked BL Lac object
UHECR Ultra-High-Energy Cosmic Ray VERITAS Very Energetic Radiation Imaging
Telescope Array System
Introduction
This document provides a short summary of my research work on the physics of ultra-high-energy cosmic rays1 (UHECRs) and a more detailed discussion of my research on the very-high-energy2 (VHE) γ-ray emission from blazars. While both topics belong to the relatively young interdisciplinary field of astroparticle physics, this work is marked by a transition from a field of research close to particle physics to a field that is now being fully integrated into astrophysics. Both are connected not only by the indirect detection methods employed, making use of the physics of electromagnetic cascades in the atmosphere, but also by the possibility — not yet confirmed — of common astro-physical sources. On a more personal level, the work described here shows a transition from a mainly experimentally based research to a more theoretical or phenomenological approach.
After three years of studying physics at the Universit¨at W¨urzburg in Germany, I first came into contact with astroparticle physics during a year of studies abroad in 1999 at Rutgers University, in New Jersey (USA), which was finally prolonged into a PhD thesis. The topic of my thesis was the measurement of the spectrum of UHECRs with the newer one of the two air fluorescence telescopes of the High-Resolution Fly’s Eye experiment (HiRes). An essential part of this work was the precise description of the instrumental response of this telescope to simulated air showers. My studies have contributed to a first measurement of a flux suppression in the UHECR spectrum at an energy consistent with the expected “GZK-cutoff” at around 6 × 10¹⁹eV. During my
1
cosmic rays with energies above about 1016eV
thesis, I have also contributed to a measurement, at the Stanford Linear Accelerator (SLAC), of the fluorescence yield of energetic electrons in air, a key parameter for measurements with air fluorescence detectors like HiRes.
Returning to Europe in 2005, I was then working for two years on the analysis of data from the Pierre Auger Observatory and on comparisons between real and sim-ulated data, as a postdoc at the LPNHE laboratory in Paris. I have contributed to the determination of the resolution of air shower parameters and was involved in the measurement of the UHECR composition, mostly using “hybrid” events, for which data are available from both air fluorescence telescopes and surface detectors.
In 2007, I joined the LUTH laboratory at the Observatoire de Paris with a position as a Maˆıtre de Conf´erences. I have since then been working in the field of VHE γ-ray astronomy.
The main objective of my present research is to arrive at a better understanding of the physics of Active Galactic Nuclei (AGNs), especially the small fraction of these sources that are detected in VHE γ-rays and thus are certain to harbour populations of highly relativistic particles, and to evaluate potential links between these sources and the still unknown origin of UHECRs. My studies are following roughly three main directions:
1) The detection of AGNs in VHE γ-rays with the Cherenkov telescopes of the H.E.S.S. experiment and the interpretation of their multi-wavelength emission.
As a member of the H.E.S.S. Consortium, I have contributed to the development of sim-ulations of air showers and of the response of the telescopes (together with Clementina Medina who worked as a postdoc at the LUTH at the time) and I was involved in the reduction and analysis (spectral and temporal) of H.E.S.S. data for several blazars. The application of different synchrotron self-Compton (SSC) scenarios to the spectral energy distributions (SEDs) of the two blazars PKS 2155-304 and PKS 0447-439, for example, have permitted to constrain the physical characteristics of their high-energy emission regions. I have also carried out several observational shifts in Namibia and contributed to the definition of the observation programme and to internal reviews of several publications by the H.E.S.S. Consortium.
In the latter, the high-energy part of the SED is assumed to be due to interactions of relativistic hadrons (usually protons) with photons and magnetic fields inside the source, in addition to relativistic electrons responsible for the emission at lower energies. Hadronic models represent thus an alternative to the purely leptonic models, which have become more or less a standard to describe the emission from blazars. They are especially interesting in view of the direct link they provide to the emission of (ultra) high-energy hadrons and neutrinos. The development of a “lepto-hadronic” code, allowing for the first time a full treatment of leptonic and hadronic scenarios within a single coherent framework, was part of Matteo Cerruti’s PhD work, which I co-directed. This code has since been used to explain the multi-wavelength (MWL) emission for a class of “extreme” blazars with particularly hard high-energy spectra. We are currently exploring the “lepto-hadronic” parameter space for a more numerous class of γ-loud blazars and are also investigating the accompanying emission in the form of cosmic rays and neutrinos.
3) The preparation of the next generation VHE observatory, the Cherenkov Telescope Array.
My activities as a member of the consortium of the Cherenkov Telescope Array (CTA) were in the beginning centred on the simulation of air showers (together with Clementina Medina) and then on the simulation of the optical system of the small-size GCT tele-scope (together with Cameron Rulten during his postdoc at the LUTH). I have also been, from the beginning, involved in the definition of the scientific objectives of CTA concerning the physics of AGNs. This work included for example predictions of the number of radio-loud AGNs from different classes that would be detectable with CTA. It has culminated in the description of the observational programme to be carried out by the collaboration in the form of Key Science Projects. I have been coordinating the efforts around the AGN Key Science Project as one of the conveners of the extragalactic working group for CTA.
Following this quick introduction, the second chapter of the present document is dedicated to a short review of my personal experience on different projects in the above mentioned fields, including HiRes, Auger and H.E.S.S.
The following three chapters (Chap. 3,4, 5) attempt to provide a scientific review of the research I have carried out so far in VHE γ-ray astronomy. This part of the document is to a large extent not an original text, but rather a “reader’s digest” of already existing material; it contains excerpts from several articles I have written myself or to which I have made a contribution. The source of the material and my implication is stated in the beginning of each (sub-)section.
Chapter three provides an overview of the current state of research on AGNs with ground-based Cherenkov telescopes, while the future prospective in this field, linked to the CTA project, is discussed in Chapter four. Chapter five is dedicated to our current understanding of the origin of the high-energy blazar emission, which is based on simplified models of the radiative transfer inside those sources.
In the remaining two chapters (Chap. 6, 7), I am attempting an outlook on the future applications and evolution of the lepto-hadronic model and on my personal research projects.
Of air showers and deserts
This Chapter is meant to give a short overview of my past research activities in chrono-logical order, seen from a personal perspective.
2.1
Searching for cosmic rays at Dugway Proving Ground
My first encounter with astroparticle physics took place in 1999 at Rutgers University in New Jersey, US. I initially went to Rutgers for a year of Master’s studies thanks to an exchange programme with the Universit¨at of W¨urzburg, where I had carried out my undergraduate studies. Prof. Gordon Thomson introduced me to the field of UHECR physics. Himself a particle physicist, with experience on kaon decay experiments at Fermilab among other things, he had recently joined the HiRes experiment1, which was aiming to measure the spectrum, composition and arrival directions of the most energetic particles ever detected.
The HiRes collaboration set out to explore the high-energy end of the observable cosmic-ray spectrum and to solve the puzzle of detections of so-called “super-GZK” events, reported by the ground-array experiments SUGAR (Anchordoqui & Goldberg,
2004), Haverah Park (Ave et al.,2003), Yakutsk (Glushkov et al.,2003) and especially the Akeno Air Shower Array (AGASA). The latter, a 100 km2 array of scintillation detectors located in the Japanese Alps, which sampled the particle distribution of air showers, had reported a continuation of the cosmic-ray spectrum with no sign of any spectral change at energies above 1020 eV (Takeda et al., 2003). This surprising
result was in clear violation of the expected flux suppression due to the interaction of cosmic-ray protons with the cosmic-microwave-background (CMB) photons that should have led to photo-pion production and to a reduction of the initial cosmic-ray energies (the so-called GZK effect, named after its discoverers Greisen, Zatsepin and Kuzmin). The GZK effect necessarily leads to a flux suppression above about 6×10¹⁹ eV for protons travelling farther than about 50 Mpc, i.e. coming from sources outside of the local supercluster. If the cosmic rays at the highest energies were heavy nuclei rather than protons, photo-spallation would lead to a flux suppression at similar energies, although with a slightly different spectral shape. In the absence of nearby sources that could account for acceleration to such elevated energies, many exotic scenarios, including topological defects, “z-bursts” and cosmic strings, where invoked to explain these unexpected detections.
Figure 2.1: A pair of mirrors and cameras of the HiRes-I detector. c HiRes Collaboration
The flux of cosmic-ray particles decays following approximately the third power in energy, which means that at energies above about 1015 eV balloon- or space-borne de-tectors can no longer provide the effective area necessary for direct detection. Indirect
detectors on the ground measure the cascades of secondary charged particles that are triggered when a primary cosmic ray with sufficiently high energy interacts with the atoms in the Earth’s atmosphere (so-called “air showers”). Hadronic interactions and electromagnetic cascades lead to a multitude of particles — mostly electrons, positrons, γ-rays and muons —- which can be detected either on the ground, with arrays of scintil-lators or water Cherenkov detectors, or through their excitation of nitrogen molecules in the atmosphere, visible as weak ultra-violet “fluorescence” light. The latter can be detected with telescope units consisting usually of a single mirror with a very large field of view and a camera equipped with photo-multiplier tubes to allow a rapid response below the micro-second. The combination of several such units allows to search a large portion of the night-sky for the isotropic fluorescence light from air showers.
The predecessor of HiRes, the Fly’s Eye experiment, was the first experiment that used the “air fluorescence” technique to detect UHECRs. It had detected a “super-GZK” event with a record energy of 3×10²⁰eV, but did not provide the necessary effective area to measure the spectrum at the highest energies (Bird et al.,1995). HiRes (see Fig.2.1) was the first stereoscopic air fluorescence facility and provided improved resolution and sensitivity compared to the Fly’s Eye.
Both ground arrays and air fluorescence telescopes rely on detailed Monte Carlo sim-ulations of the air shower development in the atmosphere and of the detector response for the correct reconstruction of the direction, energy and eventually the composition of the primary cosmic-ray particle. While ground arrays rely heavily on simulations for the energy reconstruction of the air shower, of which only its lateral particle distribu-tion is known, fluorescence telescopes have an effective area that depends on the energy of the air shower and that needs to be modelled carefully. Thus my first implication in HiRes was the development of a library of simulated air showers, using the exist-ing Monte Carlo programs CORSIKA (Heck et al.,1998) and AIRES (Sciutto, 1999), and the simulation of the effective area of the HiRes-II detector. This telescope was equipped with an FADC based data acquisition system and the correct estimation of its response to the air showers from the library required a detailed simulation of the detector electronics and the night-sky background.
After my one-year stay, I decided to continue my research with Gordon Thomson’s group and to write my PhD thesis on this subject, which I completed in 2004, two years before the end of the HiRes experiment. Based on an existing code that I developed
further and into which I integrated the shower library, fake data were simulated and compared in detail to the detected real events to guarantee the correct description of the detector and the air shower development (Zech & HIRES collaboration, 2001;
Zech & HIRES Collaboration,2003). The simulation chain was then used to calculate
the effective area of the detector, needed to convert the measured event distribution into the cosmic-ray flux arriving at the detector. This work, together with the event reconstruction also carried out by our group at Rutgers University, resulted in the measurement of the UHECR spectrum with the HiRes-II detector (Abbasi et al.,2004;
Zech & High Resolution Fly’s Eye Collaboration,2004). The combined measurements
of the two HiRes detectors finally led to the detection of a flux suppression in the UHECR spectrum (see Fig. 2.2), which was interpreted as the GZK effect (Abbasi
et al., 2008). I also carried out a detailed study of different sources of systematic
effects on the determination of the effective area, including the assumed cosmic-ray composition and the air shower generator (High Resolution Fly’s Eye Collaboration et al.,2007). log10(E (eV)) Flux*E 3 /10 24 (eV 2 m -2 s -1 sr -1 ) AGASA HiRes-1 Monocular HiRes-2 Monocular 1 10 17 17.5 18 18.5 19 19.5 20 20.5 21
Figure 2.2: The UHECR spectrum measured in monocular mode with the two HiRes detectors, compared to the AGASA measurement. Taken fromAbbasi et al.(2008).
experiment on many occasions. HiRes, like its predecessor, was located in the desert of Utah, about a two hours drive from Salt Lake City, inside the military base “Dugway Proving Ground”, a site used by the US army for weapons testing, which had the advantage of providing all the necessary infrastructure for the project. In the wake of the events of September 11th, 2001, access to the base was unfortunately denied to all non-US citizens. Most of the operations of the HiRes detectors could be carried out with remote systems by that time. Apart from the operation of the detectors, I was also involved in the calibration of the photo-multiplier tubes at the University of Utah.
Figure 2.3: Measurement of the air fluorescence yield by the FLASH collaboration (“T-461”), compared to results from other groups. Taken from Flash Collaboration et al.
(2006).
FLASH (FLuorescence in Air from SHowers), a spin-off project of HiRes was aimed at the exact measurement of the air fluorescence yield, a crucial parameter in the
calibration of the energy of detected air shower signals. My implication in the FLASH collaboration consisted mostly in carrying out measurements of the fluorescence yield of an electron beam in an interaction with pure nitrogen and with air in 2003 at SLAC. The electrons in the beam had an energy of 28.5 GeV and probed for the first time the yield in the multi-GeV range. Assuming that the fluorescence yield is proportional to the energy deposited by the electrons travelling through air, the result is in good agreement with previous measurements at lower energies (cf. Fig. 2.3). Subsequent experiments helped to improve significantly the systematic uncertainties related to the fluorescence yield.
2.2
Searching for cosmic rays in the Pampa Amarilla
The presence or absence of the GZK flux suppression was only one of several open issues in UHECR physics. The ultimate question about the nature, the sources and the acceleration mechanisms of these particles led to studies not only of the cosmic-ray spectrum, but also of the distribution of arrival directions and of the composition of the UHECR flux. The Pierre Auger Observatory1 was built with a roughly 10 times higher effective area than previous UHECR detectors to provide access to the highest energies of the UHECR spectrum and study the energy range around the GZK flux suppression.
When I had finished my thesis on the HiRes project, I joined the Auger group at the LPNHE (CNRS, Universit´e Paris 6 & 7) for a two-year postdoctoral position, from 2005 to 2007, on a European “Marie-Curie” fellowship. The Southern site of the Pierre Auger Observatory was at that time still under construction in Argentina, in the Pampa Amarilla (province of Mendoza), but first scientific data began to become available. “Auger South” was completed in 2008. A planned Northern array in Colorado has not been funded, but the successor of HiRes, the Telescope Array2 (TA), a hybrid air fluorescence and scintillator array in Utah, is operating in the Northern Hemisphere.
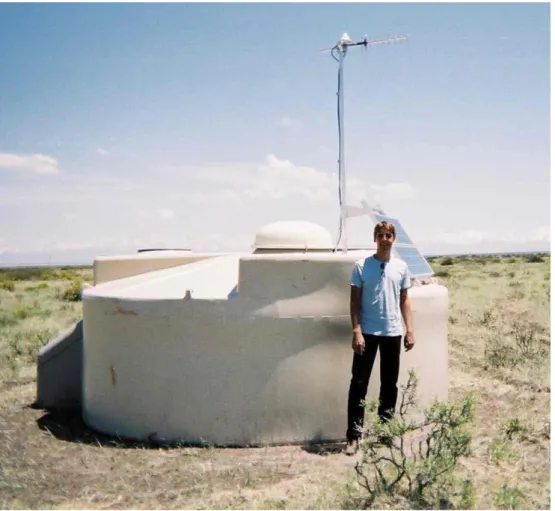
Apart from its increased effective area, the main interest of Auger is the combination of the two detection techniques that were seen in the past to provide incompatible results, i.e. the combination of a large ground array of water Cherenkov tanks (see
1
https://www.auger.org
Fig.2.4) with four fluorescence telescopes. Air showers detected with both components at a time, so-called hybrid events, allow the comparison of the shower reconstruction based on the the two different methods. I was using a sample of “golden hybrid events”, i.e. air showers with sufficient information from both ground detectors and fluorescence telescopes to be reconstructible independently with either technique, to evaluate the resolution in the shower geometry and energy of the fluorescence and surface detector reconstructions (Zech,2005a,b, (internal notes)).
I have also studied correlations between indicators of the cosmic-ray composition from the two different techniques (Zech,2007, (internal note)). Both rely on the fact that air showers induced by heavy nuclei develop higher up in the atmosphere than the ones triggered by protonic cosmic rays. With the air fluorescence telescopes, one can directly access the longitudinal profile of the air shower as it develops in the atmosphere and “light” air showers can be statistically distinguished from “heavy” air showers through the atmospheric depth where the shower maximum is reached. For ground detectors, this effect leads to a difference in the rise-time of the recorded FADC pulses and in the reconstructed curvature of the front of the air shower as it touches the ground. Both methods have been used by the Auger Collaboration to measure the composition of the UHECR flux (e.g. Boncioli,2014).
My work for the Pierre Auger collaboration included as well shifts on the site in Argentina. While the water Cherenkov detectors (see Fig. 2.4) are acquiring data continuously, day and night, the four fluorescence telescope stations observe only during clear, moonless nights and need to be operated remotely by shift personnel from the nearby operations room in Malarg¨ue.
The measurement of the UHECR spectrum with Auger has confirmed the existence of a flux suppression at the highest energies (Abraham et al., 2008), but its determi-nation of a heavy or mixed cosmic-ray composition at the highest measurable energies introduced a new contradiction with previous results from HiRes, which favoured an almost pure proton composition at the highest energies, also confirmed by more recent data from TA (Abbasi et al., 2015b). A joint working group between the two exper-iments has found in a preliminary study that the difference between the Auger and TA/HiRes results might not be statistically significant, due to the small number of events at energies above 1019eV (Abbasi et al.,2015a).
Figure 2.4: A surface detector (“Cherenkov tank”) at the Pierre Auger Observatory in Argentina.
The actual behaviour of the UHECR composition has important implications for the interpretation of the UHECR arrival directions and for the study of acceleration mechanisms (and thus the potential sources). In the case of a protonic composition, features in the UHECR spectrum are interpreted with electron-positron pair produc-tion (causing the “ankle” at about 1018.5eV) and with the GZK effect (causing the flux suppression at about 1019.8eV). This points to distant sources (beyond the “GZK horizon”), in which protons can be accelerated to at least 1020eV, and to a chance of correlating the most energetic events with known source types. Some evidence for such a correlation, suggesting a possible connection with AGNs, was seen with the Pierre Auger Observatory (Pierre Auger Collaboration et al., 2007), but the strength of this signal has since been declining with increased statistics. In the meantime, a
large “hotspot” with a significance of 5.1 standard deviations has been detected in the northern sky above 5.7 × 10¹⁹eV with TA (Abbasi et al.,2014) and is now under investigation.
If the composition of the most energetic cosmic rays is mixed or heavy, the “ankle” feature needs a different explanation, probably indicating the transition between Galac-tic and extra-galacGalac-tic cosmic-ray spectra, and the flux suppression at the end of the spectrum would no longer be a clean “GZK” signature (see e.g.Kampert,2014). In this case, the constraints on the conditions of the acceleration regions of UHECRs, in terms of magnetic field strength and extension, would be less stringent due to the smaller gyroradius of heavy nuclei as compared to protons, but the prospects for “UHECR astronomy” would be very reduced due to the much larger deflections of charged nuclei in intergalactic and Galactic magnetic fields. An answer to this question might have to wait for the much larger effective area of the JEM-EUSO experiment.
A unique signature of hadronic emission from an astrophysical source would be provided by the capture of neutrinos from that source. The discovery of several tens of astrophysical high-energy neutrinos, likely of extragalactic origin, in the ICECUBE data is a very exciting step into this direction (Aartsen et al.,2014). A first promising hint of a correlation of one such neutrino with a blazar flare has already been found (Kadler et al.,2016).
While waiting for more neutrino statistics to increase the significance of potential correlations with sources, the best chance of finding signatures for UHECR emission from AGNs or the few other astrophysical sources admitted by the Hillas criterion (notably GRBs) might come from indirect signatures in γ-ray spectra of extragalactic sources, as will be discussed in Chapter6.
2.3
Searching for γ-rays in the Khomas Highland
The indication of a correlation between the distribution of AGNs and the arrival di-rections of the most energetic UHECRs detected with Auger, although not confirmed with more recent data, raised the interest in AGNs as potential sources of UHECRs. Several scenarios have since been proposed to explain the possibility of acceleration to ultra-high energies in AGNs, with several focusing on the most nearby radio-galaxy, Centaurus A (e.g.Reynoso et al., 2011,2010;Rieger & Aharonian,2009; Sahu et al.,
2012). This potential link between UHECRs and AGNs has first awoken my curiosity in the physics of these highly energetic extragalactic sources.
I joined the high-energy “PHE - ph´enom`enes `a hautes ´energies” group at the LUTH, and the H.E.S.S.1 collaboration, in 2007 as a Maˆıtre de Conf´erences at the Observa-toire de Paris. The High Energy Stereoscopic System (H.E.S.S.), is an array of five imaging air Cherenkov telescopes (IACTs) that observes the sky in the VHE range. IACTs capture images of air showers triggered by cosmic rays or γ-rays in the Earth’s atmosphere, but different from air fluorescence telescopes, they collect the strongly anisotropic Cherenkov light that is emitted mainly along the direction in which the shower is moving, making them sensitive to γ-ray induced showers in the VHE band. Cosmic rays at comparable energies constitute a very dominant background, which needs to be rejected with increasingly sophisticated pattern recognition algorithms. The reconstruction of the air shower permits to determine the γ-ray source on the sky and its energy spectrum. The angular resolution is limited by a point spread function (PSF) with a width of typically several arcminutes,
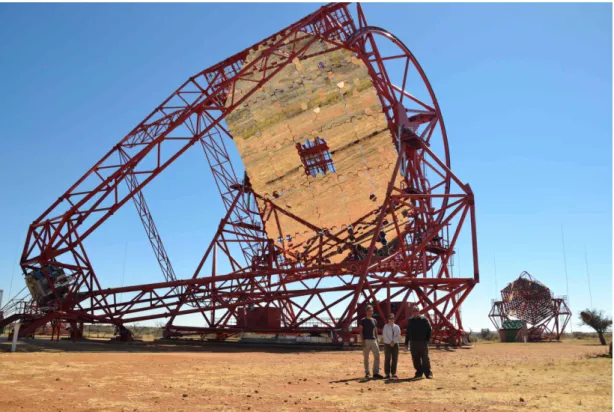
Given my experience with air shower physics, albeit at higher energies, I have first been involved in systematic studies of the influence of the atmospheric description on the simulated Cherenkov light profiles at TeV energies for H.E.S.S. At the same time, I have helped establish an expertise on the H.E.S.S. data analysis at the LUTH, in close collaboration with colleagues from the APC laboratory. I also had the opportunity to take shifts at the site of the H.E.S.S. experiment, in the Khomas Highland in Namibia. During one such shift, in July 2012, I participated in the first acquisition of data with the newly built “CT5” telescope (see Fig. 2.5), which provides access to sources at energies below 100 GeV and thus an overlap with the energy range currently covered with the LAT instrument of the Fermi satellite.
My current research work within the H.E.S.S. collaboration concerns the analysis of VHE data, together with a full multi-wavelength picture whenever possible, from AGNs and their interpretation with emission models that simulate the radiative transfer in the emitting region. Some details of the analysis of two blazars, PKS 2155-304 and PKS 0447-439, will be given in Chapter 3, while a description of the source modelling is reserved to Chapter 5.
The detection of γ-rays from certain AGNs, mostly blazars and a few radio galaxies (Centaurus A among them), is direct proof for particle acceleration up to highly rela-tivistic energies in these sources. The questions that remain concern the exact location of the emission region inside the source, the acceleration mechanism and the nature of the accelerated (and radiating) particles. Very rapid variability, detected down to the scale of a few minutes as in the case of the blazar PKS 2155-304 (Aharonian et al.,
2007), and correlations between flares in the radio and high energy bands, as seen e.g. in multi-wavelength campaigns of the radio-galaxy M87 (Acciari et al.,2009), put strong constraints on the size of the emission regions, which are thought to be close to the central engine in most scenarios.
The comparison of emission models, describing in detail the radiative processes as-sumed to be at play inside the source, with data of the SED, ideally covering the whole wavelength range from radio to VHE γ-rays, provide insights into the physical pro-cesses underlying the detected radiation. For most blazars detected in the VHE range, the simple one-zone SSC scenario, based on emission from a population of relativistic electrons and positrons in a dense magnetised region of the jet, in certain cases with the addition of external photon fields, provides a good description of the high-energy emission (from X-rays to the VHE range). More complex approaches are required in the case of a few blazars with very hard spectra in the TeV range, as well as for radio galaxies.
Modelling the spectral distribution can provide constraints on the energy distri-bution of the underlying particles and thus on the acceleration mechanism inside the source, even though the current standard emission models generally lack a thorough description of the acceleration process itself and rather adopt an ad hoc parameterisa-tion of the energy distribuparameterisa-tion. There is also, in general, no adequate descripparameterisa-tion of the jet environment in which the dense source region is supposed to be located.
To describe MWL spectral distributions from blazars, leptonic emission models are often preferred to hadronic models, simply because the latter come with a much larger set of free parameters, and current data are in general not sufficiently detailed to constrain them. The strongest constraints come from the detection of flares over a range of wavelengths. A physical argument in favour of leptonic emission models is the detection of rapid variability at the highest energies, which is difficult to explain with a hadron population, given the longer acceleration and cooling time scales compared
Figure 2.5: The CT5 telescope of the H.E.S.S.-II array in Namibia. ( c A. Jahnke, 2012.)
to the lighter leptons. This does not rule out that relativistic hadrons could account at least for a part of the detected γ-ray emission.
With future data of improved photon statistics, signatures for relativistic hadrons might be detectable in the VHE γ-ray spectra of certain AGNs and might provide for UHECRs the same indirect access to their sources as the detection of γ-rays from molecular clouds and supernova remnants is providing for galactic cosmic rays.
AGN physics at very high
energies with H.E.S.S.
3.1
An overview of extragalactic TeV emitters
This section contains small excerpts fromZech & H.E.S.S. consortium (2009), which I wrote.
With the exception of two starburst galaxies, NGC 253 and M 82, and a few sources in the Large Magellanic Cloud (LMC) (Abramowski et al.,2015), at present all the ex-tragalactic sources detected in the VHE regime with ground based Cherenkov telescope arrays, such as H.E.S.S., MAGIC and VERITAS, are AGNs. Observations of galaxy clusters (e.g.Aharonian et al.,2009e) and GRBs (e.g.Aharonian et al.,2009b) have so far only yielded upper limits.
AGNs account for nearly 40% of all sources detected at VHE, with pulsar wind nebulae and supernova remnants making up most of the remaining fraction (plus a few stellar clusters, molecular clouds, X-ray binaries and a certain fraction of unidentified sources in the Galactic Plane). All of the VHE AGNs are radio-loud and are sup-posed (and in some cases known) to present jets on pc to kpc or even Mpc scales that are powered by the central engine and are thought responsible for the observed non-thermal emission at high energies. Only four of the VHE AGNs — M 87, Centaurus A, PKS 0625-35 and NGC 1275 — belong to the class of Fanaroff-Riley type 1 (FR-I)
radio-galaxies1; the remaining sources are blazars, i.e. flat-spectrum radio quasars (FSRQs) or BL Lac objects (“BL Lacs”), whose jets are closely aligned to our line of sight, thus presenting a strong amplification of the emitted flux due to relativistic beaming effects. Blazars are in general highly variable sources, on time scales ranging from years to a few minutes, with highly polarised emission.
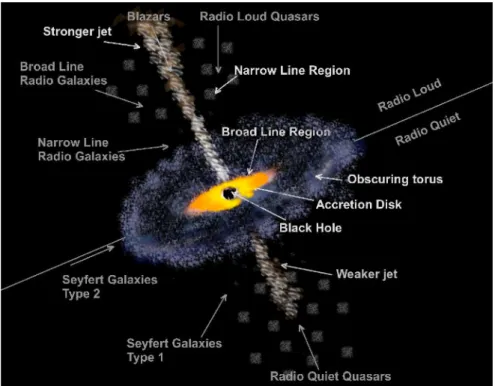
To a first approximation, the apparent difference between blazars and radio galax-ies can be explained with the AGN unification schema invoking a single object seen under different viewing angles (cf. Fig. 3.1). This simple picture becomes more com-plicated, however, when one considers the different emission characteristics between various blazar types and radio-galaxy classes.
Figure 3.1: AGN unification schema. Radio-loud and radio-quiet objects are represented in the same figure. To a first approximation, the various AGN classes are differentiated only by the viewing angle and strength (or presence) of the radio jet. Taken fromDutan
(2010).
Within the blazar “family”, FSRQs are more luminous than BL Lacs and are char-acterised by strong emission lines in the optical and ultraviolet. These can be explained
by photons from the strong accretion disk that are reprocessed in the “broad line re-gion” (BLR) of circum-nuclear gas clouds. In BL Lacs, these lines are very weak or absent, due to a supposedly weaker accretion disk and thus much less significant photon fields. The general SED of the blazar broad-band emission exhibits two large bumps: the first one, which is found at X-ray/UV energies in “high-frequency-peaked” BL Lacs (HBLs) and at optical energies in “low-frequency-peaked” BL Lacs (LBLs) and FSRQs, is usually ascribed to synchrotron emission from a relativistic population of electrons. The second bump, at GeV/TeV energies in HBLs and usually at hard X-rays in LBLs and FSRQs, is interpreted as inverse Compton emission from electrons up-scattering synchrotron or external photons in the standard leptonic models. (For an example of a typical SED of an HBL, the reader might refer to Fig.5.1or5.2in Section5.1.) The original classification of BL Lac objects as HBLs or LBLs was proposed by Padovani
& Giommi (1995a,b), based on the ratio between the radio flux at 5 GHz and the
X-ray flux at 1 keV. Today, these categories, to which “intermediate-frequency peaked” BL Lacs (IBL) were added, are often defined using the position of the synchrotron peak (e.g.Ackermann et al.,2011).
As can be seen from the sky map shown in Fig. 3.2, which is based on the sources listed in the TeVCat catalogue1, the population of VHE AGNs is largely dominated by HBLs, accounting for almost three quarters of the current 65 sources. Even though less luminous than FSRQs, their high-frequency peak and hard high-energy spectra make HBLs the most readily accessible objects for ground-based γ-ray telescopes.
Out of the 46 HBLs detected so far in the TeV range, five sources — 1ES 0229+200, 1ES 0347-121, 1ES 1101-232, 1ES 1218+304 and H 1426+428 — exhibit particularly hard spectra with the high-energy peak above ∼1 TeV. While providing strong de-tections for Cherenkov telescopes, their signal is very weak in the MeV/GeV energy band covered by the Fermi-LAT space telescope. Another common characteristic is the absent or very slow variability of the (very) high-energy flux (with the exception of 1ES 1218+304, which showed variability on the scale of days). This particularity has led to a new classification of these “extreme” blazars as “ultra-high-frequency peaked” BL Lacs (UHBLs).
Blazars of the LBL/IBL and FSRQ class, are naturally much less present in the VHE sample, due to the lower frequencies of the peaks in their SEDs. FSRQs are
° 0 ° -90 ° +90 ° -180 ° +180 HBL IBL LBL FSRQ radio gal. blazar redshift 0 0.2 0.4 0.6 0.8 1 1.2 # of sources 2 4 6 8 10 TeVCat 02/16: 65 sources
Figure 3.2: Sky map in Galactic Coordinates showing the positions of the 65 AGN and their classes detected in the VHE range so far (status of February 2016). The redshift distribution of the sources is shown in the histogram below.
very numerous in the Fermi-LAT band and their MeV/GeV emission is generally well described with soft, logparabola-shaped spectra, with no detectable flux in the TeV range. Only five FSRQs have been added to the list of VHE sources so far: 3C 279, which frequently shows very important flares that render it detectable, PKS 1510-089, PKS 1441+25, S4 0954+65 and 4C 21.35. With slightly higher energies of their peaks in the SED, seven blazars of the LBL/IBL class, among them BL Lacertae, W Comae and Ap Librae, have also been detected. These are very interesting objects and first attempts at their interpretation seem to require additional photon fields, which could make them the “missing link” between the FSRQ and BL Lac populations. In a slightly different scenario, a recent model for Ap Librae, invoking significant contributions to the SED from both a compact source inside the jet and the jet itself, has been proposed
byHervet et al. (2015).
While the VHE emission from blazars is in general relatively well described with inverse Compton emission from relativistic electrons within the jet, amplified by rel-ativistic beaming, the emission from nearby radio-galaxies detected at VHE is more difficult to account for. These sources, thought to be the parent population of the BL Lacs, are often described as “misaligned blazars”, where a large viewing angle between jet and observer is held responsible for the less beamed and thus weaker emission (e.g.
Aharonian et al.,2009a).
The redshift distribution of the VHE AGNs, included in Fig. 3.2, shows a strik-ing difference between the bulk of HBLs, centred around a redshift of z≈0.1 and the few FSRQs that occupy the highest redshifts in this distribution, up to z=0.94 for PKS 1441+25. This reflects the intrinsic difference between the BL Lac and FSRQ populations that is also seen with the Fermi-LAT (e.g.Ackermann et al., 2011). The fact that the redshift reach of current ground-based instruments is very limited, is due to the absorption of γ-rays in the VHE range on the extragalactic background light (EBL). The EBL is the sum of the light emitted from stars, and in part reprocessed to longer wavelengths by dust, throughout the evolution of stellar populations in the uni-verse. Pair production by high-energy γ-rays on the infrared and optical background photons leads to significant losses of the γ-ray flux at sufficiently high energies and for distant sources. This strongly limits the redshift range of Cherenkov telescopes compared to space-based telescopes, which operate in a lower energy band. Only an extension of ground-based instruments to lower energies, i.e. below the current thresh-old of roughly 100 GeV, will allow us to probe more distant sources with the superior sensitivity of IACT arrays compared to satellites. A first step in this direction has been made by the MAGIC and H.E.S.S.-II experiments.
To determine the intrinsic spectral shape of the observed AGNs, the energy- and redshift-dependent absorption on the EBL has to be taken into account with the help of estimates of the EBL density from galaxy counts and models of galaxy evolution. The TeV data from blazars, on the other hand, have become increasingly important in con-straining those models, based on minimal assumptions of the emission and acceleration processes inside the sources (for a recent review seeBiteau & Williams,2015).
After correction for the EBL, the intrinsic VHE spectra of the observed AGNs yield information on the acceleration process of the underlying distribution of highly
rela-tivistic particles. Most of the VHE AGN spectra are well described with power laws with photon indices between ∼2 and ∼4.5. More complex shapes are distinguished mostly during flares of bright sources, where photon statistics are sufficiently high. The bright blazer Mkn 421, for example, showed an exponential cutoff at about 3 TeV during a high state Aharonian et al. (2005b). The spectral shape of this source was seen to change with the varying flux between different nights, being consistent with a hardening of the spectrum with increasing flux, which could arise from the injection of highly energetic particles into the emission region. In general, spectral variability during flaring episodes can be directly related to the dynamics of particle injection or acceleration, and cooling processes, and is thus an important diagnostic tool. The ob-served variability time scale during flares or high states also yields valuable constraints on the size of the emission region, due to causality arguments.
In the following section, I will discuss a few aspects of the observations of two BL Lac objects, PKS 2155-304 and PKS 0447-309 with the H.E.S.S. Cherenkov telescopes. The wealth of information from two VHE flares of PKS 2155-304 in 2006, followed up with a multi-wavelength campaign, shows the importance of observing multi-band variability for our understanding of astrophysical sources. The case of PKS 0447-309 points out how combined TeV and GeV data can help constraining the redshifts of BL Lacs, which are notoriously difficult to measure. An interpretation of the SEDs of these sources with radiative transfer models is given in Chapter 5.
3.2
Two examples of VHE emitting blazars detected with
H.E.S.S.
3.2.1 PKS 2155-304: multi-wavelength correlations
This section contains excerpts from H.E.S.S. Collaboration et al.(2012), which I wrote with the help of C. Boisson and with many inputs from my colleagues of the H.E.S.S. Consortium.
The average flux of most HBLs detected with H.E.S.S. is roughly 2% of the flux from the Crab Nebula above 200 GeV, with the exception of PKS 2155-304, which is the brightest blazar in the southern sky and is regularly monitored. This source is seen at 15% of the Crab during low states and was observed with a flux of up to 15 times
the flux from the Crab Nebula during a very high state in July 2006 (Aharonian et al.,
2007). Two separate, exceptionally bright flares occurred during this high state with flux variations by a factor of ∼20 in only a few hours and with a flux-doubling time scale down to ∼3 minutes. Such very rapid variability implies either an unusually large bulk Doppler factor1 (of the order of 100) of the γ-ray source in the jet or the existence of a very compact emission region, whose size does not scale, as is generally expected, with the Schwarzschild radius of the central black hole, but is much smaller.
Short-term variability is also seen in other sources, e.g. Mkn 421 in 2004, where H.E.S.S. detected intra-night variability with a decay time of less than 1 hrAharonian
et al. (2005b), consistent with the rapid variability of < 15 min seen with Whipple
Gaidos et al. (1996). However, flux variations at the scale of only a few minutes are
rare even for blazars and are very difficult to account for in the current frameworks of emission modelling. The spectrum of the second flare was consistent with an expo-nential cutoff at ∼1 TeV or with a log-parabolic function and spectral hardening was observed with increasing flux.
This exceptional activity triggered Target of Opportunity observations on the source with the X-ray telescopes SWIFT and RXTE, and multi-wavelength monitoring started one day after the first flare had been detected (July 28/29, MJD 53944). Simultaneous data from the CHANDRA telescope were only available for the night of the second flare (July 30). A study of simultaneous observations in the X-ray and VHE bands during the second flare (Aharonian et al.,2009c) found a very steep correlation between the X-ray flux detected with CHANDRA and the VHE γ-ray flux, with the flux in the VHE band decreasing approximately as the third power of the X-ray flux. No indication for a time-lag between those bands was detected.
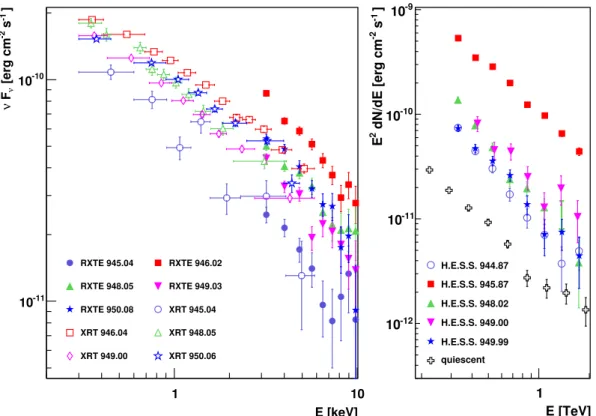
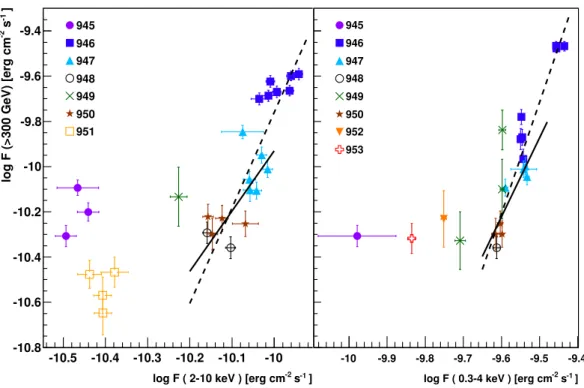
While the data set from H.E.S.S. and Chandra for the flare on July 30 provides a unique opportunity for the interpretation with emission models, the multi-wavelength data taken over the whole observational period, 9 nights starting after the first flare, are important for a more complete view. When examining the evolution of the X-ray and VHE fluxes (Fig.3.3and3.4), one can see, also on this time scale of several nights, that variations in the VHE flux correlate to variations in the X-ray flux observed with RXTE and SWIFT XRT.
1δ
b = [Γb(1 − βbcos θ)]−1, where βbis the velocity of the emission region in c units, Γb the bulk
E [keV] 1 10 ] -1 s -2 [erg cmν F ν -11 10 -10 10 RXTE 945.04 RXTE 946.02 RXTE 948.05 RXTE 949.03 RXTE 950.08 XRT 945.04 XRT 946.04 XRT 948.05 XRT 949.00 XRT 950.06 E [TeV] 1 ] -1 s -2 dN/dE [erg cm 2 E -12 10 -11 10 -10 10 -9 10 H.E.S.S. 944.87 H.E.S.S. 945.87 H.E.S.S. 948.02 H.E.S.S. 949.00 H.E.S.S. 949.99 quiescent
Figure 3.3: Left panel: spectra obtained with SWIFT XRT and RXTE during nights of the 2006 MWL campaign. Only nights where spectra for both instruments could be ex-tracted are included. The spectra have been corrected for Galactic absorption. Right panel: nightly averaged H.E.S.S. spectra for the same selection of nights. Upper limits at 99% confidence level are indicated as arrows. No correction for absorption on the extra-galactic background has been applied. The quiescent flux is taken from H.E.S.S. Collaboration
et al. (2010). The legends in both panels provide the start times of the observations in
MJD - 53000. FromH.E.S.S. Collaboration et al.(2012)
When evaluating the correlation between RXTE and H.E.S.S. over the whole cam-paign (using a 10 to 90 minute binning, see Fig.3.4), a correlation coefficient1 of 0.75 was found, corresponding to a chance probability of less than 0.001%. The comparison of H.E.S.S. and XRT data yields a correlation coefficient of 0.72 with a chance proba-bility of less than 0.03%. When ignoring all data points from the night of the second flare, the remaining data still yield correlation coefficients of 0.61 (RXTE) and 0.54 (XRT) with chance probabilities of less than 0.5% and less than 5%, respectively.
]
-1
s
-2
log F ( 2-10 keV ) [erg cm
-10.5 -10.4 -10.3 -10.2 -10.1 -10
]
-1
s
-2
log F (>300 GeV) [erg cm
-10.8 -10.6 -10.4 -10.2 -10 -9.8 -9.6 -9.4 945 946 947 948 949 950 951 ] -1 s -2
log F ( 0.3-4 keV ) [erg cm
-10 -9.9 -9.8 -9.7 -9.6 -9.5 -9.4 945 946 947 948 949 950 952 953
Figure 3.4: Correlation between the integrated VHE flux and the integrated RXTE (left) and SWIFT XRT fluxes (right). The labels indicate the dates of observations (MJD - 53000). The points represent averages over simultaneous time intervals of usually 10 minutes. The two lines in each panel show power law fits to subsets of the data: the dashed lines include all “high flux” data, while the fits marked with solid lines include all “high flux” data except for the data from the night of the second flare (MJD 53946). From
H.E.S.S. Collaboration et al.(2012).
Power law fits indicate that the observed correlation between VHE and X-ray fluxes varies over the period of the MWL campaign. At high flux levels, the VHE flux varies as a high power of the X-ray flux variation. The correlation becomes less steep with decreasing flux and there is no clear correlation for the nights with the lowest flux levels. This indicates a different behaviour of the emission depending on the flux level. It is also coherent with a recent joint H.E.S.S./Fermi/RXTE/ATOM campaign in 2008
(Aharonian et al.,2009d), where the source was found in a relatively low state and no
correlation between the X-ray and VHE band was detected. Taken together with the behaviour described here, this might indicate that a correlation between these bands occurs only if the source is in a high state. It should be noted that evidence of a
difference in the behaviour of the emission spectrum of this source between low- and high-flux states was also found byH.E.S.S. Collaboration et al. (2010) concerning the evolution of the VHE spectral index with the VHE flux level.
A correlation between the X-ray and VHE fluxes is naturally accounted for in the SSC framework and has been detected for example during high-flux states of Mkn 421 (B la˙zejowski et al.,2005;Fossati et al.,2004;Krawczynski et al.,2001;Tanihata et al.,
2004) and Mkn 501 (Albert et al., 2007; Catanese et al., 1997; Djannati-Atai et al.,
1999;Pian et al.,1998). An extension to more than one emission zone has been proposed
to account for the observed steep correlation between the X-ray and VHE γ-ray flux during the second flare (Aharonian et al.,2009c). An application of a multi-zone SSC model to the second flare will be demonstrated in Chapter 5.
Such a scenario could be applicable more generally to explain the changing be-haviour of the source between high- and low-flux states. The synchrotron emission would be generally dominated by a not very dense emission region that does not con-tribute significantly to the SSC component. An additional emission region with a denser and more energetic electron population would dominate the VHE emission while con-tributing little to the X-ray emission. This second zone would account for the steep correlation and spectral hardening during high states and flares. In a low state of the source, the small contribution from the second zone to the X-ray emission might become undetectable against the dominant emission from the first zone. This would naturally explain the uncorrelated behaviour or less steep correlations at lower flux states and the emergence of correlations during higher flux states.
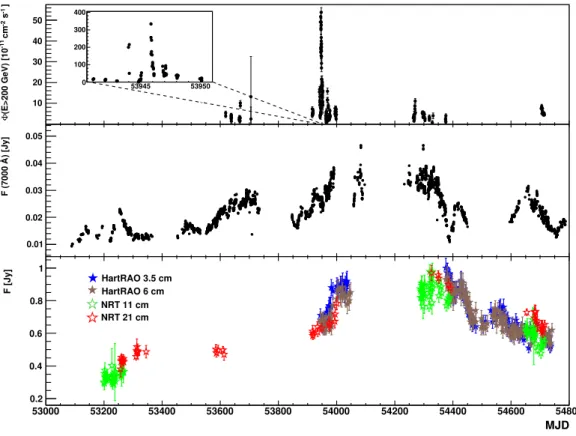
It is also instructive to put the 2006 MWL campaign into the context of the long-term behaviour of the source flux. Long-long-term light curves covering several years are available for this blazar in the optical band, with the ROTSE telescope situated on the site of the H.E.S.S. experiment in Namibia, and in several radio bands, where data were taken with the South African HartRAO and the French Nan¸cay radio telescope (NRT). As can be seen in the ROTSE long-term light curve (Fig. 3.5, middle panel), the optical flux from the source was at a relatively high level during the 2006 MWL campaign, compared to the low state observed with ROTSE in 2003 (Aharonian et al.,
2005a).
On intra-night time scales, no exceptional variations are observed in the optical flux during the active VHE state of the source. In the ROTSE data, as well as in
53000 53200 53400 53600 53800 54000 54200 54400 54600 54800 ] -1 s -2 cm -11 (E>200 GeV) [10 Φ 0 10 20 30 40 50 53000 53200 53400 53600 53800 54000 54200 54400 54600 54800 ] -1 s -2 cm -11 (E>200 GeV) [10 Φ 0 10 20 30 40 50 53000 53200 53400 53600 53800 54000 54200 54400 54600 54800 ) [Jy] Å F (7000 0.01 0.02 0.03 0.04 0.05 MJD 53000 53200 53400 53600 53800 54000 54200 54400 54600 54800 F [Jy] 0.2 0.4 0.6 0.8 1 HartRAO 3.5 cm HartRAO 6 cm NRT 11 cm NRT 21 cm 53000 53200 53400 53600 53800 54000 54200 54400 54600 54800 ] -1 s -2 cm -11 (E>200 GeV) [10 Φ 0 10 20 30 40 50 53945 53950 0 100 200 300 400
Figure 3.5: Long-term light curves from VHE γ-ray measurements (upper panel:
H.E.S.S.), optical data (middle panel: ROTSE) and radio data (lower panel: NRT and HartRAO). Please note that the y-axis is truncated for the long-term H.E.S.S. light curve due to the large dynamic range caused by the flares. A zoom on the period covering the two VHE flares is shown in an inset in the upper panel. FromH.E.S.S. Collaboration et al.
(2012).
additional data from the Bronberg and Watcher telescopes (not shown here), intra-night variations of ≈0.1 mag can be seen for several intra-nights during the MWL campaign and also during the following months. The amplitude of the observed variability is similar to observations during the 2003 low state. The ubiquitous variations in the optical band lead to random instants of correlations and anti-correlations with the VHE band. When taking into account the overall behaviour of the optical flux for all the nights where detailed optical light curves were available, there is no compelling evidence of a direct correlation of the optical band with the VHE band. However, on a time scale of several weeks, the average optical flux was on the rise when the VHE flares occurred. The ROTSE data show a fluctuation of ≈1.2 mag between the lowest
and highest fluxes in 2006. The long-term rise seen in the optical band is not reflected in the VHE γ-ray data, but suggests a relation between high optical states and flaring VHE activity.
The long-term light curve in the radio band is shown in the third panel of Fig. 3.5. The evolution of the available radio data shows that the source was already in an active state in the radio band during the H.E.S.S. campaign and exhibited a significant increase in the flux level about one and a half months after the VHE flares occurred. The average flux measured by the NRT during the campaign (0.49±0.04 Jy at 11 cm) is significantly higher than the flux measured during the 2003 campaign (0.30±0.01 Jy at 11 cm). The rise in the radio flux in the months around MJD 54000 (September 2006) by roughly 50%, observed with both the NRT and HartRAO telescopes, coincides with a comparable increase in the optical flux during that time period. It can also be seen that both the radio and optical fluxes were at a lower level around MJD 53200 (July 2004) and decline again around MJD 54400 (October 2007), even though in this case the relative change in the amplitude is not the same. Both bands exhibit a relatively high flux level that increases still during or shortly after the VHE high state. Although the optical and radio flux evolution shows some differences, especially around MJD 53300 and MJD 54400, which might indicate a delay between the two bands that is difficult to quantify due to the sparse data coverage, an overall correlation is clearly present. Over the whole period presented here, a correlation coefficient of 0.29 for 128 points is derived, corresponding to a chance probability of 0.1%.
The radio data might indicate a similar situation to the one seen in 2008 in the radio-galaxy M 87 (Acciari et al.,2009). In both cases, a rapid variation at the highest energies occurred during or shortly before an increase in the radio flux over several months. From the available data it seems that the radio flux from PKS 2155-304 was at a relatively high, but stable level when the VHE flares occurred, and started to increase about one month afterwards. Part of the radio and optical emission could come from the same lepton population that causes the VHE γ-ray and X-ray flares. The high-energy emission region, e.g. a rapidly moving plasma blob inside the jet, could be initially opaque to radio waves due to synchrotron self-absorption, as has been observed in Mkn 421 (Charlot et al.,2006). The expansion of the blob while it is travelling down the jet permits the emission of radio waves with a certain delay. The longer cooling times at lower energies lead to a longer time scale for radio and optical
emission compared to the very rapid high-energy flares. Moreover, the variability is diluted in the radio light curve by emission from the inner and large-scale jets, as well as from the extended radio lobes. Diffusion of energetic particles from the blob into an external component could lead to a delayed response to the VHE flares in the low-energy bands.
For the observations of the VHE flare from M87 in 2008 no simultaneous optical data have been published, thus it is not known if the optical flux showed a behaviour similar to the radio flux. However, in the case of PKS 2155-304, the Watcher and ROTSE data show the average optical flux to be in a high state and on a long-term increase when the VHE flares occurred. Variations on the scale of a few nights and on intra-night scales are superimposed on this increase. Similar to the radio flux, the optical flux could represent a smoothed response to previous high-energy activity.
3.2.2 PKS 0447-439: a redshift limit from GeV and TeV data
This section contains excerpts fromH.E.S.S. Collaboration et al.(2013) andZech et al.
(2011), which I wrote with the help of Bagmeet Behera and with input from the H.E.S.S. Consortium, as well as from Didier Pelat.
A general difficulty in the study of BL Lac objects is the fact that their redshifts are often unknown or not well determined, since spectral features from the host galaxy become undetectable due to the dominance of the non-thermal emission from the jet. Therefore, about 50% of the BL Lac objects detected with Fermi-LAT (Ackermann
et al., 2011) have an unknown redshift, and this is also the case for the bright HBL
PKS 0447-439, which was detected as a TeV source with H.E.S.S. in 2009, following predictions based on the LAT spectrum.
A first evaluation of the redshift of this source at z= 0.107 (Craig & Fruscione,1997) was based on a mis-identification with a Seyfert 1 galaxy1. Subsequent observations with the CTIO 4m telescope led to an estimation of z=0.205 (Perlman et al., 1998). However, this claim was based only on a very weak spectral feature that the authors identified as the Ca II line in an otherwise featureless spectrum. It was not confirmed by a more recent analysis by Landt & Bignall (2008) that yielded only a lower limit of z>0.176, based on the photometric method described byPiranomonte et al.(2007),
applied to a featureless spectrum from observations with the CTIO and NTT telescopes. A more recent analysis of observations of the source, which were carried out with the CTIO and NTT in 2007, put a very high lower limit of z ≥ 1.246 on its redshift (Landt,
2012). This result was based on weak absorption lines interpreted as the Mg II λ2800 doublet. Such a high redshift is very difficult to reconcile with the detection of γ-rays from the source with energies of several TeV, given the absorption by the EBL. A more likely explanation is that the feature in the optical spectra corresponds to atmospheric absorption. The most recent data (Pita et al.,2014), taken with the X-Shooter telescope (ESO/VLT), do not confirm the high redshift value suggested byLandt(2012), but show instead a featureless spectrum apart from atmospheric absorption lines, at wavelengths that coincide exactly with the putative Mg II doublet. This has also been confirmed subsequently by observations with the Clay Magellan II telescope (Fumagalli et al.,
2012).
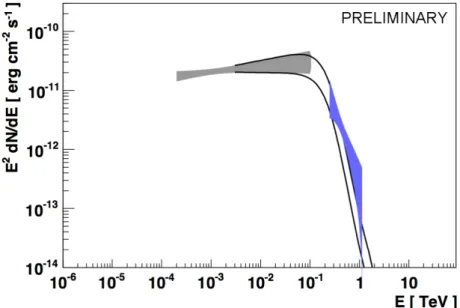
The combined Fermi-LAT and H.E.S.S. data set can be used to derive an upper limit on the redshift of this source. In a preliminary study (see Fig. 3.6), the LAT spectrum was extrapolated, absorbed with a given EBL model (Franceschini et al.,
2008) for different redshifts and compared to the observed H.E.S.S. spectrum. The upper limit corresponded to the redshift where the extrapolated LAT spectrum was no longer compatible with the H.E.S.S. spectrum.
No assumptions are made on the source emission characteristics, other than ex-cluding spectral upturns beyond the Fermi-LAT energy band, which are not expected in general and would be theoretically difficult to account for. One case of a spectral upturn at high energies might have been seen during a flare of Mkn 501 (Neronov et al.,
2012). Lefa et al. (2011) interpret this hypothetical feature as resulting from the
com-bination of several emission regions in a leptonic scenario with Maxwell-like particle distributions. The observational evidence, however, is weak. For PKS 0447-439, there is no indication of an upturn in the Fermi-LAT data and the data were not taken during a flare. Spectral upturns might also occur in a scenario where the γ-ray flux in the Fermi-LAT band suffers from internal absorption in the source, e.g. on emission from the BLR (Poutanen & Stern, 2010; Senturk et al., 2011) or from the accretion disk or torus (e.g. Donea & Protheroe,2003), and recovers in the VHE band (see also
Zacharopoulou et al.,2011). However, the absence of line features in the optical spectra
these sources. In the case of PKS 0447-439, the available optical spectra do not show any significant features. The γ-ray data from this source are best described by power laws, with no indication for absorption on internal photon fields.
Figure 3.6: Spectra derived from data from Fermi-LAT (grey bowtie) and H.E.S.S. (blue bowtie). The black lines show an extrapolation of the Fermi-LAT spectrum, absorbed by the EBL assuming z=0.53, in comparison with the measured (uncorrected) H.E.S.S. spectrum (blue bowtie). The Fermi LAT and H.E.S.S. bowties indicate the 2 confidence band, assuming Gaussian errors. FromZech et al.(2011).
In a more rigorous treatment, the Fermi-LAT power-law spectrum, based on data taken over the same time period as the H.E.S.S. data and with no indication of variabil-ity, is extrapolated to the highest energies to serve as an upper limit on the intrinsic flux from the source in the VHE band. Following the method proposed byGeorganopoulos
et al. (2010), the ratio between the VHE flux and the extrapolated Fermi-LAT flux
provides an upper limit on the optical depth, as a function of energy, due to EBL attenuation. A comparison of this upper limit with the predictions of a given EBL model as a function of redshift can be translated into an upper limit on the redshift of the source. This method has been used to constrain the density of the EBL with data from Fermi-LAT and MAGIC from the FSRQ 4C 21.35 (Aleksi´c et al.,2011). A similar approach was applied to Fermi-LAT and VHE data from the BL Lac object PG 1553+113 to derive an upper limit on its unknown redshift (Abdo et al.,2010b).