www.atmos-meas-tech.net/8/1733/2015/ doi:10.5194/amt-8-1733-2015
© Author(s) 2015. CC Attribution 3.0 License.
Retrievals of formaldehyde from ground-based FTIR and
MAX-DOAS observations at the Jungfraujoch station and
comparisons with GEOS-Chem and IMAGES model simulations
B. Franco1, F. Hendrick2, M. Van Roozendael2, J.-F. Müller2, T. Stavrakou2, E. A. Marais3, B. Bovy1, W. Bader1, C. Fayt2, C. Hermans2, B. Lejeune1, G. Pinardi2, C. Servais1, and E. Mahieu11Institute of Astrophysics and Geophysics of the University of Liège, Liège, Belgium 2Belgian Institute for Space Aeronomy (BIRA-IASB), Brussels, Belgium
3School of Engineering and Applied Sciences, Harvard University, Cambridge, MA, USA
Correspondence to: B. Franco (bruno.franco@ulg.ac.be)
Received: 5 September 2014 – Published in Atmos. Meas. Tech. Discuss.: 23 October 2014 Revised: 25 March 2015 – Accepted: 27 March 2015 – Published: 15 April 2015
Abstract. As an ubiquitous product of the oxidation of many volatile organic compounds (VOCs), formaldehyde (HCHO) plays a key role as a short-lived and reactive intermedi-ate in the atmospheric photo-oxidation pathways leading to the formation of tropospheric ozone and secondary organic aerosols. In this study, HCHO profiles have been success-fully retrieved from ground-based Fourier transform infrared (FTIR) solar spectra and UV-visible Multi-AXis Differen-tial Optical Absorption Spectroscopy (MAX-DOAS) scans recorded during the July 2010–December 2012 time pe-riod at the Jungfraujoch station (Swiss Alps, 46.5◦N, 8.0◦E, 3580 m a.s.l.). Analysis of the retrieved products has revealed different vertical sensitivity between both remote sensing techniques. Furthermore, HCHO amounts simulated by two state-of-the-art chemical transport models (CTMs), GEOS-Chem and IMAGES v2, have been compared to FTIR to-tal columns and MAX-DOAS 3.6–8 km partial columns, accounting for the respective vertical resolution of each ground-based instrument. Using the CTM outputs as the in-termediate, FTIR and MAX-DOAS retrievals have shown consistent seasonal modulations of HCHO throughout the in-vestigated period, characterized by summertime maximum and wintertime minimum. Such comparisons have also high-lighted that FTIR and MAX-DOAS provide complementary products for the HCHO retrieval above the Jungfraujoch sta-tion. Finally, tests have revealed that the updated IR parame-ters from the HITRAN 2012 database have a cumulative
ef-fect and significantly decrease the retrieved HCHO columns with respect to the use of the HITRAN 2008 compilation.
1 Introduction
Formaldehyde (HCHO) is the most abundant organic car-bonyl compound in the remote troposphere (Hak et al., 2005, and references therein). Being predominantly a high-yield product of oxidation by hydroxyl radicals (OH) of most of the primary volatile organic compounds (VOCs) emit-ted either naturally or by human activities, HCHO is ubiq-uitous throughout the atmosphere. It is also directly emit-ted in a small fraction from biogenic (e.g., vegetation), py-rogenic (mainly biomass burning) and anthropogenic (e.g., industrial emissions) sources (e.g., Carlier et al., 1986; Lee et al., 1997; Hak et al., 2005; Herndon et al., 2005; Fu et al., 2007; De Smedt et al., 2010). Long-lived VOCs such as methane (CH4) contribute to the background levels of HCHO. However, the spatial variability of HCHO concen-tration is primarily associated with the oxidation of reac-tive non-methane VOCs of biogenic (e.g., isoprene) or an-thropogenic (e.g., butane) origin. At low nitric oxide (NO) concentrations, intermediate compounds such as methyl hy-droperoxide (CH3OOH) are formed which are partly re-moved by deposition, thereby reducing HCHO formation.
Formaldehyde has a very short midday lifetime on the or-der of a few hours (Logan et al., 1981; Possanzini et al.,
2002). Its main removal pathways take place by photolysis and oxidation by OH radicals, with both loss processes yield-ing carbon monoxide (CO) and hydroperoxyl radicals (HO2), so that HCHO affects the global CO budget and the oxida-tive capacity of the atmosphere. Losses of HCHO by dry and wet deposition near the surface are generally less significant (Atkinson, 2000). Moreover, HCHO is an important inter-mediate in the VOC–HOx(hydrogen oxides)–NOx(nitrogen
oxides) chemistry (Houweling et al., 1998; Hak et al., 2005; Kanakidou et al., 2005), making it a key component in the global catalytic cycle responsible for generating or destroy-ing tropospheric ozone (O3), depending on the NOx levels
(Fried et al., 1997; Lee et al., 1998; Tan et al., 2001). Recently, total FTIR (Fourier transform infrared) and par-tial UV-visible MAX-DOAS (Multi-AXis Differenpar-tial Op-tical Absorption Spectroscopy) columns of HCHO derived from ground-based remote sensing measurements have been used to evaluate HCHO observations obtained from SCIA-MACHY (SCanning Imaging Absorption spectroMeter for Atmospheric CHartographY), GOME (Global Ozone Mon-itoring Experiment) and ACE-FTS (Atmospheric Chem-istry Experiment Fourier transform spectrometer) space-based sensors (e.g., Wittrock et al., 2006; Jones et al., 2009; Vigouroux et al., 2009; Viatte et al., 2014). Such studies re-ported an overall consistency between satellite HCHO obser-vations and ground-based FTIR and MAX-DOAS measure-ments at a number of sites influenced by biomass burning (Wittrock et al., 2006; Jones et al., 2009; Vigouroux et al., 2009) or urban sources of pollution (Wittrock et al., 2006). In addition, Vigouroux et al. (2009) successfully compared FTIR and MAX-DOAS observations, HCHO columns from SCIAMACHY nadir satellite and simulations by the global CTM (chemistry transport model) IMAGES v2 (Intermedi-ate Model of Annual and Global Evolution of Species) at Reunion Island (20.9◦S, 55.5◦E).
In this study, we report parallel HCHO measurements per-formed at the high-altitude research station of Jungfraujoch (Swiss Alps), part of the NDACC (Network for the Detection of Atmospheric Climate Change; see http://www.ndacc.org), using both ground-based high-resolution FTIR and MAX-DOAS instruments. This work presents the first intercompar-ison of ground-based FTIR and MAX-DOAS HCHO obser-vations carried out at a high-altitude, dry and weakly polluted site (Zander et al., 2008). The Jungfraujoch station contrasts with, e.g., the sea-level Reunion Island site where HCHO total columns are influenced by large precursor emissions originating from biogenic and pyrogenic sources in south-ern Africa and Madagascar (Vigouroux et al., 2009). The combination of elevation, weakly polluted conditions and the strong vertical gradient of HCHO concentration in the lower troposphere contributes to reducing the solar infrared absorp-tion of HCHO at the Jungfraujoch staabsorp-tion and makes it very challenging to retrieve.
FTIR and MAX-DOAS measurements are not directly comparable given their respective vertical resolution and
sen-sitivity, but with this work we show that both techniques are essentially complementary for HCHO retrieval above Jungfraujoch. Therefore we use two state-of-the art three-dimensional global CTMs, GEOS-Chem (v9-01-03; Bey et al., 2001) and IMAGES v2 (Stavrakou et al., 2013), for intercomparing FTIR total columns and MAX-DOAS partial columns of HCHO over the entire July 2010–December 2012 time period. The HCHO columns and concentrations simu-lated by the CTMs are compared successively to the ground-based data sets, taking into account the vertical sensitivity of each remote sensing instrument by applying their respective averaging kernels.
This work also aims at implementing and validating an op-timized FTIR retrieval strategy for HCHO above Jungfrau-joch as a preparation for further studies. Indeed, it is worth mentioning that FTIR solar spectra exploitable for the re-trieval of HCHO are actually available at the Jungfraujoch station since the beginning of 1988. Using the FTIR retrieval strategy implemented and validated in the present study, all these solar spectra spanning the 1988–2014 time period are currently being processed in an ongoing work in order to produce long-term record of HCHO and investigate its in-terannual variability above Jungfraujoch. Finally, ground-based HCHO measurements are increasingly required to val-idate satellite observations such as SCIAMACHY, GOME, ACE-FTS and TROPOMI (TROPOspheric Monitoring In-strument).
The measurement site, instrumental setups, investigated data sets and ground-based retrieval strategies for the Jungfraujoch station are described in Sect. 2. A short descrip-tion of the GEOS-Chem and IMAGES models as well as of the simulations performed in the framework of this study is also given in Sect. 2. Section 3 presents the characterization of the FTIR and MAX-DOAS geophysical products, includ-ing a detailed error budget for each ground-based data set. Section 4 reports the results of the HCHO retrievals above Jungfraujoch as well as the comparisons between FTIR and MAX-DOAS columns and model simulations. Concluding remarks and perspectives are included in Sect. 5.
2 Instrumental setup and data sets 2.1 Measurement site
The high-alpine international scientific station of Jungfrau-joch (referred to below as ISSJ, 46.5◦N, 8.0◦E, 3580 m a.s.l.;
Zander et al., 2008), is located on a mountain saddle be-tween the two summits Jungfrau (4158 m a.s.l.) and Mönch (4099 m a.s.l.) on the northern edge of the Swiss Alps. Due to its particular topographical position representing a strong barrier for synoptic-scale air flow, the ISSJ is mainly influ-enced by northwesterly winds, advecting air masses to the ISSJ from the Swiss plateau, and southeasterly flows from the inner Alpine region and the south of the Alps (e.g., the Po Valley, Italy). Because of its altitude, the ISSJ is
essen-tially located in the free troposphere in winter (from Novem-ber to January) and is influenced by advective weather types (Collaud Coen et al., 2011). During the rest of the year, fre-quent injections of air masses from the planetary boundary layer (PBL) occur, especially in summer where convective weather types have a greater occurrence (Collaud Coen et al., 2011). Therefore the ISSJ often allows investigation of the atmospheric background conditions over central Europe as well as studying the mixing of PBL and free tropospheric air masses (e.g., Zellweger et al., 2003; Reimann et al., 2004).
As glaciers and barren rocks cover the main area in the closest vicinity of the ISSJ, contamination due to local HCHO precursor emissions is generally negligible. However, analyses of backward trajectories for background conditions indicated that the air masses at Jungfraujoch have a large contribution of biogenic and anthropogenic emissions from western central Europe, i.e., northern Italy, southern France and southern and eastern Germany (Legreid et al., 2008). They also revealed that the influence of long-range intercon-tinental transport is discernible, clearly separated from the influence of the European PBL (Henne et al., 2005; Balzani Lööv et al., 2008). Influences from large biogenic and an-thropogenic emission sources generally originate from the nearby valleys, such as the Rhône Valley to the south of Jungfraujoch or the Po Valley in northern Italy, and from cities at the foothill of the Alps. These pollutant emissions might be transported to Jungfraujoch by air advection in the upper PBL, thermally driven convection, front passage and efficient tropospheric venting of PBL air masses from deep Alpine valleys, especially during summertime (Lugauer et al., 2000; Henne et al., 2004, 2005; Li et al., 2005). The constituents lifted to the ISSJ are then transported horizon-tally by the synoptic flow over the Alpine region.
2.2 FTIR observations and retrieval strategy
The FTIR data set investigated in this work has been de-rived from solar spectra recorded under clear-sky conditions at ISSJ with a high spectral resolution commercial Bruker IFS 120 HR spectrometer equipped with indium antimonide and mercury cadmium telluride cooled detectors (we refer to Zander et al., 2008, for further details). It consists of a sub-set of 1500 spectra (representing 326 days of observations) recorded during the July 2010–December 2012 period with an optical filter covering the 2400–3310 cm−1 spectral do-main and maximizing the signal-to-noise (S/N ) ratio. This data set has been limited such as to coincide with the obser-vational time of the MAX-DOAS instrument (see following Sect. 2.3). It is characterized by a typical spectral resolution (defined here as the inverse of twice the maximum optical path difference) alternating between 0.003 and 0.005 cm−1 and by S/N ratios ranging from about 550 to 3100, the high-est values being reached for averages of consecutive individ-ual spectra.
All FTIR solar observations have been fitted with the SFIT-2 v3.91 algorithm (Rinsland et al., 1998) based on the optimal estimation formalism of Rodgers (2000). This code performs the derivation of vertical mixing ratio profiles and corresponding column abundances of most of the FTIR tar-get gases and allows the characterization of the vertical infor-mation content of the measurement. The model atmosphere above the ISSJ is discretized in a 39-layer scheme of pro-gressively increasing thicknesses (until 100 km altitude), us-ing physical pressure and temperature information derived on a daily basis from midday pressure–temperature profiles pro-vided by the National Centers for Environmental Prediction (NCEP, http://www.ncep.noaa.gov). Spectroscopic line pa-rameters from the HITRAN 2008 official release (Rothman et al., 2009) are assumed in the spectral fitting process, in-cluding the additional line strength updates for HCHO from Perrin et al. (2009).
The a priori vertical concentration profile for HCHO, as well as for all interfering species in the retrieval process, originates from averaged volume mixing ratio (VMR) pro-files derived from WACCM v6 (Whole Atmosphere Com-munity Climate Model; see e.g., Chang et al., 2008) simu-lations above ISSJ over the 1980–2020 period. This a pri-ori VMR profile for HCHO (see Fig. S1 in the Supplement) presents a good consistency with the zonal average of indi-vidual HCHO profiles derived from nearly 2000 occultation observations performed between 36.5 and 56.5◦N and over the 2004–2012 period by the ACE-FTS instrument version 3.5 (Bernath et al., 2005; Dufour et al., 2009a) within the entire altitude range accessible by ACE-FTS (i.e., from ap-proximately 6 to 40 km for HCHO). The concentration of the simulated HCHO profiles shows a strong gradient in the tro-posphere, with maximum values of approximately 0.3 ppbv at the ISSJ altitude (3580 m), rapidly decreasing to a min-imum of 10 pptv in the upper troposphere and the lower stratosphere. These values are in good agreement with in situ observations (e.g., Harder et al., 1997) and airborne measure-ments (e.g., Fried et al., 2003, 2008; Stickler et al., 2006) carried out in the background continental boundary layer at mid-latitudes in the Northern Hemisphere.
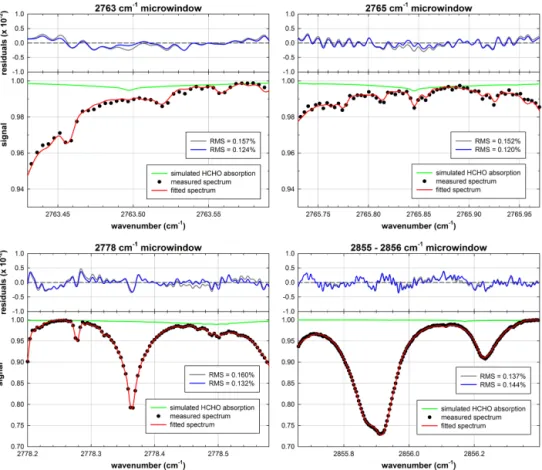
Solar absorption by HCHO in the infrared domain results in very broad spectral features of very weak intensities, es-pecially at ISSJ (generally less than 1 % of the total signal under normal background conditions) because of the sta-tion elevasta-tion and dominant non-polluted air masses. The FTIR retrieval strategy implemented in this study is based on the method developed by Vigouroux et al. (2009) for the HCHO retrieval at Reunion Island, who used six microwin-dows encompassing the 2760–2860 cm−1 spectral domain. The selection of these fitting spectral intervals is discussed in Vigouroux et al. (2009). In the present work, we use four of these microwindows (see Table 1), discarding two due to the presence of systematic residuals or of very strong inter-ferences blinding the weak HCHO absorption. A typical ex-ample of FTIR fit for HCHO at Jungfraujoch is presented in
Table 1. List of the microwindows used for the FTIR retrieval of HCHO and the interfering species. The 2765 and 2855 cm−1 mi-crowindows are used in a first run to pre-fit HCHO, HDO and O3 by simple scaling. The scaled profiles of these three compounds are then used as a priori profiles in the retrievals of HCHO.
Microwindows (cm−1) Interfering species 2763.425–2763.600 HDO, CH4, O3, N2O, CO2 2765.725–2765.975 HDO, CH4, O3, N2O, CO2 2778.200–2778.590 HDO, CH4, O3, N2O, CO2 2855.650–2856.400 HDO, CH4, O3, N2O, H2O
Fig. 1, as well as the simulated HCHO absorption in these four microwindows. The same example of FTIR fit, but us-ing the same six microwindows as Vigouroux et al. (2009), is illustrated in Fig. S2 in the Supplement. The interfering species are CH4producing the background absorption in ev-ery interval, multiple lines of O3 and individual features of N2O, CO2, HDO and H2O. The 2763 and 2765 cm−1 mi-crowindows are mainly characterized by relatively weak in-terfering absorptions, the larger HCHO absorption occurring in the 2778 cm−1 microwindow. The last interval presents small absorptions of HCHO at approximately 2856.2 cm−1 but encompasses two large features of HDO and solar ab-sorption very helpful in reducing the correlation between HCHO signals and both HDO and solar absorptions in the other microwindows.
Instead of a Tikhonov type L1 regularization as used by Vigouroux et al. (2009) for the HCHO retrieval process, we have opted for an optimal estimation method (OEM; Rodgers, 2000) accounting for the geophysical conditions of the target species. As the covariance matrix should rep-resent the natural variability of HCHO for each atmospheric layer, we have determined the value of each diagonal element (i.e., a percentage of the a priori profile) by investigating the variability profile of HCHO on the basis of the solar occul-tation observations from ACE-FTS v3.5 and simulations of the WACCM model. The averaged relative standard devia-tions (RSD) of HCHO VMR from ACE-FTS and WACCM present very consistent vertical shapes above ISSJ, indicating a maximum of variability at 10 km altitude. However, the en-tire WACCM profile has to be multiplied by a constant factor of approximately 2.5 to approach the values derived from the ACE-FTS observations. Such a difference between the RSD ensembles can be explained by the fact that the model prob-ably underestimates the atmospheric natural variability of HCHO and that the measurement noise inherent to the ACE-FTS observations presumably induces excessive RSD values. However, adoption of a variability profile derived from ACE-FTS RSD values was found to lead to strong oscillations in the retrieved tropospheric profiles. Such oscillations are re-sponsible for unphysical negative VMR values of HCHO. Consequently, the diagonal elements of the covariance
ma-trix have been adjusted to obtain a compromise between sta-bility and information content. Through several tests we have determined an adequate factor of 1.5 to multiply the RSD profile from WACCM and have adopted these values as diag-onal elements of the covariance matrix. The HCHO variabil-ity (see Fig. S1) at the ISSJ altitude amounts to 65 %, slightly decreases to 55 % at 6 km altitude and reaches its maximum (approximately 100 %) at 10–11 km before rapidly decreas-ing with the elevation. Given the strong gradient of HCHO concentration in the troposphere, we have used a Gaussian inter-layer correlation with a half-width length of 3 km for the off-diagonal elements of the covariance matrix. Finally, a
S/Nratio of 600 for inversion is set in all fitting sequences, consistent with the noise level of most of the analyzed solar spectra.
In the present study, the fitting process of an individual FTIR solar spectrum to retrieve HCHO at ISSJ consists of two successive steps. In the first one, which is a pre-fitting step, the a priori VMR profiles of HCHO, HDO and O3 pro-vided by the WACCM model are independently scaled in the 2765.725–2765.975 and 2855.650–2856.400 cm−1 mi-crowindows only (without taking into account the other in-terfering compounds in these microwindows), using a single parameter for each scaled species. These spectrum-specific scaled profiles are then used as a priori for HCHO, HDO and O3in the HCHO retrieval process by the OEM (i.e., the second step) involving the four microwindows and all the in-terfering species listed in Table 1. During this second step, the vertical distribution of each interfering species is inde-pendently varied over their entire altitude spans. The pre-fit (i.e., scaling) of the HCHO a priori in the first step helps to avoid strong oscillations during the retrieval process by the OEM in the second step and the related unphysical profiles that may be produced.
2.3 MAX-DOAS observations and retrieval strategy The ground-based passive MAX-DOAS technique has al-ready been applied to the HCHO detection (e.g., Heckel et al., 2005; Irie et al., 2011; Wagner et al., 2011; Pinardi et al., 2013), revealing a good consistency with HCHO obser-vations from SCIAMACHY nadir viewing satellite (Wittrock et al., 2006), LP (long-path) DOAS instrument (Pikelnaya et al., 2007), PTR-MS (proton transfer reaction mass spec-trometry) data (Inomata et al., 2008) and during the airborne INTEX-B (INtercontinental chemical Transport Experiment) campaign (Fried et al., 2011).
A MAX-DOAS spectrometer designed and assembled at the Belgian Institute for Space Aeronomy has been operat-ing at ISSJ since July 2010. A detailed explanation of the in-strument is provided in Clémer et al. (2010), Hendrick et al. (2014) and Wang et al. (2014). In brief, it is a dual-channel system composed of two grating spectrometers covering the UV (300–390 nm) and visible (400–580 nm here instead of 400–720 nm for our instrument operating in China; see the
Figure 1. Typical example of HCHO FTIR spectral fits at ISSJ: 22 August 2010, 06:40 UTC, with a SZA of 80◦. The related residuals when fitting HCHO absorption and assuming no HCHO absorption are in blue and grey curves, respectively. This solar spectrum is characterized by a S/N ratio of 1656 and produced a DOFS equal to 1.02 and HCHO total column of 1.26 × 10¹⁵molec cm−2(compared to a S/N ratio of 1627, a DOFS of 1.05 and HCHO total column of 1.56 × 10¹⁵molec cm−2averaged over the whole FTIR July 2010–December 2012 data set). The solid green line corresponds the HCHO solar absorption simulated at the ISSJ for the same date and SZA. Note that this FTIR fit corresponds to the same date as the DOAS fit example in Fig. 2. This figure can be compared to Fig. S2, representing the same HCHO FTIR spectral fits but using the six microwindows from Vigouroux et al. (2009).
three references here above) wavelength ranges and con-nected to cooled CCD detectors. The instrumental function is close to a Gaussian with a full width at half maximum of 0.4 and 0.5 nm in the UV and visible, respectively. The op-tical head is mounted on a commercial sun tracker (INTRA, Brusag) and is linked to the spectrometers through optical fibers. The instrument is pointing towards the city of Bern (northwest direction) and a full MAX-DOAS scan consists of the following elevation angles: −10, −8, −6, −4, −2, 0, 1, 3, 4, 5, 8, 10, 15, 30 and 90◦(zenith). The negative eleva-tions, i.e., when the instrument points downwards the valley, as well as azimuthal scans performed around local noon were not used in the present study.
The data set investigated here covers the July 2010– December 2012 time period. The retrieval of HCHO vertical profiles and corresponding column amounts is performed in two steps: (1) DOAS spectral fitting providing the so-called differential slant column densities (DSCDs) and (2) appli-cation of an OEM-based profiling method on the HCHO
DSCDs to retrieve vertical profiles. These two steps are de-scribed below.
2.3.1 DOAS analysis
Measured scattered-sunlight spectra are analyzed using the QDOAS spectral fitting software suite (http://uv-vis. aeronomie.be/software/QDOAS/). The principle of the DOAS technique is to separate high-frequency molecular absorption features from a broadband component account-ing for scatteraccount-ing and instrumental effects (Platt and Stutz, 2008). The DOAS spectral fitting yields DSCDs, which are expressed in molec cm−2 and correspond to the concentra-tion of a given absorber integrated along the effective light path relative to the amount of the same absorber in a mea-sured reference spectrum. In the case of MAX-DOAS, the zenith spectrum of each scan is often taken as reference in or-der to remove the stratospheric contribution in off-axis mea-surements (Hönniger et al., 2004).
Figure 2. Example of HCHO DOAS fit at ISSJ. It corresponds to 22 August 2010 (the same date as the FTIR fit example presented in Fig. 1) at 16:30 UTC and 0◦elevation.
HCHO DSCDs are retrieved in the 328.5–358.0 nm wave-length range. Compared to previously published HCHO DOAS settings (Vigouroux et al., 2009; Pinardi et al., 2013), the fitting interval is extended here towards the UV for min-imizing the HCHO/BrO correlation. The zenith spectrum of each scan is used as reference, leading to a reduction of the interference by O3and of the impact of possible instrumen-tal degradation. ISSJ, being a remote station, has low HCHO content and as a result these two settings are found to nificantly improve the DOAS fit. The following spectral sig-natures are taken into account: HCHO at 293 K (Meller and Moortgat, 2000), NO2at 298 K (Vandaele et al., 1998), O3 at 223 K and 243 K (Bogumil et al., 2003) plus additional correction terms according to Puk¸¯ıte et al. (2010), O4 (Thal-man and Volkamer, 2013), BrO at 223 K (Fleisch(Thal-mann et al., 2004) and the Ring effect (Grainger and Ring, 1962; Chance and Spurr, 1997). A fifth-order polynomial is included to fit the broadband structure (Pinardi et al., 2013) and a linear correction for the intensity off-set is used. A typical example of a DOAS fit for HCHO at ISSJ is shown in Fig. 2 (for the same date as the FTIR fit example in Fig. 1).
2.3.2 Profile retrieval
HCHO vertical profiles are retrieved by applying the OEM-based profiling tool bePRO to the HCHO DSCDs. Since be-PRO is already described in several papers (Clémer et al., 2010; Hendrick et al., 2014; Wang et al., 2014), only the main features are given here. This application uses a two-step approach for trace gas profile retrieval. First, aerosol extinc-tion profiles are retrieved for each scan from measured O4 DSCDs (Frieß et al., 2006; Clémer et al., 2010). This step is needed since aerosols significantly affect the effective light
path through the atmosphere (Wagner et al., 2004) and there-fore the optical density of trace gases. Secondly, HCHO ver-tical profiles are inverted from the measured HCHO DSCDs using the aerosol extinction profiles obtained in the first step as input for the calculation of the so-called weighting func-tions K which describe the relation between the measured DSCDs and vertical profiles. These are calculated using the LIDORT radiative transfer model (Spurr et al., 2008) as the forward model.
Other key parameters in the OEM are the a priori pro-file xa, its covariance matrix Sa and the measurement un-certainty covariance matrix Sε. For HCHO, the same a priori
vertical profile as for FTIR is used, i.e., the HCHO profile derived from WACCM model simulations over the 1980– 2020 time period above ISSJ. In the case of the a priori for aerosol retrieval, an extinction profile corresponding to rural conditions with a visibility of 70 km is selected from the LOWTRAN climatology (Shettle, 1989). Due to the ab-sence of AERONET data at ISSJ, aerosol single scattering albedo and phase function at 340 nm are estimated off-line based on a first approximation on the aerosol size distribu-tion and refractive index retrieved from AERONET data at Observatoire de Haute-Provence (44◦N, 5.5◦E, 600 m a.s.l.) station. Sε and Sa matrices for both aerosols and HCHO are constructed as in Clémer et al. (2010; see also Hendrick et al., 2014; Wang et al., 2014). For Sa, the diagonal ele-ment corresponding to the lowest layer, Sa(1, 1), is set equal to the square of a scaling factor β times the maximum par-tial aerosol optical depth or vertical column density (VCD) of the profiles. Here β = 0.6 for HCHO and 0.4 for aerosol. The other diagonal elements decrease linearly with altitude down to 0.2 × Sa(1, 1). The off-diagonal terms in Saare set using Gaussian functions with a correlation length of 0.2 km for both HCHO and aerosol retrievals. Sε is a diagonal matrix,
with variances equal to the square of the DOAS fitting error. US Standard Atmosphere pressure and temperature profiles and a surface albedo of 0.2 are used and the following alti-tude grid is selected: 10 layers of 200 m thickness between 3.6 and 6 km and one layer of 2 km between 6 and 8 km.
Each retrieval is quality-checked based on the DOFS (de-gree of freedom for signal, which corresponds to trace of the averaging kernel matrix A; see also Sect. 3.1) and the relative root mean square error (RMS) between measured and calculated DSCDs. This RMS corresponds to the stan-dard RMS expressed in molec cm−2 divided by the mean DSCD of the scan. The following criteria have been cho-sen for the selection of good scans: DOFS > 1, RMS < 30 % and no negative concentration/extinction coefficient values allowed. Since HCHO and aerosol contents are particularly low at ISSJ, their retrieval can be strongly affected by the presence of clouds. The cloud screening method developed by Gielen et al. (2014) and based on the measured color in-dex (CI) at zenith has been therefore utilized as an additional selection criterion. This empirical parameter gives informa-tion about the color of the sky: from blue during clear skies
to white/grey when clouds or aerosols are present. Based on the comparison between measured and simulated CI, the fol-lowing sky conditions can be defined for each MAX-DOAS scan: clear-sky, thin (white/light grey) clouds/polluted, thick (dark grey) clouds/heavily polluted and broken clouds. In the present study, MAX-DOAS scans corresponding to thick clouds or broken clouds are rejected since the quality of the aerosol and trace gas retrievals can be potentially strongly affected by these sky conditions.
2.4 GEOS-Chem simulations
The global GEOS-Chem CTM (version 9-01-03: http://acmg.seas.harvard.edu/geos/doc/archive/man.
v9-01-03/index.html) is driven by NASA Global Modeling Assimilation Office GEOS-5 assimilated meteorological fields. The GEOS-5 data are at a native horizontal resolution of 0.5 × 0.667◦ with 72 vertical levels at 6 h temporal frequency (3 h for surface variables and mixing depths). We use the GEOS-5 data at 2 × 2.5◦and 47 vertical levels, combining levels above ∼ 80 hPa. GEOS-Chem includes detailed O3–NOx–VOC–aerosol coupled chemistry
origi-nally described by Bey et al. (2001) and Park et al. (2004) with updates by Mao et al. (2010). The model simulates the distributions of 95 species and chemistry of 22 precursor non-methane VOCs (NMVOCs). The isoprene oxidation mechanism is described in Mao et al. (2013).
Global biogenic emissions are obtained with the Model of Emissions of Gases and Aerosols from Nature (MEGAN) v2.0 (Guenther et al., 2006) and biomass burning emissions are from the Global Fire Emission Database (GFED) v3 (van der Werf et al., 2010). Over Europe, anthropogenic emis-sions of CO, NOx, SOx and NH3 are provided by the Eu-ropean Monitoring and Evaluation Programme (EMEP; http: //www.ceip.at/) regional inventory (Simpson et al., 2010) for the year 2010. GEOS-Chem uses the RETRO emission in-ventory (Schultz et al., 2007) for base year 2000 for all an-thropogenic NMVOC emissions other than methyl ethyl ke-tone, acetaldehyde, propene and > = C4alkanes, which are provided by the EMEP inventory. These anthropogenic emis-sions are scaled to the years of interest using energy statistics (van Donkelaar et al., 2008). An offline simulation is used for anthropogenic ethane emissions (Xiao et al., 2008). An-nual average CH4 concentrations prescribed over four lati-tude bands (0–30◦; 30–90◦) are informed by CH4 measure-ments from the NOAA Global Monitoring Division flask measurements.
We use GEOS-Chem results for the common observation period (July 2010–December 2012) after 1 year of spin-up for chemical initialization. The GEOS-Chem data set used in the present work consists of HCHO VMR profiles simulated at the closest pixel to the ISSJ and saved at a 3 h time step.
2.5 IMAGES simulations
IMAGES v2 is a global CTM simulating the distributions of 132 trace compounds at a resolution of 2 × 2.5◦ and at 40 hybrid pressure–sigma levels between the Earth’s surface and the lower stratosphere (Stavrakou et al., 2009a, b, 2013). The model includes the chemistry of 22 precursor NMVOCs. The isoprene oxidation mechanism follows the LIM0 scheme (Peeters and Müller, 2010) with revised reaction rates from the updated theoretical estimation of Peeters et al. (2014). Accounting for the isomerization of isoprene peroxy radicals reduces the yields of HCHO by about 10 % in most atmo-spheric conditions (Stavrakou et al., 2014).
Meteorological fields are obtained from ERA-Interim analyses of the European Center Medium-Range Weather Forecasts (ECMWF). The parameterizations for deep con-vection and turbulent mixing in the boundary layer use the ERA-Interim updraft mass fluxes and turbulent diffusion co-efficients for heat. The model time step is taken equal to 4 h. As described in more detail in Stavrakou et al. (2009b), the effects of diurnal variations are accounted for through cor-rection factors calculated from a detailed model run with a 20 min time step. This diurnal cycle simulation accounts for diurnal variation in the photolysis rates, meteorological parameters and emissions.
The model uses anthropogenic emissions of CO, NOx,
SOx and NH3 over Europe from EMEP for the year 2010 and anthropogenic emissions of NMVOCs from the RETRO inventory for the year 2000 (Schultz et al., 2007). It is worth noting that RETRO NMVOC emissions appear to be largely overestimated compared to EMEP estimates: for example, total emissions between 40 and 60◦N and between 10◦W
and 60◦E are 25.7 Tg in RETRO and only 10.3 Tg in EMEP
for 2011. The seasonal variation of anthropogenic emissions is estimated as in Stavrakou et al. (2013). Diurnal and weekly profiles of CO, NOxand VOC anthropogenic emissions for
OECD countries are obtained from Jenkin et al. (2000). Biomass burning emissions are provided by GFED v3 (van der Werf et al., 2010). Isoprene biogenic emissions are ob-tained from the MEGAN–MOHYCAN inventory (Stavrakou et al., 2014), whereas methanol biogenic emissions are ob-tained from an inversion of emissions based on IASI (In-frared Atmospheric Sounding Interferometer) satellite data (Stavrakou et al., 2011). The calculation of inorganic species and aerosols is described in Stavrakou et al. (2013). Monthly latitude-dependent CH4 concentration profiles constructed from NOAA Global Monitoring Division measurements are used to specify both the initial conditions and the surface boundary conditions for this compound in the model.
The IMAGES data set used in the present work consists of HCHO VMR profiles simulated at the closest pixel to the station and saved at a 4 h time step.
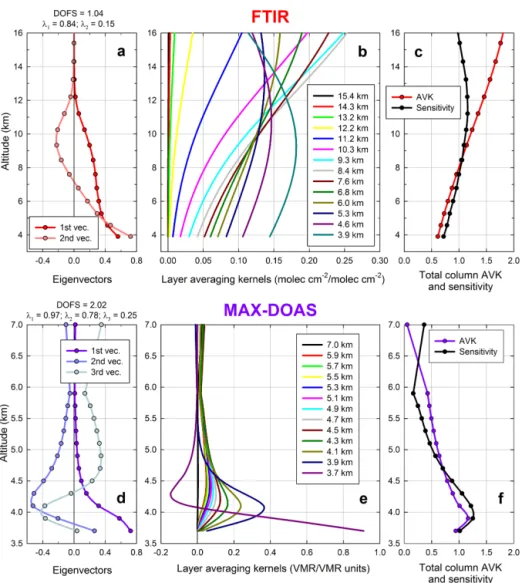
Figure 3. First eigenvectors and the associated eigenvalues (a and d), layer averaging kernels (b and e) and total column averaging kernel (AVK) and sensitivity profile (c and f) characterizing the FTIR (upper frames) and MAX-DOAS (lower frames) retrievals of HCHO above Jungfraujoch. Note that the layer averaging kernels are expressed in molec cm−2(molec cm−2)−1for FTIR and in VMR/VMR units for MAX-DOAS. These information parameters have been calculated on the basis of all the individual profiles retrieved over the July 2010– December 2012 time period.
3 Characterization of remote sensing data and error budgets
3.1 Characterization of the FTIR and MAX-DOAS retrievals
In the ill-posed inversion problem determining the retrieved vertical distribution xrof a target absorber along the vertical (z) in the atmosphere, xaand xtare the a priori and true ver-tical profiles of the target absorber, respectively, and A is the averaging kernel matrix (i.e., the product of the retrieval pro-cess) describing how the retrieved profile is related to xaand
xt according to Eq. (1) and characterizing the information content of the retrievals.
xr(z) =xa+A(xt−xa) (1)
The typical layer averaging kernels in the troposphere, cor-responding to the mean averaging kernels calculated on the basis of the 2010–2012 individual profiles and obtained from the FTIR and MAX-DOAS HCHO retrievals, are drawn in Fig. 3. They are expressed in molec cm−2(molec cm−2)−1 for FTIR (Fig. 3b) and in VMR/VMR units for MAX-DOAS (Fig. 3e). Corresponding eigenvectors and leading eigenval-ues are represented in Fig. 3a and d for FTIR and MAX-DOAS, respectively.
Regarding FTIR, the mean DOFS is 1.04 with a 1σ stan-dard deviation (SD) of 0.3 (including all measurements at different SZA). The DOFS value and the eigenvectors indi-cate that the FTIR averaging kernels are not vertically re-solved and that the retrieved profiles are sensitive only to a change in the true profile xt between the ISSJ elevation and 12 km altitude. Within this altitude range, the total
col-umn averaging kernel and the sensitivity profile (see Fig. 3c), indicating the fraction of the retrievals originating from the measurements rather than from the a priori information (xa), show values relatively close to 1.0, meaning that most of the information is coming from the measurements. The total col-umn averaging kernel and the corresponding sensitivity pro-file displayed in Fig. 3c are consistent with those shown in Viatte et al. (2014). On average over all the individual FTIR retrieved profiles, the HCHO column below 12 km altitude represents 95.4 % of the total column.
In contrast to FTIR, two independent pieces of informa-tion in the troposphere (mean DOFS = 2.02) may be ob-tained from the MAX-DOAS measurements. According to the eigenvector decomposition (Fig. 3d), the averaging ker-nels (Fig. 3e) and the column averaging kernel and sensitivity (Fig. 3f), most of the information on the vertical distribution of HCHO contained in the measurements is located below 5.5 km altitude, with a maximum sensitivity in the lowest lay-ers close to the ground. The first eigenvector is found to be mainly responsible for the strong sensitivity in the lowermost layer, with 97 % of the information content independent from the a priori profile (xa). The following eigenvectors mainly contribute to increasing the sensitivity of the retrievals at up-per levels in the troposphere. Nevertheless, the contribution of the MAX-DOAS retrievals to the information content is rapidly decreasing with the elevation (e.g., this contribution is reduced to 50 % approximately at 5 km altitude). These results show that the concentration in the lowest layer (3.6– 3.8 km) in addition to the 3.6–8 km partial column can be retrieved from the MAX-DOAS observations at ISSJ. How-ever, the discussion will be mainly focused on the 3.6–8 km partial columns in the present study.
It can be concluded that the FTIR and MAX-DOAS re-trievals have a different vertical resolution and sensitivity to the vertical distribution of HCHO, with the former being vertically unresolved and mainly sensitive in the free tropo-sphere up to the tropopause and the latter characterizing the HCHO abundance in the lower vertical layers in the vicin-ity of the ISSJ. Therefore, direct comparisons of retrieved HCHO abundances from both techniques have little mean-ing, but ground-based FTIR and MAX-DOAS observations provide complementary information on the HCHO distribu-tion in the atmosphere, more specifically in the lowermost troposphere (see Fig. S3). Nevertheless, we will use simu-lated HCHO distributions of two three-dimensional CTMs (GEOS-Chem and IMAGES) as intermediates to investigate the consistency between the retrieved HCHO columns (e.g., the seasonal cycle) above Jungfraujoch, taking into account the specific vertical resolution and sensitivity of both remote sensing techniques by applying their respective averaging kernels to smooth the CTM profiles of HCHO (Rodgers and Connor, 2003).
3.2 FTIR error budget
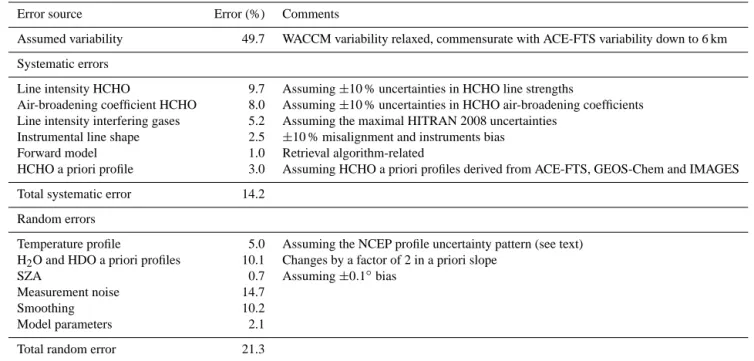
We present in Table 2 an error budget accounting for the ma-jor uncertainties that may affect the HCHO columns retrieved from individual FTIR solar spectra above the ISSJ. This error budget has been split into a systematic and a random compo-nent (14.2 and 21.3 %, respectively), with an assumed vari-ability (i.e., diagonal of covariance) close to 50 %. For both components, the total uncertainty is the square root of the sum of the squares of the estimated contributions from the different error sources listed in Table 2. While most of the error terms have been dealt with using perturbation meth-ods applied to all solar spectra recorded during the year 2011 (details are given in third column of Table 2), the contribu-tions of measurements noise (14.7 %), smoothing (10.2 %) and forward model parameters (2.1 %) to the random com-ponent have been computed following the OEM formalism of Rodgers (2000), i.e., by calculating the gain and sensitiv-ity matrices, on the basis of a representative subset of solar spectra.
The largest contribution to the total systematic error re-sults from the spectroscopic uncertainties in line intensities (9.7 %) and air-broadening coefficients (8.0 %) for HCHO. We have accounted for an error of 10 % in the HCHO spec-troscopic line strengths, commensurate with the work of Per-rin et al. (2009) who reported uncertainties between 7 and 10 % for the HCHO features used in this study. The air-broadened half-width in the HITRAN 2008 database, un-changed since the first HITRAN releases (Rothman, 1981), is derived from the early work of Tejwani and Yeung (1977) and is equivalent to the 10 % uncertainty assumed here. The same error value was used by both Jones et al. (2009) and Vigouroux et al. (2009). Other contributions to the system-atic component originate from the spectroscopy of the inter-fering species (5.2 %), calculated independently for each gas by applying the maximal uncertainties stated in the HITRAN 2008 compilation on the line intensities during the retrieval process.
In the present study, we have adopted the HITRAN 2008 database for all FTIR retrievals. We have also tested over the 2010–2012 time period the spectroscopic line parameters and air-broadening coefficients from the recent HITRAN 2012 database (Rothman et al., 2013), providing updated self- and N2-broadening coefficients of HCHO, as well as their tem-perature dependence, on the basis of the work of Jacque-mart et al. (2010). With respect to our HITRAN 2008 setup, the use of the full HITRAN 2012 compilation considerably decreases the HCHO retrieved columns by 49.0 ± 24.6 % over the 2010–2012 time period and induces the rejection of 21.2 % of all spectra due to negative VMR profiles (instead of 8.9 % initially). We have then gauged the impact of the HI-TRAN 2012 parameters for the main interfering species sep-arately, adopting still HITRAN 2008 for all other absorbers. Compared to our initial setup (full HITRAN 2008), the use of the sole HCHO parameters have a limited impact on the
Table 2. Impact of major sources of systematic and random uncertainties on typical individual HCHO total column retrievals from FTIR solar spectra above the Jungfraujoch station. These uncertainties have been calculated on the basis of all individual solar spectra recorded during the year 2011 with the exception of the measurement noise, smoothing and model parameter contributions that have been estimated according to the OEM formalism of Rodgers (2000) on the basis of a representative subset of solar spectra.
Error source Error (%) Comments
Assumed variability 49.7 WACCM variability relaxed, commensurate with ACE-FTS variability down to 6 km Systematic errors
Line intensity HCHO 9.7 Assuming ±10 % uncertainties in HCHO line strengths
Air-broadening coefficient HCHO 8.0 Assuming ±10 % uncertainties in HCHO air-broadening coefficients Line intensity interfering gases 5.2 Assuming the maximal HITRAN 2008 uncertainties
Instrumental line shape 2.5 ±10 % misalignment and instruments bias Forward model 1.0 Retrieval algorithm-related
HCHO a priori profile 3.0 Assuming HCHO a priori profiles derived from ACE-FTS, GEOS-Chem and IMAGES Total systematic error 14.2
Random errors
Temperature profile 5.0 Assuming the NCEP profile uncertainty pattern (see text) H2O and HDO a priori profiles 10.1 Changes by a factor of 2 in a priori slope
SZA 0.7 Assuming ±0.1◦bias
Measurement noise 14.7
Smoothing 10.2
Model parameters 2.1 Total random error 21.3
Table 3. Error budget on the retrieved HCHO vertical column den-sity (VCD) for the MAX-DOAS measurements. The total uncer-tainty is calculated by adding the different error terms in Gaussian quadrature.
Uncertainty on
Error sources HCHO VCD (%)
Smoothing and noise errors 9.1 Uncertainty related to aerosols 6.3 Uncertainty related to the a priori 8.8 Uncertainty related to the albedo 1.0 Uncertainty on the HCHO cross sections 9.0
Total uncertainty 16.8
retrieved columns (−9.3 ± 5.6 %), while the use of HITRAN 2012 for CH4only induces a bias of −11.2 ± 5.0 % on the HCHO amounts. Finally, when assuming HITRAN 2012 for CO2, the line positions and intensities of which have been modified compared to HITRAN 2008, the retrieved HCHO columns are affected by −26.9 ± 15.6 %. Although CO2is not the main interfering species in our microwindows, CO2 lines overlap the HCHO features in the 2765 and 2778 cm−1 microwindows and largely influence the HCHO absorption. When assumed together, the updated parameters for HCHO, CH4and CO2have a cumulative effect and significantly de-crease the retrieved HCHO columns.
For estimating the impact of a bias in the instrumental line shape, we have considered a misalignment of 10 % at the maximal path difference of the instrument, inducing a dis-crepancy of 2.5 % on the mean HCHO total column. Accord-ing to comparisons between the SFIT and PROFFIT fittAccord-ing algorithms, an algorithm-related error of maximum 1 % on the retrieved columns may arise (Hase et al., 2004). Finally, we have fitted the 2011 solar spectra by assuming succes-sively HCHO a priori profiles derived from the ACE-FTS, GEOS-Chem and IMAGES data sets used in the present work, resulting in retrieved HCHO amounts diverging by up to 3.0 %.
Among the random errors, we adopted the uncertainties provided by NCEP for the temperature (i.e., 1.5◦C up to 20 km, 2◦C up to 30 km, 5◦C near 35 km and then pro-gressively increasing up to 9◦C at 50 km), and we further assumed a 0.1◦error in the solar pointing. Although HDO is accounted for during the first run in the retrieval process, there is a relatively strong dependence of the retrieved HCHO columns on the H2O and HDO a priori profiles (10.1 %). This uncertainty has been estimated by making the slope of the tropospheric H2O and HDO VMR profiles simulated by WACCM vary by a factor of 2. This latter corresponds ap-proximately to the change of slope when taking the 2σ SD limits around the annually-averaged H2O VMR profile re-trieved above the ISSJ according to the method of Sussmann et al. (2009).
3.3 MAX-DOAS error budget
The error budget on the retrieved MAX-DOAS HCHO VCDs is estimated as in Hendrick et al. (2014) and Wang et al. (2014). The following error sources are taken into account: smoothing and measurement noise errors, uncertainties on the forward model parameters (mainly aerosol extinction, HCHO a priori profiles and albedo) and uncertainty on the HCHO cross sections. The error budget is summarized in Table 3. The combined smoothing and measurement noise errors reach 9.1 %. Regarding the uncertainty related to the aerosol profile retrieval, an error of 6.3 % is obtained on aver-age on the retrieved HCHO VCD based on a sensitivity test approach using aerosol extinction profiles plus their corre-sponding error (i.e., the sum of smoothing and noise errors plus a 20 % error due to the uncertainty in the O4cross sec-tions; see Wagner et al., 2009 and Clémer et al., 2010) as input and comparing the results to the standard HCHO re-trievals. The impact of the a priori (8.8 %) is estimated by taking the mean HCHO profile derived from the IMAGES model output above ISSJ instead of the WACCM model out-put. In the case of the surface albedo, a value of 0.2 is used throughout the year while the Koelemeijer et al. (2003) cli-matology shows it can vary from 0.2 (winter) to 0.05 (sum-mer) above the ISSJ area. The related impact on the HCHO VCD is small (1 %). The uncertainty of 9 % on the HCHO cross sections is taken from Pinardi et al. (2013).
4 Results
In this section, we present the daily-averaged HCHO prod-ucts retrieved from the ground-based FTIR and MAX-DOAS observations recorded at ISSJ and their comparison to both GEOS-Chem and IMAGES models, taking into account the vertical resolution and specific sensitivity of each remote sensing technique. The individual concentration profiles of HCHO simulated by both CTMs throughout the July 2010– December 2012 time period have been interpolated onto the respective vertical grids of FTIR and MAX-DOAS (see Sect. 3.1), then daily averaged and finally smoothed by ap-plying the specific averaging kernels A and a priori profiles from the FTIR and MAX-DOAS retrievals, according to the formalism of Rodgers and Connor (2003) and Eq. 1. The averaging kernels used for the smoothing of the CTM out-put profiles are the averaging kernels obtained from the in-dividual retrieved profiles, seasonally-averaged over spring (from March to May), summer (from June to August), fall (from September to November) and winter (from December to February) throughout the entire investigated time period.
Further in this work, the comparisons between smoothed CTM outputs and ground-based retrieval products are car-ried out only for the days with observations available, i.e., 261 days for FTIR and 440 days for MAX-DOAS. Given the MAX-DOAS vertical sensitivity, only partial columns of HCHO simulated by the models between the 3.6 and 8 km
altitude range are confronted by MAX-DOAS retrieval prod-ucts, while the comparisons between CTM and FTIR data in-volve the total columns (representing approximately the tro-pospheric column). In order to show that the FTIR and MAX-DOAS measurements are complementary for HCHO mea-surements at Jungfraujoch, we have added to Figs. 4, 6 and 7, involving the FTIR and MAX-DOAS columns the HCHO concentration retrieved by MAX-DOAS for the 3.6–3.8 km near-surface layer, i.e., the first 200 m thick layer directly above the station, where the MAX-DOAS is highly sensitive (see Sect. 3.1).
4.1 Seasonal modulation of formaldehyde
The monthly mean HCHO abundances over the July 2010– December 2012 period and associated 1σ SD, displayed on a 1-year time base, are provided in Fig. 4, with the FTIR total columns (in red) and the MAX-DOAS 3.6–8 km partial columns (in purple) in Fig. 4a and b, respectively. The HCHO concentration for the 3.6–3.8 km layer according to MAX-DOAS is presented in Fig. 4c. The thick solid lines corre-spond to a running mean fit of the daily average data, with a 15-day step and a 2-month-wide integration time, while the shaded areas represent the 1σ SD around the running mean curve. The running mean fits and the associated 1σ SD of the GEOS-Chem (in blue) and IMAGES (in green) HCHO out-puts smoothed by the FTIR (in Fig. 4a) and MAX-DOAS (in Fig. 4b and c) seasonal averaging kernels have been added to Fig. 4 as thick solid lines and thin curves, respectively.
According to Fig. 4, HCHO amounts retrieved from the ground-based FTIR and MAX-DOAS observations at the ISSJ present a clear and consistent seasonal cycle, char-acterized by a summertime maximum in July–August and a late winter minimum. The running mean total columns from FTIR observations range from 0.92 ± 0.30 to 2.19 ± 0.72 × 10¹⁵molec cm−2, representing a seasonal amplitude of 83 % (defined here as the difference between the maxi-mum and the minimaxi-mum running means, divided by the an-nual average over the investigated period), and the running means of partial columns from MAX-DOAS vary between 0.75 ± 0.19 and 1.43 ± 0.45 × 10¹⁵molec cm−2, represent-ing a seasonal amplitude of 66 %, slightly weaker than in the FTIR results. It is worth noting that the seasonal amplitude calculated on the basis of the MAX-DOAS HCHO concen-tration within the 3.6–3.8 km altitude range equals ∼ 130 %, highlighting the strong sensitivity of this instrument to the near-surface layer.
Ground-based FTIR HCHO observations have already been performed at NDACC sites located at different lati-tudes. Such FTIR measurements have shown a good over-all agreement when compared with HCHO observed from space by GOME (Jones et al., 2009), ACE-FTS (Viatte et al., 2014) and SCIAMACHY (Vigouroux et al., 2009). However, it appears firstly that differences in altitude affect the di-rect comparisons between these ground-based sites and the
Figure 4. Monthly-mean column abundances of HCHO and associated 1σ SD bars displayed on a 1-year time base, according to the FTIR and MAX-DOAS retrievals (a and b, respectively) above Jungfraujoch from July 2010 to December 2012. The circle, triangle and square dots correspond to the monthly means from 2010, 2011 and 2012, respectively. The thick curves correspond to a running mean fit to the daily-mean columns displayed on a 1-year time base (not shown here), with a 15-day step and a 2-month-wide integration time. The shaded areas represent the 1σ SD associated with the running mean curves. As it is calculated on the basis of the daily-mean columns, this 1σ SD convolves interannual variability and variability of the monthly mean. Note that the FTIR abundances correspond to total columns and the MAX-DOAS data consist of partial columns within the 3.6–8 km altitude range. The HCHO amounts calculated from the smoothed CTM profiles are displayed in each frame as running mean fit (solid thick curve) and the associated 1σ SD (thin line). A similar figure, but for the HCHO concentration derived from MAX-DOAS and the CTMs within the 3.6–8 km near-surface layer, is drawn in (c).
ISSJ. Viatte et al. (2014) measured HCHO total columns in the Arctic at another background site in Eureka, Canada (80.0◦N, 86.4◦W, 610 m a.s.l.), and reported monthly
aver-aged values over the 5-year period 2007–2011 from 0.27 to 3.14 × 10¹⁵molec cm−2. The total columns derived from the FTIR data set of Jungfraujoch are consistent with the mea-surements from Eureka, given that the strong vertical gradi-ent of HCHO concgradi-entration in the troposphere and the ISSJ
elevation contribute to the relatively lower HCHO amounts retrieved at Jungfraujoch. Moreover, Viatte et al. (2014) re-ported a seasonal cycle characterized by an amplitude of 93 % at Eureka, in agreement with the ISSJ FTIR observa-tions. It is difficult to compare the ISSJ with other back-ground sites because many of them experience enhancements in HCHO concentration resulting from distant anthropogenic activity and biomass burning. For example, Notholt et al.
(1997) reported higher monthly mean total columns between 1.67 and 4.25 × 10¹⁵molec cm−2at Ny Ålesund, Spitsber-gen (78.9◦N, 11.9◦E, 15 m a.s.l.), for the 1992–1995 time
period, as well as a second maximum during winter. Part of these differences compared to the ISSJ results might be explained by the updated spectroscopic line intensities for HCHO in HITRAN 2008 (Perrin et al., 2009) used in this study, increased by approximately 30 % compared to the pvious HITRAN compilations and hence decreasing the re-trieved total columns, added to the fact that direct trans-port of pollutants from Europe to Ny Ålesund occurs espe-cially during winter. In the Southern Hemisphere, Jones et al. (2009) presented monthly mean total columns varying be-tween 1.5 and 4.0 × 10¹⁵molec cm−2for the 1992–2005 pe-riod at Lauder, New Zealand (45.0◦S, 169.7◦E, 370 m a.s.l.), and Vigouroux et al. (2009) retrieved values ranging from 1.5 to 7.0 × 10¹⁵molec cm−2at Saint-Denis, Reunion Island (20.9◦S, 55.5◦E, 10 m a.s.l.), during 2004–2007 campaigns,
both sites being largely influenced by long-range transport of biomass burning plumes and HCHO precursors originating from Australia and Africa/Madagascar, respectively.
The seasonal variability of HCHO observed by both FTIR and MAX-DOAS instruments (Fig. 4) is consistent with the annual variations of the atmospheric photochemistry as well as with the annual cycle of biogenic emissions at North-ern Hemisphere mid-latitudes and more specifically over Europe (see Dufour et al., 2009b; Curci et al., 2010) and above Jungfraujoch (see Legreid et al., 2008, and references therein). Indeed, on an overall scale over Europe, the back-ground of HCHO throughout the year is supplied by oxi-dation of CH4 and other long-lived VOCs (Dufour et al., 2009b; Curci et al., 2010). In summer, enhanced tempera-tures and insolation induce a higher photochemical oxidation rate of VOCs by the OH radicals, which results in increas-ing the HCHO formation. Moreover, the summer periods are also characterized by large biogenic emissions of NMVOCs that are high-yield HCHO precursors, such as isoprene, tak-ing place in the continental boundary layer and originattak-ing from plants and temperate forests during the growing sea-son in the Northern Hemisphere (e.g., Dufour et al., 2009b; Stavrakou et al., 2009a; Curci et al., 2010). More specifically at Jungfraujoch, Legreid et al. (2008) reported measurements of higher concentrations in NMVOCs during summertime, which are attributed to secondary oxidation processes and higher emissions from biogenic sources essentially originat-ing from northern Italy (because of the higher biogenic ac-tivity in this region compared to the north of the Alps). As explained previously in Sect. 2.1, air masses containing such biogenic compounds might be transported from the boundary layer to the ISSJ by different atmospheric mechanisms (air advection, thermally driven convection, front passage and to-pographic venting) and eventually add to the NMVOC pre-cursors of HCHO. For instance, Bader et al. (2014) recently highlighted the role of biogenic sources and plant growth, especially from the region south of the Alps, in the increase
of methanol concentration, a high-yield precursor of HCHO, during summertime at Jungfraujoch. Conversely, minima of HCHO amounts observed at the ISSJ (Fig. 4) are primar-ily due to the lower radiation and the relatively weak at-mospheric moisture during winter, inducing lower concen-trations of OH radicals and hence lower oxidation rates of VOCs. Nevertheless, more elevated concentrations in reac-tive compounds from anthropogenic origin (such as ben-zene, toluene and butane), which are potential precursors of HCHO, were measured in winter at Jungfraujoch (Balzani Lööv et al., 2008; Legreid et al., 2008; Starokozhev et al., 2009) mainly because of their longer lifetimes and more in-tensive anthropogenic combustion during this season. Using a statistical trajectory model, Legreid et al. (2008) identi-fied northern Italy, southern France and southern Germany (highly industrialized and populated areas) as the main con-tributors to these anthropogenic emissions.
Figure 4 shows that both GEOS-Chem and IMAGES mod-els, smoothed by the specific averaging kernels of FTIR and MAX-DOAS, are able to reproduce the seasonal variations of HCHO above Jungfraujoch over the July 2010–December 2012 time period, showing a maximum in summer and a min-imum in winter. However, both CTMs simulate on average lower HCHO amounts than the columns retrieved from FTIR (from March to October) and MAX-DOAS (from June to August) observations, although these differences are not sig-nificant given the 1σ SD associated with the ground-based measurements. In winter, HCHO abundances from GEOS-Chem are relatively weaker or equal to FTIR and MAX-DOAS data, while IMAGES provides higher HCHO columns during this time period, especially in comparison with the MAX-DOAS partial columns. Such a difference can be ex-plained by the fact that Jungfraujoch is sensitive to anthro-pogenic NMVOC emissions in winter and these differ be-tween the two models. Indeed, total anthropogenic emissions over Europe (calculated within the 20◦W–60◦E and 36◦N– 88◦N area) for NMVOC species common to both models amount to 4.7 Tg C yr−1for GEOS-Chem and 15.7 Tg C yr−1 for IMAGES. Consequently, the CTMs simulate lower sea-sonal amplitudes above Jungfraujoch – more precisely, 80, 56 and 94 % for GEOS-Chem, and 63, 33 and 52 % for IMAGES – when successively compared to FTIR (83 %), 3.6–8 km MAX-DOAS (66 %) and 3.6–3.8 km MAX-DOAS (130 %) seasonal amplitudes, respectively. Ground-based ob-servations from both remote sensing instruments systemati-cally provide larger 1σ SD around the running mean curve than the models, especially during summertime. Indeed, the models dilute local enhancements in HCHO because of their relatively coarse spatial resolution.
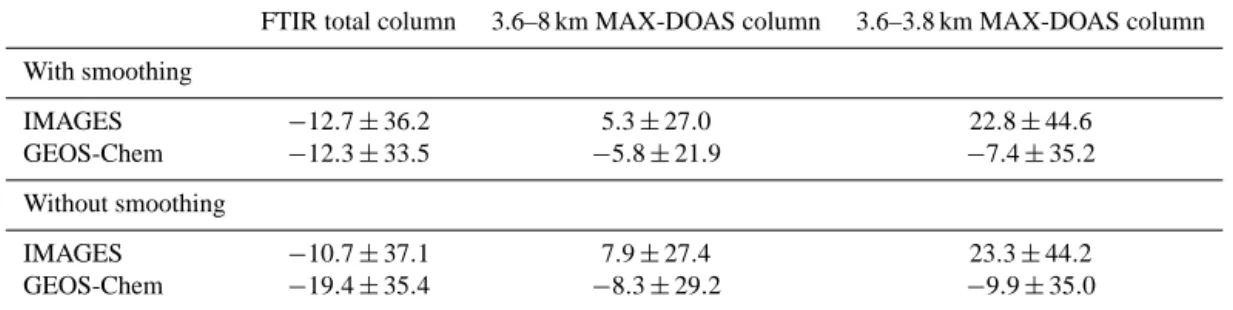
The discrepancies between the FTIR and MAX-DOAS seasonal cycles of HCHO and the smoothed CTM outputs (reported in Table 4) have been estimated on the basis of the daily means over the entire July 2010–December 2012 time period by averaging the daily fractional differences (de-fined here as the difference between two columns divided
Table 4. Mean fractional differences (in % ± 1σ ), calculated on the basis of daily-mean values, between the FTIR and MAX-DOAS HCHO columns (and near-surface concentration) and the CTM outputs for the July 2010–December 2012 time period above Jungfraujoch. These mean fractional differences are given for the comparisons involving the CTM profiles with and without smoothing by the FTIR and MAX-DOAS averaging kernels.
FTIR total column 3.6–8 km MAX-DOAS column 3.6–3.8 km MAX-DOAS column With smoothing IMAGES −12.7 ± 36.2 5.3 ± 27.0 22.8 ± 44.6 GEOS-Chem −12.3 ± 33.5 −5.8 ± 21.9 −7.4 ± 35.2 Without smoothing IMAGES −10.7 ± 37.1 7.9 ± 27.4 23.3 ± 44.2 GEOS-Chem −19.4 ± 35.4 −8.3 ± 29.2 −9.9 ± 35.0
by the average of these two columns) between the retrieved and the simulated HCHO columns (and concentrations in the near-surface layer). Such fractional difference aims at reduc-ing the impact of the large HCHO columns in the overall comparison between the two data sets. Table 4 summarizes these mean fractional differences for comparisons involving the CTM outputs with and without smoothing by the FTIR and MAX-DOAS averaging kernels. These results show that smoothed GEOS-Chem columns underestimate both ground-based data sets and that smoothed IMAGES columns under-estimate and overunder-estimate the FTIR and MAX-DOAS data, respectively. Moreover, the smoothing generally appears to improve the comparisons between the CTMs and the ground-based data sets. When considered over the year as a whole, the 1σ SD associated with these mean fractional differences indicates that the discrepancies are not significant. Parts of these large errors are due to the inability of the models to reproduce the seasonal amplitude of HCHO abundances re-trieved from FTIR and MAX-DOAS observations, as high-lighted previously in Fig. 4.
In the present study, a direct comparison between the FTIR total columns and the MAX-DOAS 3.6–8 km partial columns would not be meaningful (see Sect. 3.1), but the CTM simulations of HCHO still allow for an estimation of the consistency between both ground-based retrievals. In-deed, the mean fractional differences between the models and the FTIR data as well as the mean fractional differences calculated between the models and the MAX-DOAS obser-vations are embedded in the respective uncertainties of the ground-based measurements (see Table 2, 3 and 4). As the HCHO seasonal cycles derived from the same CTM simula-tions present similar discrepancies to the ground-based data sets when the CTM profiles are respectively smoothed by the FTIR and MAX-DOAS averaging kernels, this is an indica-tion that the FTIR and MAX-DOAS retrievals are consistent between each other for HCHO above Jungfraujoch over the investigated time period.
4.2 Formaldehyde concentration profiles
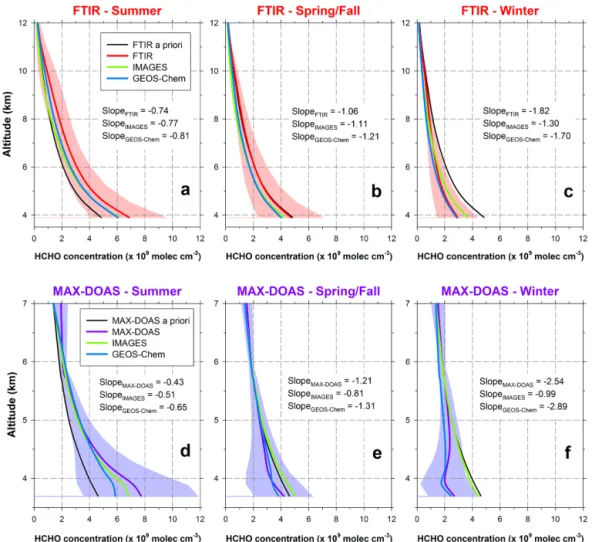
Figure 5 displays the seasonal averages of the HCHO con-centration profiles (in molec cm−3) above Jungfraujoch for the FTIR and MAX-DOAS data sets, as well as for smoothed CTM outputs, calculated on the basis of daily mean profiles over the entire July 2010–December 2012 time period. The shaded areas correspond to the 1σ SD around the mean sea-sonal profile retrieved from FTIR (in red) and MAX-DOAS (in purple) observations. In addition, the slope of each con-centration profile has been determined from a linear regres-sion of data points within the 3.6–7 km altitude range com-mon to the vertical resolution of both FTIR and MAX-DOAS techniques.
As already presented by Fig. 4, Fig. 5 illustrates the sea-sonal modulations of the averaged retrieved profiles in the lower troposphere above Jungfraujoch for each measurement technique. This modulation explains the largest part of the seasonal variability observed in the HCHO columns derived from the ground-based measurements. At the ISSJ altitude, mean HCHO concentrations indeed vary between 3.0 and 7.0 × 10⁹molec cm−3 from wintertime to summertime ac-cording to the FTIR data set and up to 8.0 × 10⁹molec cm−3 for the summer mean MAX-DOAS profiles. Throughout the year, these concentrations decrease rapidly with altitude, down to between 1.5 and 2.0 × 10⁹molec cm−3at 7 km alti-tude in the MAX-DOAS profile, which corresponds to the upper limit of vertical sensitivity for this instrument, and down to negligible values around 12 km altitude regarding the FTIR data.
The higher resolution of the MAX-DOAS profiles allows for a better representation of the first tropospheric layers di-rectly above Jungfraujoch in comparison with FTIR. This higher resolution results in stronger variations of the slope values associated with the retrieved HCHO profiles and in generally larger standard deviations around the mean pro-file in the closest vicinity of the ISSJ within each seasonal time period. In predominant background conditions such as at Jungfraujoch, a significant part of the HCHO column is situated in the free troposphere (∼ 25 % on average is
lo-Figure 5. Mean seasonal profiles of HCHO concentration (in molec cm−3) above Jungfraujoch according to the FTIR and MAX-DOAS retrievals (upper and lower frames, respectively), calculated on the basis of the daily means over the July 2010–December 2012 time period. The shaded areas correspond to the 1σ SD around the mean profiles. The smoothed profiles derived from the IMAGES (in green) and GEOS-Chem (in blue) simulations have been added to each frame. The mean slope of each profile has been estimated by adjusting a linear regression between 3.6 and 7 km altitude with the least mean squares method.
cated above 8 km), while in most other NDACC sites the contribution of the column above 8 km to the total column is generally negligible due to lower elevation and more pol-luted conditions. As previously highlighted by the respec-tive eigenvectors and averaging kernels of FTIR and MAX-DOAS displayed in Fig. 3, both FTIR (because of its larger altitude range of sensitivity) and MAX-DOAS (due to its very high vertical resolution in the lowest tropospheric lay-ers) are complementary and provide added-value measure-ments of HCHO distribution above Jungfraujoch.
The comparison between the smoothed CTM profiles and the ground-based retrievals presented in Fig. 5, as well as their associated slopes within the 3.6–7 km altitude range, confirms that both GEOS-Chem and IMAGES simulations tend to underestimate the retrieved HCHO abundances dur-ing summertime and that IMAGES overestimates it in win-ter. Regarding the spring and fall seasons, both models sim-ulate slightly lower HCHO concentrations than FTIR, and
IMAGES still overestimates HCHO amounts compared to the MAX-DOAS observations. However, these mean profiles derived from the smoothed CTM outputs are generally em-bedded in the 1σ SD area of the ground-based data on the entire range of investigated altitudes, and hence the related biases are not significant at that level of uncertainty. It is worth noting that the anomalies of the CTM outputs relative to the FTIR profile extend throughout the column in sum-mer, while the MAX-DOAS results imply that the largest discrepancies take place near the surface. This results from the differences of resolution between both instruments (see Sect. 3.1), the FTIR retrievals being sensitive up to 10–12 km and the MAX-DOAS profiles tending to reproduce the a pri-ori above 5.5 km.
Figure 6. Time series of daily-mean HCHO abundances and the associated 1σ SD bars from the FTIR (a) and MAX-DOAS (b) data sets. The solid thick curves (in red) represent the fitting function calculated by applying to the whole time series the statistical bootstrap resampling method from Gardiner et al. (2008). The daily-mean HCHO amounts from the smoothed IMAGES and GEOS-Chem models are displayed in green and blue, respectively. A similar figure, but for the HCHO concentration derived from MAX-DOAS and the CTMs within the 3.6– 3.8 km near-surface layer, is drawn in (c). The outliers (red dots) correspond to daily observation values with relative anomalies to the curve fit calculated by Gardiner et al. (2008), higher than the 95th percentile value of all relative anomalies of the data set.
4.3 Formaldehyde daily time series
Figure 6 presents the July 2010–December 2012 time se-ries of daily-averaged HCHO columns and the associated 1σ SD, as retrieved from the FTIR and MAX-DOAS obser-vations in Fig. 6a and b, respectively. The HCHO amounts consist of total tropospheric columns (FTIR) and in partial
columns within the 3.6–8 km altitude range (MAX-DOAS) according to the vertical resolution and sensitivity of each remote sensing instrument. The daily mean outputs, derived from the HCHO profiles provided by both GEOS-Chem and IMAGES models and smoothed by applying the FTIR and MAX-DOAS averaging kernels, are drawn in blue and in green for the coincident days with the ground-based data sets.
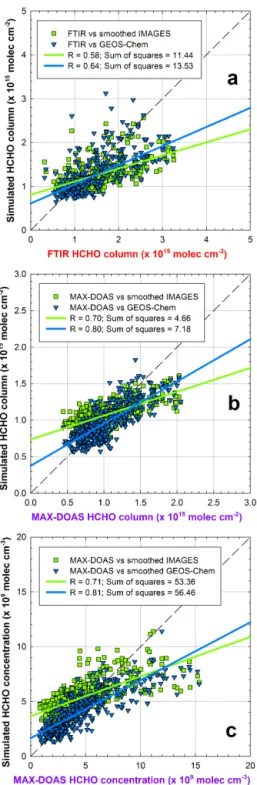
Figure 7. Direct comparisons between the FTIR and smoothed CTM daily-mean HCHO columns (a) and between the MAX-DOAS and smoothed CTM daily-mean partial columns within the 3.6–8 km altitude range (b) displayed in Fig. 6. The blue and green straight lines correspond to the linear regressions (with R as the cor-relation) between the ground-based measurements and the model outputs. A similar figure, but for the HCHO concentration de-rived from MAX-DOAS and the CTMs within the 3.6–3.8 km near-surface layer, is drawn in frame (c). Outliers identified as red dots in Fig. 6 have been discarded from the data sets.
The red solid thick curves represent the fitting of the whole time series by the statistical bootstrap resampling method (Gardiner et al., 2008), which is a combination of a linear function and a third-order Fourier series accounting for the intra-annual variability of the data set. The similar time series for the 3.6–3.8 km near-surface HCHO concentration derived from MAX-DOAS and both CTMs are drawn in Fig. 6c.
The daily-averaged total columns of HCHO retrieved from the FTIR solar spectra at the ISSJ vary between 0.32 and 5.51 × 10¹⁵molec cm−2. These values are consistent with total columns retrieved from FTIR solar spectra recorded at other NDACC sites (Notholt et al., 1997; Jones et al., 2009; Vigouroux et al., 2009; Viatte et al., 2014) given the ISSJ elevation and the dominance of weakly polluted air masses. For instance, Viatte et al. (2014) reported total col-umn amounts ranging from 0.02 to 6.30 × 10¹⁵molec cm−2 over a 5-year time series at Eureka. The MAX-DOAS time series present a minimum of partial column within the 3.6– 8 km altitude range equal to 0.44 × 10¹⁵molec cm−2 and a maximum reaching 2.85 × 10¹⁵molec cm−2. The FTIR data set shows the larger seasonal amplitude (consistent with the seasonal modulation previously highlighted in Fig. 4) but also the higher dispersion around the fitting function, with an absolute mean fractional difference over the whole time period equal to 24.1 % compared to 20.0 % for the MAX-DOAS time series. The minimum daily values during win-tertime are approximately equal to 1.0 × 10¹⁵molec cm−2 with a small dispersion around this value for both FTIR and MAX-DOAS time series, indicating a dominant contribution of the first tropospheric layers to the total amounts of HCHO above Jungfraujoch during winter (80–90 %) and conversely a less significant contribution during summer (60–70 %).
These results show that the seasonal modulation of HCHO and its day-to-day variability (for the latter, solely in the case where the uncertainties on the FTIR measurements are con-sistent with the MAX-DOAS uncertainties) are not solely due the variability in the lower troposphere (Fig. 6b and c) where the MAX-DOAS instrument is the most sensitive. Conversely, part of the variability also takes place in higher tropospheric layers. Indeed, the HCHO formation in the upper troposphere might be seasonally enhanced by large-scale atmospheric transport and/or convective fluxes bring-ing more precursor compounds to the upper layers (Stickler et al., 2006; Fried et al., 2008). In this latter case, such a vari-ability may only be captured by the FTIR instrument owing to its more uniform vertical sensitivity throughout the tro-posphere compared to the MAX-DOAS, as indicated by the larger seasonal amplitude of the FTIR data set.
Finally, these results also suggest that the HCHO season-ality above Jungfraujoch is not solely influenced by the vari-ations of photolysis and oxidation rate of CH4, otherwise this seasonal signal would affect homogeneously the entire column. Conversely, the HCHO seasonality and its day-to-day variability seem to be driven rather by incursions of NMVOC precursors from anthropogenic (especially in