1
The Comparative Performance of For-profit, Public and Third-sector Providers
in the Field of “Voucher Services” in Belgium:
a DEA Frontier Approach
Jacques Defourny and Arnaud Henry
Centre for Social Economy and Department of Economics, HEC Management School, University of Liege (Belgium)
Contact: J.Defourny@ulg.ac.be
Centre d’Economie Sociale,
HEC-ULg, Sart Tilman, B33, box 4 4000 Liège (Belgium)
ABSTRACT
The “service voucher” scheme recently launched by the Belgian government to fight unemployment
provides a major example of a fast developing quasi-market in which providers of all types compete.
This paper presents a comparative analysis of technical efficiency for various categories of
organisations operating in this field and belonging to the for-profit, the non-profit and the public
sectors. Results suggest that the most efficient organizations vary greatly depending on the
specification of the outputs expected from the providers. More specifically, when indicators related to
the training and supervision of unemployed people put back to work and the type of labour contracts
proposed to the latter are introduced to enlarge the specification of the production, third sector
2 Introduction
Quasi-markets introduce regulated competition between public, for-profit and third-sector providers.
The need to compare and evaluate these different providers has therefore become an important issue.
However, except for some particular fields (such as schools, hospitals and nursing homes), such
comparative evaluations between different types of providers remain rather scarce, especially in terms
of economic efficiency.
In this paper, we will focus on a comparative performance analysis of the various types of providers
operating within the “service voucher” scheme introduced by the Belgian government in the area of
domestic services. We won’t repeat all descriptive features of that scheme already detailed in the
previous article of this special issue (Defourny et al., 2010). We will also rely on the same survey and
we will address various issues already dealt with by these authors. However, we will do so in a totally
different perspective focusing on the comparative technical efficiency of the providers, the output of
the latter being defined in different ways.
We will first look at some theoretical arguments as to the expected behaviours of for-profit, non-profit
and public providers when competing in a same market and we will see how relevant these arguments
may be in our specific field of study (section 1). For our empirical work, we present the data, the Data
Envelopment Analysis techniques as well as the various specifications of the production we will use,
gradually enlarging the definition of providers’ outputs beyond the sole quantity of service (section 2).
Having reached efficiency scores for the various types of providers, we will try to see if differences
among those various categories can be explained by factors like ownership structure and other
contextual characteristics (section 3).
1. Defining and approaching the performance of voucher service providers
If we consider a rather standardized product such as an hour of cleaning service, provided at a fixed
price, a first approach of comparative performance among providers may refer to cost efficiency in a
3 cost or a given quantity of services at the lowest cost. In such a case, that provider also has the highest
profitability (at least for a given quantity or cost). Such a situation may be seen as the classical target
of a for-profit whose principals are equity owners who seek the best returns on their investments and
have strong incentives (through their profit claims) to monitor the firm toward such a direction.
Compared to such a situation, the “property rights” school stresses problems non-profit or public
enterprises may face when ownership rights are not in the hands of those who control the organization.
The monitoring of managers may therefore prove to be less strictly orientated toward cost efficiency,
unless the motivations of the managers and the organisational design are such that they may solve
agency problems in a way which is as effective as in a traditional for-profit firm (Fama and Jensen,
1983).
This first ownership issue may result in different behaviours among types of organisations but our
approach of comparative performance has also to take into account the fact that the output of voucher
service providers is much more complex than a standardized product. Indeed, it can be argued that we
have here two quite distinct categories of buyers: the direct user of the service, who pays about a
quarter of the service's overall production cost, on the one hand, and the government, who pays the
three other quarters of the production cost, on the other hand. While the direct user mainly or
exclusively cares about the quality of the provided service (especially at a fixed price), the government
is mainly concerned with job creation and reduction of undeclared employment, so as to reduce
unemployment. As stated in the law which created the service voucher scheme, the government is also
concerned with the overall quality of those jobs, especially in terms of stability and fulfilment of
certain conditions as to the minimum number of work hours and the type of work contract proposed
after a certain period. Those dimensions are probably also important for the managers and other
4 We could also argue that all providers in this specific industry have three or four stakeholders, namely
the principals, the direct service users, the government and the workers (probably looking for job
quality), who all value differently the various types of outputs and outcomes.
In any case, it seems straightforward that the providers’ performance cannot be apprehended through
the cost efficiency criterion. However, provided that the outputs or outcomes should be defined so as
to capture major concerns of the second (governmental) buyer, cost efficiency can still be used as a
key criterion to ensure that public funds are used in the best possible way.
Still, empirical attempts to measure performance in fields like services, even through the
cost-efficiency evaluation, are facing major challenges, as some attributes of the service may not be
observable. It is why many studies trying to compare for-profit, non-profit and public providers of
services tend to focus on observable outputs and observable dimensions of service quality (or, more
precisely, dimensions of quality which are relatively easy to monitor or assess); these dimensions are
what Weisbrod and Schlesinger (1986) term “Type I dimensions”. “Type II dimensions” are those
which are difficult to monitor because customers (here, the direct users and the government) suffer
from asymmetric information in their relation with producers.1
For the direct users of voucher services, unobservable attributes of the service refer mainly to the
quality of the house cleaning, especially if they are not at home or if they do not have the time or the
willingness to check such a quality in details. However, it seems possible to argue that, although not
on the spot of the service delivery, the managers of the providing organisation explicitly or implicitly
receive an overall evaluation of the service through more or less frequent complaints or the absence of
such feedback. We may expect that all types of providers will care about delivering a quality of
service which is at least sufficient to avoid loosing customers. In such a perspective, however, the mix
of management decisions - firing a worker, assigning him or her to another customer, developing
1
Schlesinger and Gray (2006) offer a large survey of the literature comparing nursing homes with different ownership structures while making clear distinctions between Type I and Type II dimensions.
5 training programs, monitoring strategies or pressures to avoid absenteeism - will probably differ
according to the main goals of the providers.
As to the other “customer” (the government), the main observable dimension it cares about is the
number of jobs created. As to job quality, many parameters are affected by a severe asymmetry of
information, but this asymmetry may be at least partly overcome in two ways. Firstly, the service
voucher law has imposed various requirements on providers. However, these will be effective only if
the providers’ compliance with these requirements is controlled. Secondly, some providers may send
signals indicating that they particularly care about job quality and integration of the hard-to-place
jobseekers, either through the traditional non-distribution constraint (in spite of the well-known
limitations of such a constraint) or through an explicit accreditation as work integration enterprise or
as home care provider. As already mentioned, such providers may even receive some additional
subsidies for pursuing those “accredited” goals.
These elements suggest that all providers do not probably behave in the same way as to their jobs’
quality, although it is likely that they all try to offer a quality at least sufficient to avoid loosing
workers.
In short, the diversity of the providers’ main objectives as well as the complexity of the outcome mix
in this “industry” lead us to expect differences in terms of performance level, at least according to the
dimensions taken into account in such an overall performance.
2. Method, data and specifications of the production
There are various methods to approach the comparative performance of the various types of producers,
from descriptive indicators through more sophisticated indexes or econometric methods. In line with
the above discussion as to an enlarged conception of performance as well as with a legitimate search
for a cost-efficient use of public resources, we have chosen to focus on the cost efficiency (also named
technical efficiency) of the production of two outputs or outcomes “embedded” in the voucher service,
6 this first step, the job quality apprehended through some indicators. No survey is available about the
service quality as perceived by the direct users, so we make the assumption that, given a fixed price,
all providers try to offer at least the minimum level of quality needed to keep their customers.
In order to calculate the technical efficiency of organisations for different specifications of the
production, we use the Data Envelopment Analysis (DEA) method. As already mentioned in the
introduction, the underlying idea is indeed to compare providers on the basis of their production, using
different – and increasingly larger - notions of production, including, at each stage of analysis,
different job quality indicators. The idea is firstly to compare the three sectors on the basis of their
technical efficiency. We then compare the seven categories of providers as defined by the typology
presented in the previous article of this volume, and we integrate in our analysis the existing
differences in terms of mission pursued by the organizations, with a view to completing our first
results.
2.1 The DEA method
The DEA approach measures the firm’s efficiency, a notion developed by Farrell (1957). According to
this author, a firm is technically efficient if it obtains maximal outputs from a given set of inputs
(output-oriented approach), or alternatively if it minimizes inputs for a given set of outputs
(input-oriented approach). In order to construct the production frontier and thus to measure the firm’s
efficiency, different empirical approaches exist. These are different according to whether they are
parametric or not and determinist or stochastic (Hollingsworth et al, 1999). Data Envelopment
Analysis (DEA) is a non-parametric and determinist approach which allows to catch efficiency scores
of each decision-making unit (or DMU) by calculating the distance between DMUs and the production
frontier (this distance is then considered as an inefficiency measure). Although this approach has the
disadvantage to be sensible to “outliers”, it also has different advantages. First of all, because of its
non-parametric characteristic, DEA does not assume any specific functional form. The production
frontier is then quite easily built, thanks to the best practices observed in the population, with the only
7 a priori assume weights on the multiple inputs and outputs of DMUs. Secondly, DEA can handle
multiple inputs and multiple outputs of the decision-making units (or DMUs). Thirdly, this approach
also satisfies unit invariance.
In order to compare voucher service organizations (our DMUs), we consider the DEA model under the
assumption of variable returns to scale (VRS). This model, developed by Banker, Charnes and Cooper
(1984), adjusts the model of constant returns to scale developed by Charnes, Cooper and Rhodes in
1978 by adding a new convexity constraint. Moreover, we use the output-oriented version of this
model to measure the firm’s efficiency. In any case, the choice for a particular orientation is not as
important in DEA approaches as it is in econometric studies (Coelli and al, 2005). In particular, the
choice of an orientation has only limited effects on the efficiency scores obtained by organizations
(Coelli and Perelman, 1999).
2.2. Collected data
The data we use in the three tested specifications are based on diverse sources. Firstly, it originates
from surveys carried out on a sample of 52 organisations located in the three regions of Belgium and
belonging to the different categories of providers identified in our typology. In addition, in order to
complete our data as well as to add some complementary variables, two exhaustive databases from the
Belgian national office for employment (“ONEM”) have been used. The first one provides data about
the amount of service vouchers reimbursed annually to each organisation. The second provides
information on the contracts of every worker involved in the system of service vouchers.
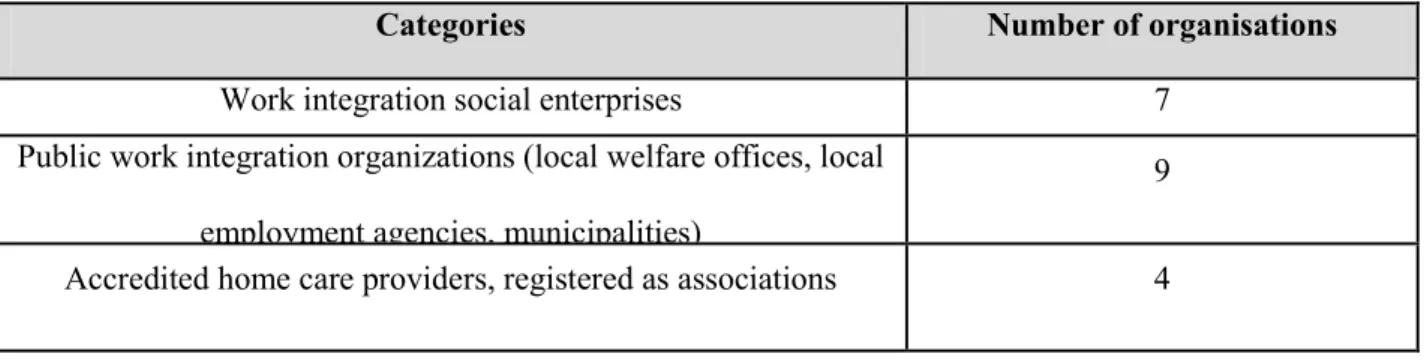
Table 2: Sample of voucher service providers used for the DEA method
Categories Number of organisations
Work integration social enterprises 7
Public work integration organizations (local welfare offices, local
employment agencies, municipalities)
9
8 Accredited home care providers, registered as
local welfare (public) offices
5
Temporary work companies 3
Other private commercial companies 5
Other third-sector organisations 5
The database constituted in this way has been arranged carefully. Providers presenting incoherent data
were deleted. Since all data used referred to 2006, the few providers of the sample who had begun
their activities in 2007 were deleted too. Finally, some organisations could not be included in the final
database because pieces of information were missing. In fine, out of the 52 organisations initially
surveyed, 38 have been used in our specifications. These organisations are spread among the various
categories of our typology as presented in Table 2.
2.3. Variables and specifications
The first specification tested, that we call the “restricted specification of the production”, takes into
account the sole production of providers in the more narrow sense: the inputs defined by the number
of workers in FTE are only put in relation with the “number of reimbursed service vouchers” output.
The choice of the sole “labour” factor in the input category seems relevant in the case of domestic
services, given the low importance of the “capital” factor for this type of service. It allows to
determine which kinds of organisation are able to get the highest amount of voucher services and
hence to provide the highest number of paid service hours with a fixed number of employees
(house-workers and supervisors).
Table 3: Restricted specification of the production
INPUTS
HW FTE Number of house-workers in full-time equivalent in 2006
SP FTE Number of supervisors in full-time equivalent in 2006
9 VS Number of service vouchers reimbursed in 2006
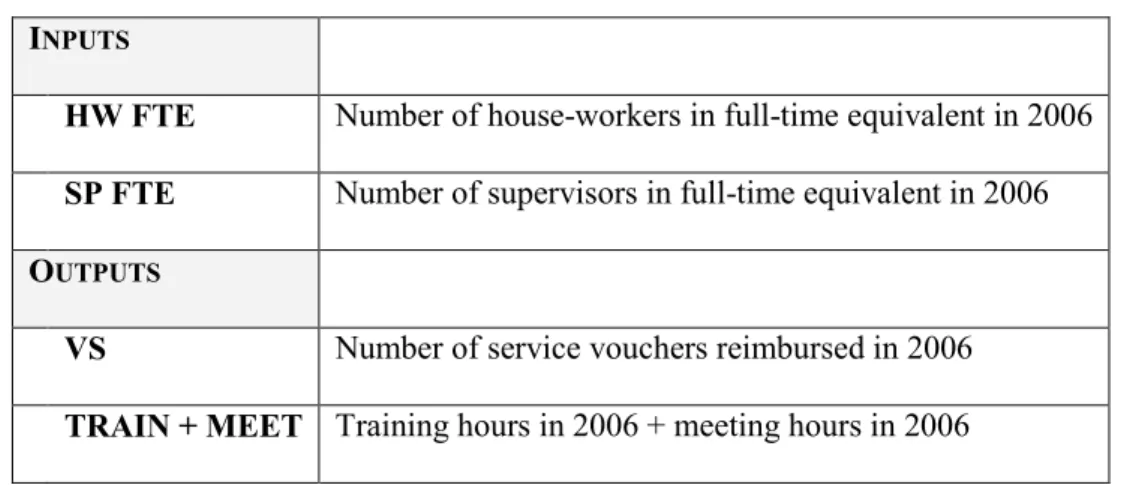
In order to go further than the sole productive aspects of efficiency, we have then developed a
specification of the production that includes, in the outputs, two elements related to job’s quality,
namely the training provided to the workers and the meeting which are organised to discuss and solve
various problems faced by the workers. This specification presents at least two advantages. First, it
considers that the working time considered in the inputs actually generates an output which is made of
the labour paid via service vouchers and the hours of training and meeting.2 Secondly, it integrates
elements of job quality that are crucial, given that most workers involved here are low-qualified
workers.
Table 4: Enlarged specification of the production
INPUTS
HW FTE Number of house-workers in full-time equivalent in 2006
SP FTE Number of supervisors in full-time equivalent in 2006
OUTPUTS
VS Number of service vouchers reimbursed in 2006
TRAIN + MEET Training hours in 2006 + meeting hours in 2006
In order to build the TRAIN variable, we have considered the number of training hours that each
organisation claims to provide per year and per worker. This result has then been multiplied by the
number of HW who, according to the organisation, actually benefited from such training in each
company. As to the MEET variable, it relies on the assumption that most meeting hours for
supervision contribute to improve the quality of the job and/or of the service provided to users as well
as workers’ qualification as a factor of reduced probability to fall unemployed, an output which may
be valued by both workers and the government.
2
In order to be complete, we should also have included the time spent by houseworkers travelling between different workplaces. Unfortunately, these data were not available. Nevertheless, by integration a variable related the population density in the regressions on efficiency scores (see hereafter), we probably capture part of this factor.
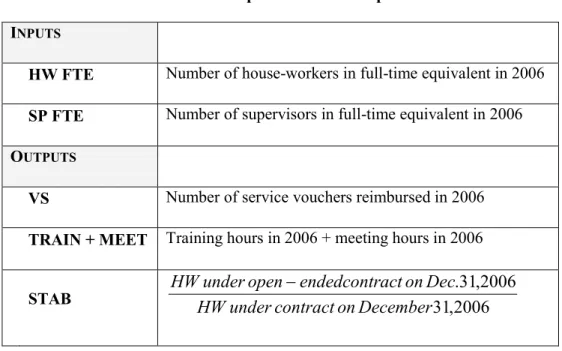
10 The third and last specification tested is the extended model. This model, which aims to capture the
stability of the contracts offered to the workers, adds a complementary factor of employment quality in
the set of outputs. Similarly to the former one, this specification aims to consider the underlying logic
of the service voucher mechanism, i.e. a policy aiming to create jobs and to rehabilitate low-qualified
workers. The introduction of an indicator based on the type of labour contract is particularly
interesting as providers have different policies regarding this criterion.
Table 5: Extended specification of the production
INPUTS
HW FTE Number of house-workers in full-time equivalent in 2006 SP FTE Number of supervisors in full-time equivalent in 2006
OUTPUTS
VS Number of service vouchers reimbursed in 2006
TRAIN + MEET Training hours in 2006 + meeting hours in 2006
STAB 31,2006 2006 , 31 . December on contract under HW Dec on act endedcontr open under HW −
3. Efficiency scores and the role of the ownership structure
Table 6 provides some basic information as to the efficiency scores identified by a VRS
output-oriented model for the different specifications.
Table 6: Summary statistics of DEA method
Mean Standard deviation Minimum Maximum % of efficient organisations Restricted specification 0.396 0.202 0.173 1 7.9%
11 Enlarged specification 0.575 0.287 0.173 1 21% Extended specification 0.940 0.118 0.456 1 57.9%
The share of efficient organisations (score = 1) is higher when using larger conceptions of the
production, as the growing number of variables included in the model offer more possibilities to
perform well.
3.1. What induces efficiency: A second-stage analysis
Since we wanted to analyze the impact of the ownership structure of service voucher organizations on
their technical efficiency, we defined a “sector” dummy variable, which refers to the sector of the
organisations (the public sector being the reference), or alternatively a “category” dummy variable,
which refers to the seven categories of providers identified (work integration public organisations
being the reference. Other contextual characteristics taken into account in the model were the size of
the organization (size of its workforce), the age of the organizations (expressed in months, as the
system was created recently), the population density of areas where organizations operate and the
“regional location” of organizations (a dummy variable was created for organizations based in
Flanders, Brussels and Wallonia, with the last one used as a reference).
To regress efficiency scores on these variables, we used the following Tobit model3 :
Or alternatively:
3.2. Role of the ownership structure when considering the restricted specification
12 When using the restricted specification of the production, sector-based comparative analyses show
that, in terms of efficiency, third-sector and for-profit organizations obtain better results than public
providers (table 7a). With for-profit organizations chosen as a reference, the regression furthermore
shows that for-profit organizations are significantly more efficient than third-sector and public
organizations (table 7b). This is not a surprising result: for a given set of inputs, for-profit providers
indeed are expected to focus exclusively on income-generating strategies and to maximize the
resources coming from the reimbursement of service vouchers. Such strategies will include
minimizing both the number of staff workers to monitor house-workers and the non-productive hours
of the latter devoted to training and meeting. They may also avoid counting travel time from a
workplace to another in the paid hours as well as involve pressures to minimize absenteeism.
As to differences in efficiency scores obtained by third-sector and public organizations, they can
probably be explained by different ways of functioning. Public organizations generally rely on a more
bureaucratic and hierarchical management, which makes their organisation heavier and less flexible.
In a restricted view of production, these characteristics lead to lower efficiency scores, resources being
equal. Moreover, third-sector organisations, since they are private entities, bear greater risks than
public organisations, which cannot go bankrupt. They are therefore more strongly induced to use their
resources efficiently, in order to ensure their viability.
These first results are supported by the model that tests the “category” effects (table 8). All for-profit
organizations (temporary work companies and other private commercial companies) obtain a positive
and statistically significant coefficient. We also have to notice the positive coefficient obtained by
accredited home care NPOs, which can probably be accounted for by the experience accumulated by
these providers in managing and planning their traditional home care services which require to a large
extent the same kind of tools and practices as those needed by the voucher services. For instance, we
refer here to past experience in managing services supported by public subsidies and to planning tools
which allow to minimize waste of time by house-workers when travelling from a user’s home to
13 improve workers’ productivity. In this context, the non significance of the coefficient obtained by
accredited home care public providers may seem surprising, as they follow the same mission and thus
theoretically also benefit from the same kind of accumulated experience as accredited home care
NPOs. However, the already mentioned differences between public and third-sector operators in
management styles and search for economic viability should probably be kept in mind. Moreover,
although we do not have evidence on this, some field actors suggest house-workers hired by those
public providers may experience more precarious living conditions as they more often rely on
minimum assistance schemes.
By maximizing the number of hours provided at the user’s home and, consequently, the number of
service vouchers, for-profit providers and accredited home care NPOs seem to favour productive
aspects of their activity more than the other types of organizations do. However, we do not know so
far whether this choice is made to the detriment of non-productive activities which could for instance
improve the qualification of the workers or the overall job’s quality. It is why we now turn to an
analysis based on larger conceptions of the production.
3.3. Role of the ownership structure when considering the enlarged specification
With a specification of the production enlarged to training activities and meetings for supervision,
third-sector organizations remain more efficient than public organizations (table 7a, second column).
However, for-profit organizations no longer perform better than public organizations. Furthermore, the
alternative version, with for-profit organizations chosen as a reference, no longer presents for-profit
organizations as more efficient than third-sector organizations (table 7b). For-profit organisations thus
lose their status of “most efficient organizations” when aspects linked with job quality are taken into
consideration in the measurement of efficiency.
These results can be better interpreted when considering the “category” effects as well (table 8).
14 integration social enterprise and accredited home care NPOs obtain a significant and positive
coefficient.
Here again, the higher scores of accredited home care NPOs can be partly explained by a transfer of
functioning patterns from the section of the organisation dedicated to the accredited home care
services to the newly created section devoted to voucher service activities (Vermer et al, 2008). We
especially refer here to practices concerning workers' training and supervision, two dimensions which
are precisely taken into account in the enlarged specification of the outputs/production. This effect is
probably combined with the more general transfer of experience already identified in the restricted
specification.
Moreover, the results reached by these NPOs are also linked to a probably important “shared
resources” effect. “Shared resources” are resources of an organization for its traditional activities and
put at the disposal of its new voucher service section (for free or under-priced in internal accounting
terms). For instance, a NPO can make an accountant or premises available, free of charge, to its
voucher service section and therefore improve the observable efficiency of the latter through those
hidden inputs. This phenomenon which could not be apprehended through our survey can of course
occur in every type of organization which has other activities than just the voucher services and it may
have an positive impact on efficiency with both the restricted and the enlarged specification of
production4.
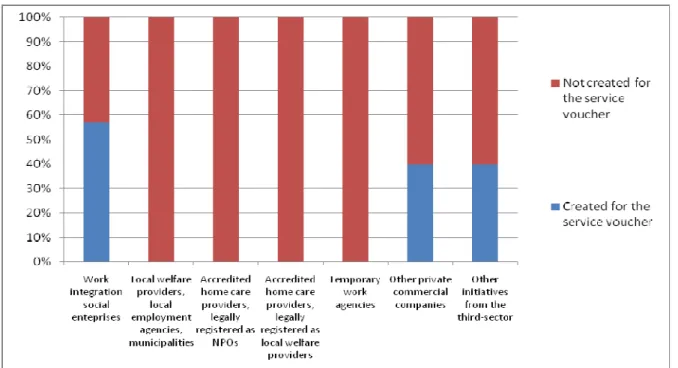
As suggested by Figure 1, the “shared resources” effect probably plays a greater role for providers
such as accredited home care providers (both non-profit and public), public work integration initiatives
and temporary work companies which generally existed before the setting up of voucher service
activities. As a result, in addition to factors already listed, it may contribute to explain higher
“restricted” efficiency of both accredited home care NPOs and temporary work companies. It probably
4
Shared resources can have a significant impact on efficiency with the enlarged specification of production when they are represented by employees providing training and supervision to house-workers.
15 also explains part of the higher “enlarged” efficiency of both non-profit and public accredited home
care providers (table 8).
Figure 1: Share of organizations specifically created to operate in the service voucher scheme
within the sample of 38 organisations
Source: survey data As to the positive coefficient obtained by work integration social enterprises for the “enlarged”
efficiency, it can be explained by the specific mission they pursue. These organizations indeed try to
create jobs by developing productive activities with disadvantaged workers, notably unemployed
people who have not reached the upper secondary school level. Such a social mission leads these
organisations to be accredited by regional governments and to receive public subsidies in order to train
and supervise their workers. Unlike shared resources, which remain hidden, these additional resources
are taken into account by the “supervisors (SP FTE)” variable in all our specifications of the
production. The positive and significant coefficient of work integration social enterprises thus tends to
suggest that these organisations make an efficient use of these resources provided those activities
16 If we come back to the “enlarged” efficiency of the whole third-sector as compared to the for-profit
sector (table 7b), it however appears to be mitigated by the non significant coefficient obtained by the
“other initiatives” from the third-sector (table 8). This is mainly due to the fact that these organisations
less frequently offer training to their workers.
The results for the public sector are somehow positively influenced by the scores obtained by
accredited home care public organizations. These can rely, as already stated, on transfers of experience
and shared resources. However, the performance of the public sector as a whole is also negatively
affected by the scores obtained by work integration public organizations (reference of the model),
despite the fact that these organizations are theoretically close to work integration social enterprises
and can moreover benefit from more shared resources than their third-sector counterparts. Again, such
differences may be explained by potential differences between third-sector and public organizations in
terms of management (and perhaps workers’ profiles). Furthermore, some work integration public
organizations acting as local welfare providers for deeply disadvantaged users sometimes pursue a
home care mission rather than a work integration mission. For such organisations, aspects linked to
job quality may have a lower priority than more global objectives linked to home care as well as the
personal and social life of these persons.
In conclusion, when using the enlarged specification of production, for-profit organizations no longer
perform better than other types of organization. Unlike home care NPOs, for-profit providers are no
longer significantly more efficient than other organisations when job quality aspects are included in
the model (and this holds true both for temporary work companies and other private commercial
companies). For-profit organizations seem to privilege productive hours at the expense of
non-productive hours dedicated to the workers' training and supervision. Our analysis however does not
cover all aspects of workers’ guidance and more detailed indicators used elsewhere suggest strong
differences in the behaviour of temporary work companies and other private commercial companies,
the latter being, in several aspects, more concerned than the former with the quality of the jobs offered
17 3.4. Role of the ownership structure when considering the extended specification
The extended specification of the production takes into account a variable related to the stability of the
contracts offered, that is the proportion of house-workers under open-ended contracts. To the extent
the government wants to foster the creation of stable jobs through the service voucher scheme, it
seems reasonable to give some weight to providers’ practices oriented toward such a perspective. Of
course, an open-ended labour contract does not necessarily mean a long term perspective for the
worker within the enterprise. However, it is clearly different from a situation where the employer just
offers successive short-term contracts.
The extended specification of the production highlights the positive and significant coefficient of
third-sector organizations in comparison with public ones and, in an alternative specification, in
comparison with for-profit providers (tables 7a and 7b). This result reinforces what already appeared
partly with the enlarged specification: when enough job quality indicators are included in the model,
third-sector organizations appear to be the most efficient organizations on the quasi-market.
A clearly new feature is the fact that the results for the for-profit sector are essentially mitigated by
temporary work companies (table 8). These organizations indeed obtain a statistically significant
negative coefficient while this is not the case for other private commercial companies. This can be
explained by the weak guidance offered by temporary work companies to their workers, but, even
more, by the fact that, in a large majority of cases, these firms offer fixed-term contracts to their
workers. By so doing, they try to combine profitability and flexibility objectives. In terms of
profitability, they keep a majority of workers under very short-term contract in order to avoid paying
hours which are not reimbursed by service vouchers (for instance when a user is absent, on holidays or
for any other reason). It also allows them to easily put an end to relations with workers that they do not
want to keep. These practices also reveal a strategy to remain as flexible as possible, with a view to
answering easily and quickly every request made by the users. The use of fixed-term contracts indeed
18 The worker is not offered a more stable status until the organization has the certainty that the user is a
regular user and is satisfied with the worker. The labour relation then tends to be de facto located
between the worker and the user, without practically any intervention by the employer in terms of
supervision and guidance. Our efficiency analysis had already revealed that heterogeneity exists within
the third-sector and the public sector; the extended specification shows that it is also true in the
for-profit sector.
Work integration social enterprises and accredited home care NPOs again account for the positive
results obtained by third-sector organisations as a whole, once more in contrast to other third sector
initiatives. It is worth noting that accreditation of work integration social enterprises by regional
governments here plays a particular role since these organizations are required in most cases to hire
their workers directly on an open-ended contract. The “Stab” variable included here among the outputs
therefore takes a high value.
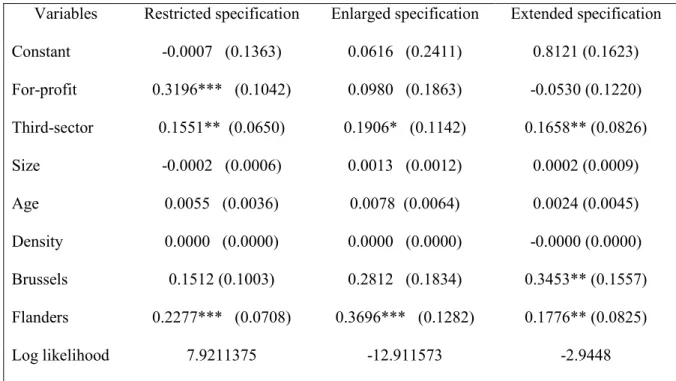
Table 7a: Second-stage analysis (Tobit model) – “Sector” effect
(with the public sector as reference)
Variables Restricted specification Enlarged specification Extended specification
Constant -0.0007 (0.1363) 0.0616 (0.2411) 0.8121 (0.1623) For-profit 0.3196*** (0.1042) 0.0980 (0.1863) -0.0530 (0.1220) Third-sector 0.1551** (0.0650) 0.1906* (0.1142) 0.1658** (0.0826) Size -0.0002 (0.0006) 0.0013 (0.0012) 0.0002 (0.0009) Age 0.0055 (0.0036) 0.0078 (0.0064) 0.0024 (0.0045) Density 0.0000 (0.0000) 0.0000 (0.0000) -0.0000 (0.0000) Brussels 0.1512 (0.1003) 0.2812 (0.1834) 0.3453** (0.1557) Flanders 0.2277*** (0.0708) 0.3696*** (0.1282) 0.1776** (0.0825) Log likelihood 7.9211375 -12.911573 -2.9448
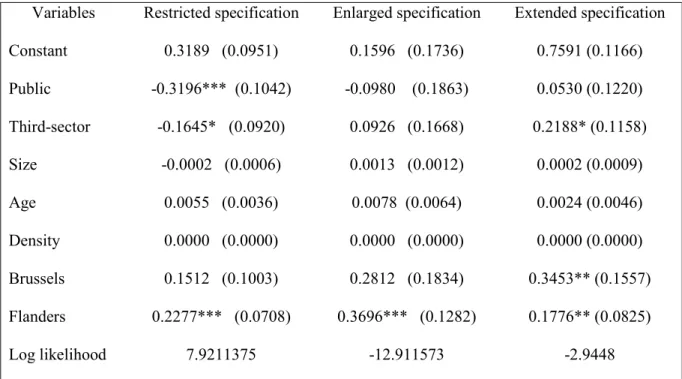
19 Table 7b: Second-stage analysis (Tobit model) – “Sector” effect for an alternative specification
(with the for-profit sector as a reference)
Variables Restricted specification Enlarged specification Extended specification
Constant 0.3189 (0.0951) 0.1596 (0.1736) 0.7591 (0.1166) Public -0.3196*** (0.1042) -0.0980 (0.1863) 0.0530 (0.1220) Third-sector -0.1645* (0.0920) 0.0926 (0.1668) 0.2188* (0.1158) Size -0.0002 (0.0006) 0.0013 (0.0012) 0.0002 (0.0009) Age 0.0055 (0.0036) 0.0078 (0.0064) 0.0024 (0.0046) Density 0.0000 (0.0000) 0.0000 (0.0000) 0.0000 (0.0000) Brussels 0.1512 (0.1003) 0.2812 (0.1834) 0.3453** (0.1557) Flanders 0.2277*** (0.0708) 0.3696*** (0.1282) 0.1776** (0.0825) Log likelihood 7.9211375 -12.911573 -2.9448
*** significant at 1%, ** significant at 5%, significant at 10% Table 8: Second-stage analysis (Tobit model) – “Category” effect
(with public work integration organizations as a reference)
Variables Restricted specification Enlarged specification Extended specification
Constant 0.0328 (0.1305) 0.0795 (0.2233) 0.8230 (0.1248)
Work integration social
enterprise
0.1066 (0.0807) 0.2738* (0.1380) 0.2500** (0.9734)
Accredited home care
NPOs
0.3745*** (0.1050) 0.5861*** (0.1898) 0.2300** (0.1112)
Accredited home care
local welfare services
0.0661 (0.0894) 0.2570* (0.1532) 0.1446* (0.0824) Temporary work agencies 0.3910*** (0.1350) 0.0320 (0.2472) -0.2890** (0.1281) Other private companies 0.3070*** (0.1075) 0.1791 (0.1848) 0.0509 (0.0981)
20 Other initiatives from
the third-sector 0.1372 (0.0904) 0.0819 (0.1521) 0.1055 (0.0840) Size -0.0005 (0.0006) 0.0018 (0.0014) 0.0012 (0.0007) Age 0.0037 (0.0034) 0.0033 (0.0059) -0.0008 (0.0036) Density 0.0000 (0.0000) 0.0000 (0.0000) 0.0000 (0.0000) Brussels 0.1018 (0.1044) 0.1209 (0.1836) 0.1640 (0.1230) Flanders 0.2511*** (0.0663) 0.3775*** (0.1161) 0.1520** (0.0631) Log likelihood 11.242506 -9.0135583 2.0535358
*** significant at 1%, ** significant at 5%, significant at 10%
3.5. Role of contextual characteristics
Concerning the variables which are not directly linked to the ownership structure, the most striking
result is the positive and strongly significant coefficient of the “regional dummy” for Flanders as
compared to Wallonia in all specifications. We think that this result is most probably related to the
composition of our sample: the proportion of organisations created specifically for the voucher service
scheme is higher in Wallonia than in Flanders. These organisations cannot benefit to the same extent
from shared resources and, all other being equal, this leads to lower efficiency scores56. The fact that
accreditation systems for organizations with a specific social mission somehow vary among regions
may also contribute to explain part of those differences.
We also note that the “size”, “age” and “density” variables are never significant, whatever
specification is considered. For the “age” variable defined by the number of months of operation of a
section or an organization providing voucher services, various elements might explain its
non-significance. First, since the system under its current form was launched in 2003 and our data relate to
5 The composition of our sample also explains why the “Brussels” dummy has a positive and significant coefficient with the enlarged specification when the “sector” effect is tested: the for-profit sector does not include any temporary work company (offering less open-ended labour contracts) in this region, which means it can easily have a better “extended” efficiency.
6
The composition of our sample also explains why the “Brussels” dummy has a positive and significant coefficient with the enlarged specification when the “sector” effect is tested: the for-profit sector does not include any temporary work company (offering less open-ended labour contracts) in this region, which means it can easily have a better “extended” efficiency.
21 2006, differences among organisations in terms of age cannot be really important. Clearer differences
among organisations in terms of age might appear within a few years. Secondly, as already underlined
by figure 1, a large majority of providers were not created ex-nihilo and instead already existed before
the setting-up of the voucher service scheme (even if they were not active in domestic services).
Consequently, typical problems of infant enterprises (lower efficiency and increased risk of
bankruptcy during the first year) were probably avoided in most cases. It would have been interesting
to consider the role of the “age” variable with the only organizations created ex-nihilo to operate
within the service voucher scheme, but we did not have enough of such enterprises in our sample to
make econometric tests.
We could have expected a positive impact of the population density on technical efficiency, as a high
density may increase the probability of having users close to each other, therefore allowing to
minimize unproductive time for travelling from a workplace to another7. It is clearly not the case here,
which may mean our variable is not an appropriate proxy for the actual time devoted to travelling
times. Moreover, a higher density of population may also mean more competition among providers
and not necessarily a higher concentration of their respective customers.
3.6. The importance of the regulation effect
The results presented here above suggest that the organisations' ownership structure matters. However,
the heterogeneity found within each sector - and particularly within the third-sector invites to go a bit
further in our analysis. Indeed, it seems that belonging to the third-sector is not sufficient to ensure the
implementation of good practices in terms of job quality: work integration social enterprises and
accredited home care NPOs perform much better than other third sector initiatives. These two
categories as well as accredited home care public organizations, which also emerge within the public
sector, share a common feature, i.e. a governmental (tutelary) accreditation of their social mission
7
It should be reminded however that for-profit providers often do not count such a travelling time in the total of paid hours.
22 within statutory frameworks. Although such frameworks do not directly concern “voucher service”
activities, they seem to have an impact on the enlarged and extended efficiency of the providers.
In order to apprehend such a potential “tutelary regulation” effect, we carried out a new analysis with a
Tobit model, while replacing the “category” or “sector” variables by a new dummy variable for
accredited (or not) organizations8.
Table 9: Second-stage analysis (Tobit model) – “Regulation” effect
Enlarged specification Extended specification
“Regulation” 0.2719*** (0.1036) 0.1906** (0.0793)
*** significant at 1%, ** significant at 5%, significant at 10%
As expected, the “regulation” effect seems to be decisive in the enlarged and extended specifications
of the production.
In the case of work integration social enterprises, the better quality of the jobs provided is probably
directly linked to this “regulation” effect: as already mentioned, the latter means additional resources
devoted to training and supervision activities as well as mostly open-ended labour contracts for the
persons in the re-integration process. In the case of accredited home care providers, this effect is
rather an indirect one: practices prevailing in the pre-existing sections, accredited for domiciliary care,
are generalized in the “service voucher” section of the organization, such a process being supported by
shared resources9.
Moreover, the “regulation” effect brings about a new element helping to explain, partly, why public
work integration organizations reach lower scores than their third-sector counterparts although they
8
As they do not really differ from what was observed in previous models, we do not present here the coefficients for the “size”, “density”, “age” and “locality” variables, in order to focus on the “regulation” effects.
9
This argument does not take into account the shared resources, even though these two effects can of course combine themselves.
23 seem to share the same social mission. Public work integration organizations are indeed not accredited
for that mission (although they of course operate within some legal frameworks) and therefore do not
receive the same additional resources10. The same can be said for the other “non-accredited” third
sector initiatives: the lack of additional resources and of a regulatory framework certainly explains
why they behave so differently than the accredited third sector categories as to job quality.
4. Conclusions
Our aim was to carry out a comparative evaluation of providers operating on the recently launched and
fast developing quasi-market of “voucher services” in Belgium. With a Data Envelopment Analysis,
we worked out efficiency scores for 38 organisations with three different conceptions of the
production. Results based on a two-steps analysis showed that for-profit providers are the most
efficient organisations when only traditional productive aspects are taken into account; results
however change when job quality indicators are included in the specification of the outputs. In
particular, third-sector organisations appear to be increasingly efficient, and even become the best
performing providers when the analysis relies on larger conceptions of the production.
Enlarged or extended conceptions of the production seem particularly legitimate and appropriate when
the delivery of services is heavily funded by the state. In that case indeed, it seems necessary to
include the objectives of such a public policy in any evaluation system. Sometimes, public authorities
may even offer a specific support to organizations which explicitly pursue goals in line with the public
interest, such as for instance the creation of jobs for disadvantaged workers or the provision of
services to vulnerable groups.
Once the need to conceive outputs in a wider sense is acknowledged, the key issue is the choice of
relevant indicators to be combined with traditional measures of production. This of course involves
10
It has to be reminded that additional resources allocated to work integration social enterprises are taken into account in our efficiency analysis insofar as they actually are used to increase the number of supervisors. Therefore, differences captured by the “regulation” effect between public and third-sector work integration organizations do not concern exclusively differences in terms of available resources. As underlined previously, management practices also differ significantly.
24 conceptual, methodological as well as empirical challenges which are sometimes very difficult to
address. From this point of view, the limits of our variables to capture job quality were clear although
data had been collected through in-depth interviews. Such difficulties however should not discourage
further attempts to better capture the various dimensions of service providers’ performance.
Bibliography
Banker, R.D., Charnes, A. & W.W. Cooper (1984), "Some models for estimating technical and scale
inefficiencies in Data Envelopment Analysis", Management Science, 30:9, 1078-1092.
Chalkley, M. & J. M. Malcolmson (1996), "Contracts for the National Health Service ", Economic
Journal, 106:4, 1691-1701.
Charnes, A., Cooper, W. & E. Rhodes (1978), "Measuring the efficiency of decision-making units",
European Journal of Operational Research, 2, 429-444.
Coelli, T. & S. Perelman (1999), "A comparison of parametric and non-parametric distance functions:
With application to European railways," European Journal of Operational Research, 117:2, 326-339.
Coelli, T.J., Prasada Rao, D.S., O'Donnell, C.J. & G.E. Battese (2005), An Introduction to Efficiency
and Productivity analysis, 2nd Edition, Springer, New-York.
Defourny, A., Henry, A., Nassaut, S., Defourny, J. & M. Nyssens (2008), "Performance evaluation
and legitimacy of the third sector: the case of the Belgian domiciliary care quasi-market", HEC-ULg
Working paper n°200807/02.
Defourny, J., Henry, A., Nassaut, S. & M. Nyssens (2010), "Does the mission of providers matter on a
quasi-market? The case of the Belgian service voucher scheme", Annals of Public and Cooperative
Economics,
Donni, O. (1994), "Efficiency of Day Care Centers in Belgium", Ciriec Working Paper 94/02.
Farrell, M.J. (1957), "The Measurement of Productive Efficiency", Journal of the Royal Statistical
Society, 120, 253–290.
Fama, E.F. & Jensen, M.C. (1983), "Separation of Ownership and Control", Journal of Law and
25 Flynn, R. & G. Williams (Eds.) (1997), Contracting for Health: Quasi-Markets and the NHS, Oxford
University Press, Oxford.
Henry, A., Nassaut, S., Defourny, J. & M. Nyssens (2008), "Titres-Services : Régulation
quasi-marchande et performances comparées des entreprises prestataires", revue belge de sécurité sociale,
2008/2.
Hollingsworth, B., Dawson, P.J. & N. Maniadakis (1999), "Efficiency measurement of health care: a
review of non-parametric methods and applications", Health Care Management Science, 2, 161-172.
Idea Consult (2008), Evaluatie van het stelsel van de dienstencheques 2007- Eindrapport, Brussel.
Le Grand J. & W. Bartlett (1993), Quasi-markets and social policy, Macmillan, London.
Schlesinger, M. & and B. H. Gray (2006), “How Nonprofits Matter in American Medicine, and What
To Do About It”, Health Affairs, 25(4), 287-303.
Vermer, M., Nassaut, S. & M. Nyssens (2008), "Les effets d’une coexistence de différents modes de
régulation, suite à la création d’un quasi-marché dans le secteur de l’aide à domicile belge. Le cas des
Services d’aide aux familles et aux personnes âgées", Economies et sociétés, série « Economie et
Gestion des Services », 9.
Weisbrod B.A. & M. Schlesinger (1986), "Public, private, nonprofit ownership and the response to
asymmetric information: The case of nursing homes", in S. Rose-Ackerman (Eds), The economics of