JOURNAL OF GEOPHYSICAL RESEARCH, VOL. 94, NO. A5, PAGES 5419-5426, MAY 1, 1989
Rapid
Deactivation
of N(2D) by O' Impact
on Thermospheric
and
Mesospheric
Odd
Nitrogen
C. G. FESEN
Laboratory for Atmospheric and Space Physics, University of Colorado, Boulder, Colorado
J.-C. GI•RARD
lnstitut d'Astrophysique, Universitt• de Lidge, Lidge-Ougrt•e, Belgium
D. W. RUSCH
Laboratory for Atmospheric and Space Physics, University of Colorado, Boulder, Colorado
One- and two-dimensional
models
of thermosphe•c
odd nitrogen
are used
to explore
the conse-
ea a •] a
quences of the recently m sured f st quenching of N(D) by O. A 1 rge rate coefficient for this reaction
profoundly
affects
the
4odd-nitrogen
chemistry
by removing
N(2D)
as
a source
of NO and
increasing
the
concentration of N(S), •which destroys NO. The model t:alculations show that, as the quenching rate increases, the NO and N(D) densities decrease, while N(S) densities increase. Comparisons with At-
mosphere Explorer and Solar Mesosphere EXplorer satellite observations are made. Use of the fast
quenching rate in the models causes the NO peak altitude, typically observed near 110 km, to rise to
140.km.
The
N(2D) densities
become
20 times
smaller
than
those
observed,
while
the modelled
NO
(N(S)) densities are roughly 2 to 3 times too small (large). Additional measurements of the N(D) + O
quenching rate are clearly warranted. If the quenching rate is indeed very rapid, the chemistry of thermospheric odd nitrogen must be completely reexamined.
]NTRODUL•ON
The odd-nitrogen
constituents
NO, N(4S),
and
N(2D)are
important in the chemistry and thermal structure of the ther- mosphere. The exothermic reactions involving the odd-ni- trogen species are the dominant heat source from 150 to 250 km [Ridley et al., 1987]. NO also cools the thermosphere through infrared radiation at 5.3 gm, most effectively in the altitude region of 120-140 km [Ridley et al., 1987]. NO is particularly important in the radiative balance of this region during solar cycle maximum [Roble and Emery, 1983; Gdrard and Roble, 1986, 1988]. Lower in the atmosphere, the ion- ization of NO by Lyman alpha radiation is important to the formation of the D region [Nicolet and Aikin, 1960] while downward transport of thermospheric NO may perturb strato- spheric ozone densities during polar nights [Solomon and Garcia, 1984]. In the ionospheric E region, NO controls thecharge
transfer
rate from 0 2 + to NO + and thus
the ionic com-
position.
Recently a serious complication has arisen in the NO chemistry. It has long been thought that the reaction of
N(2D) with
0 2 was
the major
source
of NO in the thermo-
sphere [Norton and Barth, 1970; Strobel et al., 1970; Rusch, 1973]. This assumption has come into serious question as aresult
of recent
measurements
of the
deactivation
of N(2D)
by
0 [Jusinski and Slanger, 1987; Jusinski et al., 1988]. A veryCopyright 1989 by the American Geophysical Union. Paper number 88JA04208.
0148-0227/89/88JA-04208505.00
high efficiency for this quenching process was measured,
which
essentially
nullifies
the
reaction
of N(2D)
and
0 2 as
an
effective source of NO. Consequently, the entire odd-nitro- gen chemistry of the mesosphere and thermosphere must be reexamined. This paper utilizes both one- and two-dimen- sional odd-nitrogen models to investigate the consequences
of fast O quenching
of N(2D) on the thermosphere.
The
model results are then compared to satellite measurements of
NO and
N(4S), including
observations
obtained
with the ul-
traviolet spectrometer on board the Solar Mesosphere Ex- plorer satellite.
The theoretical description of the behavior of the odd-ni- trogen species has been a challenge since nitric oxide was first observed in the thermosphere by Barth [1964]. Nitric oxide is an extremely variable constituent, with strong de- pendencies on latitude, season, solar cycle, and magnetic ac- tivity; longitudinal effects are also indicated [e.g., Stewart and Cravens, 1978; Cravens and Stewart, 1978; Cravens et
al., 1985; Cravens and Killeen, 1988, and references therein]. The current theoretical understanding of NO chemistry as con-
tained in most models is detailed here. The reactions and the adopted rate coefficients are given in Table 1.
The sources of thermospheric nitric oxide are predomi- nantly
N(2D)+ O2-• NO+O
N(
45)+ 0 2-• NO+O
(1) (2) while the loss is through
5420
FESEN
ET
AL.'
RAPID
DEACTIVATION
OF
N(2D)
BY
O
Ntnnbtr Reaction0)
N(SD)
+ O: NO
+ O
•2)
NCs) + o:
NO + o
('3) N("S) + NO • N 2 + O(4)
NO
+
+
ß
• N(•22
(5)
N2
+ + O -) N ) + NO
+
(6) N 2 +e--,N+N+e (7) N2• + hv -+ N +• (8) N(•D) + O --• N•'S) + O (9) N(•D) + ß --+•N("S) + ß (10) N('D) --, N("S) + hv Units of crn 3 s -1 unless otherwise indicated. Read 5E-12 as 5x10 -12.TABLE 1. Important Reactions
Rate* Reference 5E-12 + 4.4E- 12exp(-3220/T) 3.4E-11
4.2E-7(300ffe)
0'85
1.4E-
10(T/300)
0'44
see reference see reference see text6.0E-
100re•00)0'5
1.07E-5 s' sLin and Kaufman [ 1971 ]
Becker et al. [1969] Lee et al. [1978]
Kley et al. [1977]
McFarland et al. [1974] Strickland and Meier [1982] Richards et al. [1981]
Frederick and Rusch [1977] Garstang [1956]
N(4S)+ NO-• N 2+O
(3)
Reaction (1) has been thought to dominate the NO pro- duction in the lower and middle thermosphere.
For
N(2D),
the
main
sources
are
NO++ e --> N(2D) + O
(4)
N2
N 2++ O--> N(2D)+ NO
+
(5)
+ + e* --> N(2D)
+ (N(2D),
N(4S)
) + e
(6)
N2 + hv --> N(2D) + N(4S)
(7) while the loss is throughN( 2D)+ O2--> NO+O
(1)
N(2D) + O --> N(4S)
+ O
(8)
N(2D)+ e--> N(4S)+ e
(9)
N(2D) --> N(4S)
+ hv (520-nm)
(10)
The assumption that reaction (1) provides the main source
for NO is questionable
if the removal
of N(2D) through
reaction (9) is fast compared to the rate of reaction (1). Two sets of laboratory values now exist for the deactivation coef-ficient
of N(2D) by atomic
nitrogen.
Davenport
et al.
[1976]
reported
a value
of 1.8 + 0.6 x 10
-12 cm
-3 s
-1 at 315
K whereas lannuzzi and Kaufman [1980] obtained 1.8 + 0.3 x
10
-12 cm
-3 s
-1 at 300 K. More
recently,
the temperature
de-
pendence has been measured [Jusinski and Slanger, 1987; Jusinski et al., 1988], and the coefficient was found to be 3.4
x 10
-11 exp (-145 / Tn). Consequently,
the laboratory
quenching rate is now measured to be at least 50 times as large as the rate determined by analysis of atmospheric mea- surements as described below. The effect of a large quenching
rate
is to remove
N(2D)
as the
dominant
source
of NO through
reaction (1); this calls into question a number of other mea- surements and calculations involving each of the odd-nitro- gen species.
In a series of papers using AE measurements of the 520-nm
emission
from N(2D) and supporting
data,
Rusch
et al.
[1975], Frederick and Rusch [1977], and Rusch and Gdrard
[1980]
each
concluded
that
the
quenching
rate
of N(2D)
by O
had
to be small
(about
4 x 10
-13 cm
3 s-l). Cogger
et al.
[1980] reached the same conclusion by combining Arecibo radar data with groundbased photometer observations. How-ever, the rate determined
in the laboratory
is 2-3 x 10-11
cm
3 s
-1, depending
on temperature,
or more
than
50 times
that which stems from the atmospheric determinations. The analysis of Frederick and Rusch [1977] showed that even if reactions (4)-(7) were 100% efficient in the production of
N(2D), a value
for the
N(2D)
+ O quenclfing
rate
0.1 times
the
laboratory value could not satisfy the 520-nm measurement. If the new laboratory value were adopted, no 520-nm emis- sion would have been detected by the Visible Airglow Exper- iment (VAE) [Hays et al., 1973] on AE. The maximum vol-
ume
emission
rate
would
have
been
less
than
1 photon
cm
-3
s -1, far below
the detection
threshold.
Additional
analysis
in
the same
paper
of N(2D) nighttime
emission
gave
the same
low value for the quenching. At night, only one source is
operative
for N(2D)
(reaction
(4)). Even
under
the
assumption
of unit
efficiency
for N(2D) production
from
reaction
(4), the
data are not consistent with a large quenching rate. In an analysis of auroral 520-nm emission, Rusch and Gdrard [1980] reported vertical column brightness measurements of 15-30 rayleighs above about 150 km. The magnitude of the emission, again, is consistent with a low quenching rate, provided the chemical scheme outlined above is valid.
A potential, although unlikely, solution to the discrepancy
is that
the radiative
lifetime
of the N(2D) state
adopted
in
these studies is incorrect. If the radiative lifetime were
significantly shorter than the 24 hours initially calculated by Garstang [1956] and confirmed by recent detailed computa- tions [Godefroid and Froese Fischer, 1984; Zeippen, 1982], then the emission rate could be greater even if the state were rapidly quenched. For the magnitude of the emission to be near that measured by VAE, the radiative lifetime would have to decrease, to first order, by the ratio of the quenching rates determined in the atmosphere to that determined in the laboratory, or a factor of 50. The required lifetime, under the assumption of fast quenching, to produce a volume emission rate near that measured would be about 0.5 hour. However,
the assumed
short
radiative
lifetime
of N(2D) does
not allevi-
ate the reduced production of NO through reaction (1.) Two additional factors may enter into the theoretical pic- ture. First, since several of the relevant reactions in the odd- nitrogen chemical scheme have temperature-dependent rate coefficients, the computed number densities are quite sensitive to the temperature profile. Second, an intriguing idea
FESEN
ET
AL.:
RAPID
DEACTIVATION
OF
N(2D)
BY
O
5421involving the possibility of a population of translationally
excited
N(4S) atoms
was suggested
by Solomon
[1983].
Some
of these
"hot"
N(4S) atoms
would
preferentially
react
with 0 2 to produce NO instead of destroying NO through re- action (3.) Thus this process may constitute an additional source of N, but a quantitative evaluation of its efficiency re- quires additional information about hot atom chemistry.MODEL DESCRIPTIONS
The dependence
of the odd-nitrogen
system
on the N(2D)
quenching rate is investigated through use of one-dimensional and two-dimensional models. The one-dimensional model is
time-dependent and basically similar to that described by Gdrard and Taieb [1986]. The UV solar fluxes and their de- pendence on solar activity are taken from Torr and Torr [1985] with the corrections to the extreme ultraviolet fluxes suggested by Richards and Torr [1988]. The latitude-depen- dent eddy diffusion coefficients derived by Ebel [1980] for solstice conditions are adopted. The branching ratios for
production
of N(2D) atoms
by processes
(6) and
(7) are
set
to
0.6 and
0.5, respectively.
The quenching
rate of N(2D) by
atomic oxygen is varied to investigate its effect on the calcu- lated odd nitrogen species in comparison with observations.
The two-dimensional model is that of Gdrard and Roble
[1986, 1988], based on earlier modeling work by Roble and Kasting [1984] and Gdrard et al. [1984]. This is a coupled chemical-dynamical-radiative model of the thermosphere which includes in full detail the chemical production and loss
of NO, N(4S),
and
N(2D),
horizontal
and
vertical
transport,
and the effect of particle-induced ionization and heating in
the auroral zones.
In brief, the model solves the zonal and meridional mo- mentum, thermodynamic, continuity, hydrostatic, and diffu- sion equations for the mass mixing ratios of the major con- stituents, thereby calculating the time-dependent, two- dimensional distribution of the O, 0 2 and N 2 densities and the neutral winds, pressure, and perturbation temperatures. Particle precipitation and a high-latitude heat source are in- cluded in the formulation, as is the infrared emission of NO in the 5.3-1xm band. The calculated zonal mean atmosphere is
used to solve for the distribution of the minor neutral con-
stituents
NO, N(4S),
and
N(2D) by updating
the production
and loss terms and the wind components in the continuity equations for the minor constituents at each time step. The calculated NO density is then used to update the net heating term in the thermodynamic equation for the mean atmosphere at the next time step. Ion densities are also computed assum- ing photochemical equilibrium. The latitudinal grid in the model extends from pole to pole in 5 ø increments; the altitude scale is from 70 to 356 kin, in pseudo-log pressure coordi-
nates, with variable step sizes which are approximately
one-
third the local atmospheric scale height.
Recent updates to the model include a seven-wavelength- interval representation of the solar UV fluxes and photoion- ization and absorption cross sections of O, 02, and N2 (R.G. Roble and B.A. Emery, private communication, 1983); updat- ing of the ion drag coefficients at each time step; and addi- tion of the heating due to the exothermic reaction of N + NO. Reaction rates and branching ratios were also updated where necessary to agree with more recent laboratory and theoretical
developments.
The branching
ratios
adopted
for N(2D)pro-
duction by reactions (6) and (7) are 0.6 and 0.5, respectively.The two-dimensional model calculations correspond to northern summer solstice, solar cycle minimum conditions,
with an F10.7 index of 80. The model calculations of Gdrard
and Roble [1986], which r9present these same conditions, were used as initial conditions for the model runs. Thus, the neutral winds temperatures, and densities of O, 0 2, N 2, and
of NO,
N(4S)
', and
N(2D)
calculated
by
the
Gdrard
and
Roble
[1986] study were used to start up the model. The numerical integration is run for 30 days, after which a quasi-steady state
is reached.
COMPARISONS OF MODEL TO DATA
Model simulations were carried out for three values of the
quenching
rate of N(2D) by O, corresponding
to high,
inter-
mediate, and low efficiency for the reaction. The reaction
rates
are ko= 5x10
-13, lx10
-12, and
3.4x10
-11 exp
(-145
/
Tn) cm
-3 s-l; these
correspond,
respectively,
to the values
deduced by Frederick and Rusch [1977] and Torr et al. [1976],based
on N(2D) airglow
measurements,
and
the rate
recently
measured in the laboratory by Jusinski and Slanger [1987] and Jusinski et al. [1988].One-Dimensional Model Results
The Atmosphere Explorer (AE) satellite series [Dalgarno et
al., 1973] is particularly
valuable
in model
validation
since
(nearly) simultaneous observations of the major ionic and neutral species were obtained. Richards et al. [1981] present
AE-C
altitude
profiles
of NO, N(4S),
and
N(2D)
from
February
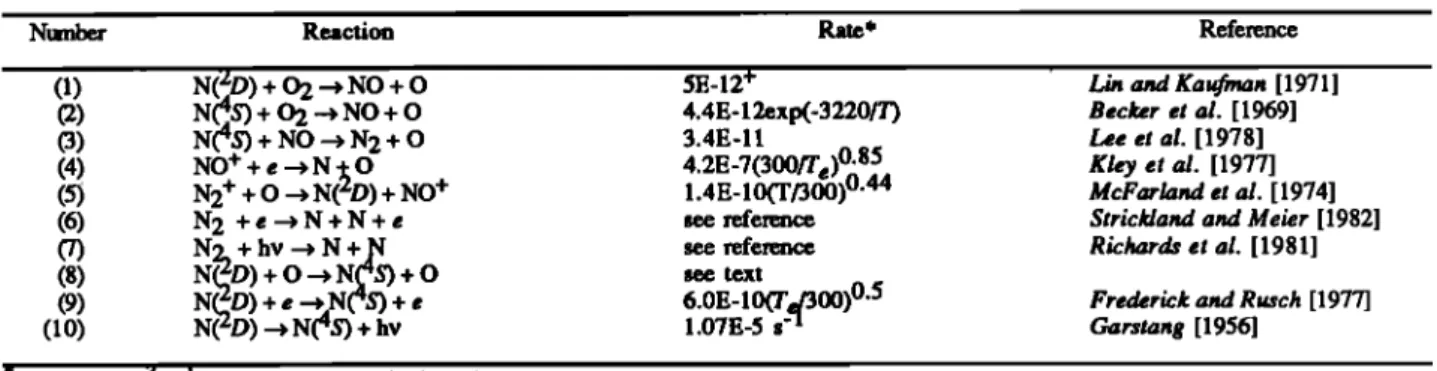
14, 1974, 1400 LT, 40øN. The measurements were obtained by the Ultraviolet Nitric Oxide Experiment (UVNO) [Barth et al., 1973], Neutral Atmosphere Composition Experiment (NACE) [Spencer et al., 1973], and the Visible Airglow Ex- periment (VAE) [Hays et al., 1973] instruments, respectively. Figure 1 reproduces these AE measurements, along with the one-dimensional model results for similar conditions using the low, medium, and high quenching rates.
The model with the low quenching rate (Figure la) repro-
duces
the
NO and
N(4S)
profiles
fairly
well,
although
the cal-
culated
NO (N(4S))
densities
are
slightly
larger
(smaller)
than
observed.
The calculated
N(2D) densities
are also
somewhat
larger than observed. The calculations done with the medium quenching rate (Figure lb) agree well with all three observed quantities. Model calculations with the fast quenching rate
(Figure
lc) produce
N(2D)
densities
that
are
completely
unac-
ceptable: they are roughly 20 times smaller than those ob-served. The NO densities are about 3 times smaller than ob-
served,
while
the N(4S)
densities
are
overestimated
by up to
a factor of 2. The altitude of the peak NO density rises to around 140 km with the fast quenching rate, a location in disagreement with rocket and satellite observations [McCoy, 1983a,b; Cravens et al., 1985; Swider, 1978; Ogawa et al., 1984; lwagami and Ogawa, 1987].Model calculations were also obtained for solar cycle maximum conditions. The simulations exhibit the same gen- eral features as those for solar cycle minimum: as the quench- ing rate is increased, the lower thermosphere NO densities de-
crease,
while
the altitude
of the peak
rises,
and the N(4S)
densities increase, with a pronounced bulge near 100 km.
The N(2D) densities
decrease
to very small
values;
calcula-
tions with the large quenching rate are slightly greater than
10
4 cm
-3, which
is less
than
for the solar
cycle
minimum
case (Figure lc). As for the solar cycle minimum case, the5422
FESEN
ET
AL.:
RAPID
DEACWIVATION
OF
N(2D)
BY
O
250 225 2OO 175 i i i I Ii ii li i i • i II l i i i i•i i Ii I i i i i i i ii
(•",••,"
•
Low
k
0
oX•
-
;
N(4S)
_
/ , 250 225 200 175 150 125 100250 \
225 •
• 200
- I
• 175
A
c
_ A .-,'<r
'
N(4S)
/
100 , , ,,,•,,I ... I ,,, 104 105 106 107 108 DENSITY (cm '3)Fig. 1. Comparison of time-dependent one-dimensional model calcu- lations (solid curves) with AE satellite observations (symbols) from Richards et al. [1981]. Observations made on day 46 of 1974, at
40øm,
1400
LT.
Calculations
made
with
different
values
•fm•2_?)+
O
quenching
rate: (a) low
quenching
rate
of 5.0 x 10
-13
ß (b)
t 12 3 1
medium quenching ra e of 1.0 x 10- cm' s' ; and (c) fast quench-
11 3 1
ing rate of 3.4 x 10' exp(-145/Tn) cm' s' .
model results with the large quenching rate are incompatible with observations.
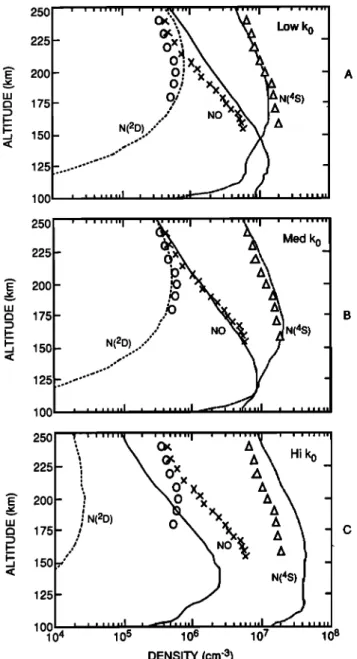
Two-Dimensional Model Results
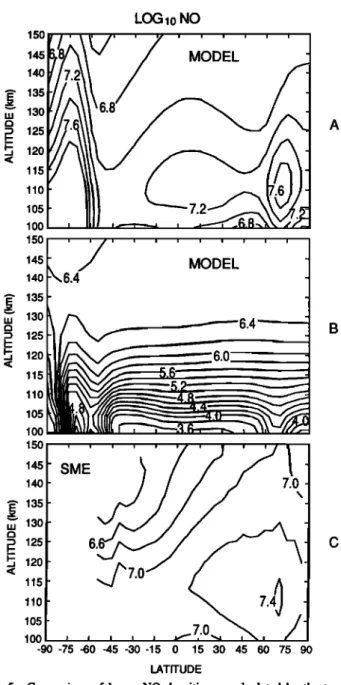
Figures 2a, 2b, and 2c present the NO distribution calcu- lated by the two-dimensional model as a function of altitude and latitude for low quenching, medium quenching, and high
quenching,
respectively,
of N(2D) by O. Recall
that
the
cal-
culations represent solstice, solar cycle minimum conditions during northern summer. For the low-quenching case (Figure
2a), peak
NO densities
of approximately
1-2 x 10⁷
cm
-3 are
found near 110 km over most of the northern hemisphere.
The distribution maximizes in the auroral zone, with densities
in the polar
night
> 108 cm
-3. The large
nighttime
densities
in the lower thermosphere and mesosphere at the south pole appear because, at large solar zenith angles, the photochemi- cal sinks of NO are inoperative. Similarly, the low-altitude summer pole exhibits a NO minimum due to strong predisso- ciation in the NO •5 bands. A minimum in the NO latitudinal
distribution occurs from about 25 ø to 50øS. In the upper thermosphere. near 200 km, the number densities range from
about
5 x 10⁵
to slightly
more
than
2 x 10⁶
cm
-3 from
south
to north poles. The intermediate-quenching case (Figure 2b) has very similar morphology in the upper thermosphere but an appreciable decrease in magnitude of the NO densities near the peak. The peak NO densities are still located near 110
km for the
most
part,
but
now
are
near
5 x 10⁶
away
from
the
poles. The NO densities near 200 km are slightly smaller than those calculated with the low quenching rate.NO densities calculated with the high quenching rate (Figure 2c) differ dramatically from the previous simulations
LOG1o NO 300 • --, • ... •
240
•___•--5.2
. •
"' 200
•6.0
• A_• 180
•6.4-
lSO
,
,
.
300 280 260 240 .• 220 v w 200 i- 180 •, 160 140 120 100 80 300 280 260 240m•'220
200
180160
140 120 100 80 -90 -75 -60 45 -30 -15 0 15 30 45 60 75 90 LATITUDEFig. 2. Two-dimensional model calculations of log 10 NO with (a) low
quenching rate; (b) medium quenching rate' and (c) high quenching
FESEN
ET
AL.:
RAPID
DEACHTVATION
OF
N(2D)
BY
O
5423LOG
lO
N(4S)
300 280 260 240 E• 220 w 200 _ 180 •, lSO 140 120 100 80 300 280 260 240 E• 220 LU 200 I-- 180 •, lSO 140 120 100 80 300 280 260 240 E• 220 LU 200 •- 180 I-; 160 140 120 IO0 80 -SO -75 -60 -45 -30 -15 0 15 30 45 60 75 90 LATITUDEFig.
3. As Figure
2, but
for
log
10 N(4S)
densities.
c
over the entire altitude range of the model. Peak NO densities
of-3 x 10⁶ now occur
near
130-140
km. A deep
hole
ap-
pears in the NO distribution near 90 km, where densities lessthan 104 cm
-3 extend over most latitudes in contradiction
with mesospheric rocket observations indicating NO densities
greater
than
105 cm
-3 (see
Tohmatsu
and lwagami
[1976],
Beran and Bangert [1979], and lwagarni and Ogawa [1980]; data reviewed by Solomon et al. [1982]). In the upper thermosphere, near 200 km, the maximum densities are ev-
erywhere
less
than
106
cm
3.
The model calculations show that the effect of increasing
the
quenching
rate
of N(2D)
by O is a decrease
in the
peak
NO
densities, accompanied by an increase in the altitude of the peak densities. The different quenching rates will also affectthe distributions
of N(4S) and N(2D); these
are shown
in
Figures
3 and
4, respectively.
The differences
in the
N(4S)
and
N(2D) densities
for the low and
medium
quenching
rates
(Figures 3a/3b and 4a/4b) are confined largely to the lowerthermosphere,
as expected.
A faster
N(2D)
quenching
will de-
plete
N(2D) and
increase
N(4S),
leading
to the reduced
NO
densities seen in Figure 2b. For the large quenching rate,however,
the N(2D) densities
(Figure
4c) are seriously
de-
pleted over the entire altitude range of the model: the peakN(2D•)
density
is ,-,6
x 104
cm
-3 near
200
kin,
compared
to 2
x 10
ø in the previous
two simulations.
Conversel•t,
the
N(4S) densities
(Figure
3c) are greater
than
107 cm
-• over
much of the model range, with a southern high-latitudeof densities
greater
than
108 cm
-3. Figures
1 and
3
show that varying the quenching rate causes dramatic differ-
ences
in the N(4S) distribution
from about
100 to 160 kin.
N(4S) measurements
from
100 to 200 km were
presented
by
McCoy
low about 140 kin, with the densities dropping from -10[1983a,
b],
which
show
a rapid
decrease
in
N(4S)7be-
to10
5 or less
at 100 kin. The model
results
with the large
quenching rate (Figures lc and 3c) are not consistent with the McCoy observations.Figure 5 compares the latitudinal distribution of nitric oxide measured by the ultraviolet spectrometer on board the
LOG 10 N(2D)
3OO 280 26O 240 E• 220 LU 200 •- 180 -- 160 140 120 100 80 300 280 260 240 E ß ,, 220 LU 200 •- 180 •, •o 140 120 100 80 300 280 260 240 E ß ,, 220 LU 200 i- 18o •, •6o 140 120 100 80 -90-75-60-45-30-15 0 15 30 45 60 75 90 LATITUDE5424
FESEN
ET
AL.:
RAPID
DEA•ATION
OF
N(2D)
BY
O
LOG •0 NO 150 145 140 135 130125
A
120 115 110 105 100 145 MODEL •4o 6.4•' 130
6.4'-'---.
B
• 125
115
_
.52
r
_
_ -
•00•45
I SME
•40 7.0' 130
• 120
115 105100 , , , , , •.0
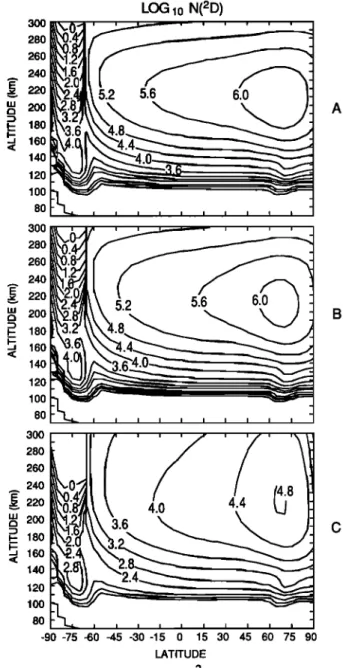
-90-75 •0-45-30-15 0 15 30 45 60 75 90 •TITUDEFiS. 5. C•parison of los •0 NO denskies as calculated by the two- d•ensiona] m•e] and obse•ed by •e S•E sate•ke. (a) two-dimen- sional mode] calculations with low quenchins rate, (b) two-dimen- sisal m•e] calculations wi• fast quenches •te, and (c) S•E oh- sedations averaSed from June 5 throush July 5, •984.
Solar Mesosphere Explorer satellite [Rusch et al., 1984; Barth, 1988] during a solstice period in 1984 (Figure 5c) with the results of the two-dimensional model with the low (Figure 5a) and high (Figure 5b) quenching rates, respectively. The SME data were obtained during the period June 5 through July 5, 1984, comprising approximately 30 orbits. The SME is in a nearly polar circular orbit at 520 kin, obtaining data near 1500 LT. The observations used to produce this map were gathered in the European (45øE longitude) and American (120øW longitude) sectors. The mean Ap magnetic index value was 14, corresponding to a fairly magnetically quiet period, while the average solar F10.7 flux was ~100.
The contours of NO density are plotted as a function of geomagnetic latitude as suggested by Gdrard and N6el [1986]. This method improves the organization of the NO meridional distribution, particularly at high latitudes. The NO distribu-
tion obtained with the two-dimensional model and shown in
Figure 2a and 2c is plotted here on the same scale as the SME observations to facilitate comparisons. Although the model was not "tuned" to match exactly the geophysical conditions of the SME measurements, the main features of the observations are satisfactorily reproduced in Figure 5a (low
N(2D) quenching
coefficient).
The
NO peak
altitude
calculated
with the model is located near 110 km, in good agreement with the SME observations. As with the one-dimensional model results, the calculations done with the fast quenching rate produce NO densities that are clearly inconsistent with
the observations.
The position of the latitudinal minimum in the two-di- mensional model results for low and medium quenching rates is about 30øN of its observed location. Gdrard et al. [1984] showed that this is a function of auroral activity: an increase in the Joule heating and particle precipitation, as occurs dur- ing disturbed periods, will shift the minimum to lower lati- tudes. The model results shown here represent quiet geomag- netic conditions, while the data are averaged over many days covering both disturbed and quiescent periods. Further, the model represents a diurnal average variation of NO, while the AE observations are restricted to daylight hours. It is there- fore not appropriate to attempt an exact reproduction of the satellite observations; their usefulness in this study is to il- lustrate trends rather than absolute values.
DISCUSSION
Satellite measurements of odd-nitrogen densities are very difficult to reconcile with theoretical models if the quenching
rate
of N(2D) by O is as large
as measured
by Jusinski
and
colleagues [Jusinski and Slanger, 1987; Jusinski et al.,
1988]. Even
if the upper
therrnosphere
NO and
N(4S)
densi-
ties could be reconciled with the fast quenching rate by adjusting various reaction or branching rates, the low-altitude NO densities would still likely remain seriously underes- timated. Use of the fast quenching rate in the model calcula- tions cannot simultaneously satisfy both lower and upper thermosphere measurements. In the upper therrnosphere,
N(4S)
is both
a source
and
a sink
of NO. Rapid
quenching
of
N(2D) by O would
eliminate
N(2D) as a source
of NO, while
incteas
ß i g the N(S)n
4
concentration. In the lower thermo-sphere,
N(4S)
is a sink
of NO, while
N(2D)
is a major
source.
A very
fast
N(2D) quenching
rate therefore
implies
both
an
accelerated loss of NO coupled with a greatly reduced produc-tion. Thus,
Figure
lc shows
100-km
NO densities
near
105
cm
-3 which
are incompatible
with
every
measurement
known
near
this
altitude.
Figure
lc also
shows
that
the
N(2D) model
simulations are completely unacceptable in comparison withthe satellite observations. The VAE instrument on the AE satellite routinely measured the 520.0-nm emission from
N(2D), which
would
be far below
the detection
limit of the
instrument if the quenching rate were as large as Jusinski and colleagues suggest. The existence of "hot" N atoms could possibly augment the NO densities in the high-quenching
case,
but the problem
of the very low N(2D) densities
would
remain.
The resolution of this problem requires two efforts. Ad-
ditional,
independent
laboratory
measurements
of the N(2D)+
O quenching rate are clearly necessary. At the same time, there is only one set of simultaneous measurements of NO,
FESEN
ET
AL.:
RAPID
DEACrlVATION
OF
N(2D)
BY
O
5425N(4S),
and
N(2D) for model
comparisons.
Additional
simul-
taneous data on all three constituents are required to validate the conclusions drawn here.
Acknowledgments. The SME satellite data were kindly provided by
Charles A. Barth. We are grateful to the two referees for helpful
comments. This work was supported by NASA grant NAGW-904 to the University of Colorado and NATO Co-operative Research Grant
166/84. J.-C. G. also acknowledges the support of the Belgian
Foundation for Scientific Research (FNRS). The National Center for
Atmospheric Research provided computer time for this project. NCAR is sponsored by the National Science Foundation.
The Editor thanks R. P. McCoy and T. G. Slanger for their
assistance in evaluating this paper.
REFERENCES
Barth, C. A., Rocket measurements of the nitric oxide dayglow, J. Geophys. Res., 69, 3301, 1964.
Barth, C. A., Reference models for thermospheric NO, paper presented at COSPAR Meeting, Helsinki, Finland, 1988.
Barth, C. A., D. W. Rusch, and A. I. F. Stewart, The UV nitric-oxide experiment for Atmosphere Explorer, Radio Sci., 8, 379, 1973.
Becker, K. H., W. Groth, and D. Z. Kley, Z. Naturforschu A, 24,
1280, 1969.
Beran, D., and W. Bangert, Trace constituents in the mesosphere and lower thermosphere during winter anomaly events, J. Atmos. Terr. Phys., 41, 1091, 1979.
Cogger, L. L., J. C. G. Walker, J. W. Meriwether, and R. G. Burnside, F region airglow: Are groundbased observations consistent with recent satellite results?, J. Geophys. Res., 85, 3013, 1980. Cravens, T. E., and T. L. Killeen, Longitudinally asymmetric transport
of nitric oxide in the E region, Planet. Space Sci., 36, 11, 1988.
Cravens, T. E., and A. I. F. Stewart, Global morphology of nitric oxide in the lower E region, J. Geophys. Res., 83, 2446, 1978. Cravens, T. E., J.-C. G•rard, M. LeCompte, A. I. F. Stewart, and D.
W. Rusch, The global distribution of nitric oxide in the thermosphere as determined by the Atmosphere Explorer D satellite, J. Geophys. Res., 90, 9862, 1985.
Dalgarno, A., W. B. Hanson, N. W. Spencer, and E. R. Schmerling, The Atmosphere Explorer mission, Radio Sci., 8, 263, 1973.
Davenport,
J. E., T. G. Slanger,
and
G. Black,
The
quenching
of N(2D)
by O(3p),
J. Geophys.
Res.,
81, 12, 1976.
Ebel, A., Eddy diffusion models for the mesosphere and lower thermosphere, J. Atrnos. Terr. Phys., 42, 617, 1980.
Frederick, J. E., and D. W. Rusch, On the chemistry of metastable
atomic nitrogen in the F region deduced from simultaneous
satellite
measurements
of the 5200--• airglow
and atmospheric
composition, J. Geophys. Res., 82, 3509, 1977.
Garstang, R. H., Transition probabilities in auroral lines, in The Airglow and Aurora, edited by E. B. Armstrong and A. Dalgamo, p. 324, Pergamon, New York, 1956.
G•rard, J.-C., and C. E. N/Sel, AE-D measurements of the NO
geomagnetic latitudinal distribution and contamination by
N+(5S)
emission,
J. Geophys.
Res.,
91, 10136,
1986.
G•rard, J.-C., and R. G. Roble, The role of nitric oxide on the zonally
averaged structure of the thermosphere: Solstice conditions for
solar cycle minimum, Planet. Space Sci., 34, 131, 1986. G•rard, J.-C., and R. G. Roble, The role of nitric oxide on the zonally
averaged structure of the thermosphere: Solstice conditions for
solar cycle maximum, Planet. Space Sci., 36, 271, 1988.
G•rard, J.-C., and C. Taieb, The E region electron density diurnal
asymmetry at Saint-Santin: Observations and role of nitric
oxide, J. Atmos. Terr. Phys., 48, 471, 1986.
G•rard, J.-C., R. G. Roble, D. W. Rusch, and A. I. F. Stewart, The
global distribution of thermospheric odd nitrogen for solstice conditions during solar cycle minimum, J. Geophys. Res., 89, 1725, 1984.
Godefroid, M., and C. Froese Fischer, MCHF-BP fine structure splittings and transition rates for the ground configuration in the nitrogen sequence, J. Phys. B, 17, 681, 1984.
Hays, P. B., G. Carignan, B.C. Kennedy, G. G. Shepherd, and J. C.
G. Walker, The Visual Airglow Experiment on Atmosphere Explorer, Radio Sci., 8, 369, 1973.
Iannuzzi,
M.P., and
F. Kaufman,
Rates
of some
reactions
of N(2D
and
2p) near
300
K, J. Chern.
Phys.,
73, 4701,
1980.
Iwagami, N., and T. Ogawa, An antarctic NO density profile deduced
from the gamma band airglow, Planet. Space Sci., 28, 867,
1980.
Iwagami, N., and T. Ogawa, Thermospheric NO profiles observed at the diminishing phase of solar cycle 21, Planet. Space Sci., 35,
191, 1987.
Jusinski,
L. E., and
T. G. Slander,
Determination
of rate
coefficient
for quenching
N(2D)
by O(oP),
Eos
Trans.
AGU,
68, 1389,
1987.
Jusinski, L. E., G. Black, and T. G. Slanger, REMPI measurements of
N(2D)
quenching
by O(3p),
J. Phys.
Chem.,
92, 5977,
1988.
Kley,
D., G. M. Lawrence,
and
E. J. Stone,
The
yield
of N(2D)
atoms
in the dissociative recombination of NO +, J. Chern. Phys., 66,
4157, 1977.
Lee, J. H., J. V. Michael, W. A. Payne, and L. J. Stief, Absolute rate
of the creation
of N(4S)
with
NO from
196-400øK
with
DF-RAF
and FP-RF techniques, J. Chetn. Phys., 69, 3069, 1978.
Lin, C.-L., and F. Kaufman, Reactions of metastable nitrogen atoms, J. Chem. Phys., 55, 3760, 1971.
McCoy,
R. P., Thermospheric
odd
nitrogen,
1, NO,
N(4S)
, and
O(3p)
densities from rocket measurements of the NO •5 and ¾ bands and the 0 2 Herzberg I bands, J. Geophys. Res., 88, 3197, 1983a. McCoy, R. P., Thermospheric odd nitrogen, 2, Comparison of rocket
observations with a diffusive transport chemical model, J. Geophys. Res., 88, 3206, 1983b.
McFarland, M., D. L. Albritton, F. C. Fehsenfeld, E. E. Ferguson, and
A. L. Schmeltekopf, Energy dependence and branching ratio of
the N2 + + O reaction,
J. Geophys.
Res.,
79, 2925, 1974.
Nicolet, M., and A. C. Aikin, The formation of the D region of the ionosphere, J. Geophys. Res., 65, 1469, 1960.
Norton, R. B., and C. A. Barth, Theory of nitric oxide in the Earth's atmosphere, J. Geophys. Res., 75, 3903, 1970.
Ogawa, T., N. Iwagami, and Y. Kondo, Solar cycle variation of
thermospheric nitric oxide, J. Geomagn. Geoelectr., 36, 317,
1984.
Richards, P. G., and D. G. Torr, Ratio of photoelectron to EUV
ionization rates for aeronomic studies, J. Geophys. Res., 93,
4060, 1988.
Richards, P. G., D. G. Torr, and M. R. Torr, Photodissociation of N2: A significant source of thermospheric atomic nitrogen, J.
Geophys. Res., 86, 1495, 1981.
Ridley,
E. C., R. G. Roble,
and
R. E. Dickinson,
Global
distribution
of atomic nitrogen and nitric oxide calculated by the NCAR
thermospheric general circulation model, Eos Trans. AGU, 68, 1388, 1987.
Roble, R. G., and B. A. Emery, On the global mean temperature of the
thermosphere, Planet. Space Sci., 31, 597, 1983.
Roble, R. G., and J. F. Kasting, The zonally averaged circulation,
temperature, and compositional structure of the thermosphere and variations with geomagnetic activity, J. Geophys. Res., 89, 1711, 1984.
5426
FESEN
El'
AL.:
•
DEAC'FIVATION
OF
N(2D)
BY
O
fluorescence with a diffusive transport model, J. Geophys. Res., 78, 5676, 1973.
Rusch,
D. W., and
J.-C.
G6rard,
Satellite
studies
of N(2D) emission
and ion chemistry in aurorae, J. Geophys. Res., 85, 1285, 1980.
Rusch, D. W., A. I. F. Stewart, P. B. Hays, and J. H. Hoffman, The N
I (5200 ]Q dayglow,
J. Geophys.
Res.,
80, 2300, 1975.
Rusch, D. W., G. H. Mount, C. A. Barth, R. J. Thomas, and M. T.
Callan, Solar Mesosphere Explorer ultraviolet spectrometer:
Measurements of ozone in the 1.0-0.1 mbar region, J. Geophys. Res., 89, 11677, 1984.
Solomon, S., The possible effects of translationally excited nitrogen atoms on lower thermospheric odd nitrogen, Planet. Space Sci., 31, 135, 1983.
Solomon, S., and R. R. Garcia, Transport of thermospheric NO to the upper stratosphere, Planet. Space Sci., 32, 399, 1984.
Solomon, S., R. G. Robie, and P. •. Crutzen, Photochemical coupling
between the thermosphere and the lower atmosphere, 1, Odd nitrogen from 50 to 120 km, J. Geophys. Res., 87, 7206, 1982. Spencer, N. W., H. B. Neimann, and G. R. Carignan, The neutral atmosphere temperature instrument, Radio Sci., 8, 284, 1973. Stewart, A. I. F,. and T. E. Cravens, Diurnal and seasonal effects in E
region low-latitude nitric oxide, J. Geophys. Res., 83, 2453,
1978.
Strickland, D. •., and R. R. Meier, A photoelectron model for the
rapid computation of atmospheric excitation rates, NRL Memo. Rep., 5004, 1982.
Strobel, D. F., D. N. Hunten, and M. B. McElroy, Production and
diffusion of nitric oxide, J. Geophys. Res., 75, 4307, 1970. Swider, W., Daytime nitric oxide at the base of the thermosphere, J.
Geophys. Res., 83, 4407, 1978.
Tohmatsu, T., and N. Iwagami, Measurement of nitric oxide abundance in the equatorial upper atmosphere, J. Geomagn. Geoelectr., 28,
343, 1976.
Torr, D. G., J. C. G. Walker, L. H. Brace, J. H. Hoffmann, A. O. Nier,
and M. Oppenheimer,
Recombination
of NO
+ in the ionosphere,
Geophys. Res. Lett., 3, 209, 1976.
Torr, M. R., and D. G. Torr, Ionization frequencies for solar cycle 21: Revised, J. Geophys. Res., 90, 6675, 1985.
Zeippen,
C. J., Transition
probabilities
for forbidden
lines
in the
2p
3
configuration, Mon. Not. R. Astron. Soc., 198, 111, 1982.
C. G. Fesen and D. W. Rusch, Laboratory for Atmospheric and
Space Physics, University of Colorado, Campus Box 392, Boulder,
CO 80309-0392.
J.-C. G6rard, ]astitut d'Astrophysique, Universit6 de Liege, 4200
Li•ge-Ougr6e, Belgium.
(Received July 12, 1988;
revised November 28, 1988;