Université de Montréal
“WARES”, a Web Analytics Recommender System
par Sedliar Kostiantyn
Département d'informatique et de recherche opérationnelle Faculté des arts et des sciences
Mémoire présenté à la faculté des arts et des sciences en vue de l’obtention du grade de Maitrise
en Sciences et Informatique
Octobre 2017
Résumé
Il est difficile d'imaginer des entreprises modernes sans analyse, c'est une tendance dans les entreprises modernes, même les petites entreprises et les entrepreneurs individuels commencent à utiliser des outils d'analyse d'une manière ou d'une autre pour leur entreprise. Pas étonnant qu'il existe un grand nombre d'outils différents pour les différents domaines, ils varient dans le but de simples statistiques d'amis et de visites pour votre page Facebook à grands et sophistiqués dans le cas des systèmes conçus pour les grandes entreprises, ils pourraient être shareware ou payés. Parfois, vous devez passer une formation spéciale, être un spécialiste certifiés, ou même avoir un diplôme afin d'être en mesure d'utiliser l'outil d'analyse. D'autres outils offrent une interface d’utilisateur simple, avec des tableaux de bord, pour satisfaire leur compréhension d’information pour tous ceux qui les ont vus pour la première fois. Ce travail sera consacré aux outils d'analyse Web. Quoi qu'il en soit pour tous ceux qui pensent à utiliser l'analyse pour ses propres besoins se pose une question: "quel outil doit je utiliser, qui convient à mes besoins, et comment payer moins et obtenir un gain maximum". Dans ce travail je vais essayer de donner une réponse sur cette question en proposant le système de recommandation pour les outils analytiques web –WARES, qui aideront l'utilisateur avec cette tâche "simple".
Le système WARES utilise l'approche hybride, mais surtout, utilise des techniques basées sur le contenu pour faire des suggestions. Le système utilise certains ratings initiaux faites par utilisateur, comme entrée, pour résoudre le problème du “démarrage à froid”, offrant la meilleure solution possible en fonction des besoins des utilisateurs. Le besoin de consultations coûteuses avec des experts ou de passer beaucoup d'heures sur Internet, en essayant de trouver le bon outil. Le système lui–même devrait effectuer une recherche en ligne en utilisant certaines données préalablement mises en cache dans la base de données hors ligne, représentée comme une ontologie d'outils analytiques web existants extraits lors de la recherche en ligne précédente. Mots–clés: Analytique, système de recommandation, moteur de recherche, ontologies.
Abstract
It is hard to imagine modern business without analytics; it is a trend in modern business, even small companies and individual entrepreneurs start using analytics tools, in one way or another, for their business. Not surprising that there exist many different tools for different domains, they vary in purpose from simple friends and visits statistic for your Facebook page, to big and sophisticated systems designed for the big corporations, they could be free or paid. Sometimes you need to pass special training, be a certified specialist, or even have a degree to be able to use analytics tool, other tools offers simple user interface with dashboards for easy understanding and availability for everyone who saw them for the first time. Anyway, for everyone who is thinking about using analytics for his/her own needs stands a question: “what tool should I use, which one suits my needs and how to pay less and get maximum gain”. In this work, I will try to give an answer to this question by proposing a recommender tool, which will help the user with this “simple task”. This paper is devoted to the creation of WARES, as reduction from Web Analytics REcommender System. Proposed recommender system uses hybrid approach, but mostly, utilize content–based techniques for making suggestions, while using some user’s ratings as an input for “cold start” search. System produces recommendations depending on user’s needs, also allowing quick adjustments in selection without need of expensive consultations with experts or spending lots of hours for Internet search, trying to find out the right tool. The system itself should perform as an online search using some pre–cached data in offline database, represented as an ontology of existing web analytics tools, extracted during the previous online search.
Table of content
Résumé ... i
Abstract ... ii
Table of content ... iii
List of Tables ... vi
List of figures ... vii
Acknowledgments... ix
Introduction ... 1
Chapter 1 – State of the art ... 3
1.1– Web Analytics ... 3
1.1.1 – Web Analytics data sources ... 6
1.1.2 – Basic means of data mining of the typical Web Analytics tools ... 7
1.1.3– Key metrics used in typical Web Analytics tools ... 10
1.2 – Basic concepts about recommender systems ... 15
1.2.1– Basic approaches to solving recommendations problem today. ... 20
1.3– Comparative review of some existing Web Analytics tools ... 21
1.3.1 – Google Analytics ... 21
1.3.2 – Open Web Analytics ... 25
1.3.3 – Yandex Metrica ... 26
1.3.4 – Piwik ... 29
1.3.5 – Woopra ... 30
1.3.6 – Summary on comparison of web analytics tools ... 32
1.4 – Conclusion ... 34
Chapter 2 – Methodology ... 35
2.1 – Collaborative filtering approach and possible ways of applications in WARES. ... 37
2.1.1 – Matrix factorization methods applicable to recommendations ... 40
2.1.1.1 – SVD model……..……….……….…….. 41
2.1.1.3 – SVDtime model..……….……….…….. 43
2.1.2 – Neighborhood methods applicable to recommendations ... 44
2.1.2.1 – Rating prediction and classification using standard Neighborhood methods.…46 2.1.3 – Typical similarity measurement methods in recommender systems ... 50
2.2 – Content–based filtering approach and possible ways of applications in WARES. ... 51
2.2.1 – Advantages and disadvantages of the content–based filtering ... 52
2.2.2 – Item representation in the content–based recommender approach ... 54
2.2.3 – Semantic analysis in the content–based recommender systems, using ontologies 57 2.2.4 – Methods for Learning User’s Profiles, applicable to the content–based recommender systems ... 58
2.3 – Conclusion ... 60
Chapter 3 – Structure of the WARES recommender system ... 61
3.1 – Generalized overview about recommender systems structure ... 61
3.2 – Understanding WARES recommender system environment ... 64
3.2.1 – Application model ... 65
3.2.1.1 – Understanding the recommender role in the application……….…66
3.2.1.2 – Understanding the influence of the application implementation……….69
3.2.2 – User model ... 70
3.2.2.1 – Importance of understanding who are the users………...72
3.2.2.2 – Understanding user's motivation, goals and expectations...72
3.2.2.3 – Understanding user’s context...73
3.2.3 – Data Model... 74
3.2.3.1 – Understanding the type of available data to describe items...75
3.2.3.2 – Understanding the quality/quantity of data...76
3.2.3.3 – Understanding the properties of the item set...77
3.2.4 – Summary on Recommender Environment and how it will be used further ... 78
3.3 – Architecture of the WARES recommender system ... 79
3.3.1 – User’s interface ... 80
3.3.2 – Online search and data mining in WARES... 84
3.3.4 – Algorithm for the web analytic tools selection process. ... 92
3.3.5 – Sample script explaining usage of WARES recommender system. ... 94
3.4 – Conclusion ... 96
Chapter 4 – Evaluation and validation of the WARES recommender system ... 97
4.1 – Validation of the WARES recommender system ... 98
4.2 – Evaluation of the user’s experience with WARES ... 101
4.3 – Comparison of the WARES with other well–known systems on the market ... 102
4.4 – Conclusion ... 105
Chapter 5 – Conclusion and future works... 106
List of Tables
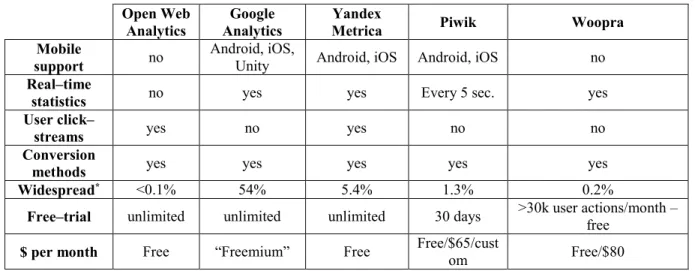
Table 1: Comparative summary of the considered Web Analytics tools... 33
Table 2: The average number of neighbors vs. average number of ratings ... 49
Table 3: The space and time complexity of user–based and item–based neighborhood ... 50
Table 4: General application model components ... 65
Table 5: Application model for the WARES recommender system ... 66
Table 6: General user model components ... 71
Table 7: User model for the WARES recommender system ... 71
Table 8: General data model components ... 74
Table 9: Data model for WARES recommender system ... 75
Table 10: Test participants information ... 101
Table 11: How users rated the system ... 102
List of figures
Figure 1: Basic steps of Web Analytics ... 5
- Figure 2: How HTTP request header displayed in Google Chrome browser ... 6
Figure 3: Example of the log file format in the Apache web server ... 8
Figure 4: Organic (right) vs. non–organic recommendations representation ... 19
Figure 5: Collaborative filtering process ... 20
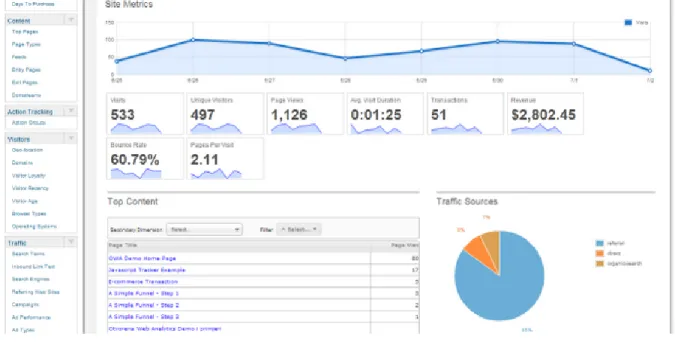
Figure 6: Google Analytics setup ... 22
Figure 7: Google Analytics tracking ID and tracking script ... 23
Figure 8: Google analytics results for 1 month ... 23
Figure 9: Open Web Analytics dashboard ... 26
Figure 10: Yandex Metrica dashboard ... 27
Figure 11: Piwik dashboard demonstrating Russian interface ... 30
Figure 12: Interface of the Woopra main application window ... 32
Figure 13: Two documents with terms ... 56
Figure 15: Architecture of the content–based recommender system ... 62
Figure 16: Recommender system in its environment ... 64
Figure 17: Architecture of the WARES recommender system for web analytic tools ... 80
Figure 18: the WARES recommender settings 1 ... 81
Figure 19: WARES recommendation settings 2 ... 82
Figure 20: WARES recommendations results ... 83
Figure 21: Search cycle "Filling the ontology" ... 86
Figure 22: Class hierarchy for "web analytics tools" ontology ... 89
Figure 23: Properties defined for "web analytic tool" class ... 91
Figure 24: Example of an instance of the class "web analytic tool" ... 92
Figure 25: MAE comparison ... 99
Figure 26: Average MAE interpretation ... 99 Figure 27: Time to complete recommendation process with different bandwidth allocation. 100
List of acronyms
CBF – Content–based Filtering CF – Collaborative Filtering CPU – Central Processing Unit DNS – Dynamic Names System EU – European Union
GA – Google Analytics GPL – General Public License HTTP – Hypertext Transfer Protocol
IMDB – Internet Movie Database, http://www.imdb.com/ IT – Information Technologies
KPI – Key Performance Indicator MAE – Mean Absolute Error OS – Operating System OWL – Web Ontology Language PC – Personal Computer
PDF – Portable Data Format by Adobetm corporation PHP – Personal Home Page scripting language pLSA – probabilistic Latent Semantic Analysis REST – Representational State Transfer RMSE – Root Mean Square Error
ROI – Return of Investment RS – Recommender System
SVD – Singular Vector Decomposition TCP – Transfer Control Protocol
TF–IDF – Term Frequency – Inverse Document Frequency URL – Uniform Resource Locator
W3C – Word Wide Web Consortium WWW – World Wide Web
XML – Extended Markup Language YM – Yandex Metrica
Acknowledgments
First and above all, I would like to thank my supervisor, Ph. D. professor Esma Aïmeur of the Department of Computer Science and Operational Research at University of Montreal. Without this woman, this thesis would have been impossible to accomplish, not only because of her help and guidance, but also because of her fate in me. I took a very slow start, I changed the topic, I made mistakes, I had psychological problems with concentration. However, she never gave up on me, she was always friendly during our weekly "team" presentations. Friendly and at the same time strict and serious. I would like to thank her from all my heart!
In addition, I would like to thank Zakaria Sahnoune, who is a Ph. D. student with Esma. He was kind to me and helped several times with advices on my topic, and gave me some general, but useful tips on how to structure and formalize my thesis.
Also I would like to thank Mouna Selmi, she defended her Ph. D. with Esma just before me, and she also helped me several times with useful tips on my topic.
Introduction
In this thesis, I will present a recommender system for making suggestions about the Web Analytics tools, which I called WARES, short from Web Analytics REcommender System. This system intends to help its users in the selection of “appropriate” web analytics tools, for whatever their personal criteria are.
Problematic
Many problems in the field of recommender systems are already solved, but for particular recommender systems, not in the whole field of recommender systems e.g. in movies, recommendations exist IMDB. In sales exist Amazon and eBay, this system works pretty well, because they already have databases in their specific areas, this data allows them to make recommendations using content–based approach, and they also have many users, which simultaneously permits making suggestions based on collaborative filtering approach. In this paper we will consider the design process of the recommender system, which does not have lots of users. The WARES is intended for a single user, who needs particular web analytics tool, which satisfies his/her particular needs. In this case the best solution for the WARES will be an implementation of the content–based filtering approach. During the development of the WARES we also faced the main issue for the most recommender systems – the “cold start problem” (when recommender system cannot produce recommendations for users or items about which it has not yet gathered “enough” information). To make reliable recommendations the system should have a lot of ratings data for items, but this data comes from a large number of users, which we do not have, which in its turn does not allow us to implement collaborative filtering approach. Another existing problem is constantly changing source data, meaning that to produce a relevant recommendation the system needs “fresh” data, because nobody wants to see irrelevant “expired” recommendations, that is why the proposed recommender system should be, in some way, always aware about web analytics tools on the market. That is why was considered to use an online search, also was considered that WARES should have an ontology for storing data about existing web analytics tools and constantly update this ontology between
user’s requests. There is also a flexibility problem, because users have a trend always changing their own preferences, that is why WARES should somehow envisage this, allowing user to change search criteria. An algorithm for making suggestions is needed. A very urgent problem in the Internet space to date is privacy. In WARES privacy problem is solved, because the system does not store any personal data about active user, there is no user database with real names or credit card numbers, e.g. like in Netflix or eBay. Because in the proposed recommender system exists only one abstract user, without any personal information, all the data about web analytics tools, which was found during the recommendation process and some data about user’s preferences are stored in the ontology, on user’s computer.
Contributions
WARES share many features with existing recommender systems, however WARES adds some novelty in an existing variety of recommender systems. First, it is unique on its own, because it exists several recommender systems about music, movies, consumer goods, however, to the best of my knowledge, there is no such a system for the web analytics. This paper also will present the brand new ontology developed specifically for the domain of web analytics, as well as an algorithm for making recommendations and the algorithm will share adopted features from existing algorithms, in the field of recommender systems.
Plan of this thesis
This thesis is structured as follows: in the first chapter, will be defined basic concepts of the web analytics, and basic notions about recommender system, examples and a short comparison of some most popular existing web analytics tools on the market. In the second we will consider and compare collaborative and content–based algorithms and methods, and possible ways to use these techniques into the WARES. The third chapter describes the structure of the WARES: user’s model, application model, data model, ontology, user’s interface, and briefly describes how WARES works altogether. The fourth chapter is the validation and a brief comparison of the WARES to some well-known recommender systems on the market. The fifth chapter will conclude this paper, summarizing what was done and possible future works.
Chapter 1 – State of the art
In this chapter, will be describe the domain of “Web Analytics”, what is it and what it consist of. Before starting developing WARES recommender system, a preliminary study about recommender system as a notion should be done, to understand it. Basics will be explained about recommender systems, how they works in general and what tasks they pursued, different approaches to the solution of the recommendations problem. Finally, in the end of this chapter examples of existing web analytics tools will be shown, with a summarizing table comparing their important features.
1.1 – Web Analytics
“Web analytics” is not a simple discipline, it is a complex of technologies and methods allowing collection, measurement, analysis and reporting of websites and web application data in order to understand, improve and optimize their performance [Zheng and Peltzverger, 2015]. Today, web analytics is used for different purposes, including marketing, traffic monitoring, information architecture, e–commerce optimization, advertising, web development, web–based campaigns, website performance improvement, etc. Here are some fundamental areas where web analytics is used:
- Improving performance and identification problems in web applications: web page loading metrics such as average page load time by the browser and geographic location are used for measuring website’s performance. Analysis of the real-time load allows detecting and investigate problems concerning website’s performance, e.g. by optimizing the size of downloadable images or modifying HTTP headers used for caching of the website content. Web analytics metrics, e.g. click path, might also help to detect website errors, such as user’s clicks on links leading to incorrect or “blank” URL. For the developers of the web applications, web analytics could be applied for detection of the code errors connected with website interactions.
- Improving website (application) design and user experience: by modifying existing website appearance, e.g. changing the order of presented content and its visual representation to the end-users, thus improving navigation convenience and layout, or by analyzing clickstream information predicting the “best” positions for ads. banners. Using web analytics feature called “heat map” could help to identify user’s degree of interest and attention to the certain areas of the website, which is again very important while placing ad banners or key buttons like “buy it now”, “sign in”, “register”, etc. - Tracking and measuring success of actions: activities such as online commercial
campaigns, and polls need to be somehow measured, web analytics helps to cope with
this by tracking a wide variety of traffic sources, marketing channels, and visitor types. In these campaigns, an important common question is “how and where participants found that information?” Common traffic source metrics used in web analytics allows us to answer this question very precise, by tracking direct traffic from user’s emails, browser, social media and mobile devices, if not used anonymizers like Tor browser or multiple virtual private networks.
- Optimizing e–Commerce and improving e–CRM (customer relationship management): by analyzing different data about previous customer’s interactions with website thus improving business relationships with customers, targeting on customer retention and ultimately driving sales growth. Web analytics greatly helps to analyze usage of website date and content, allowing achieving different goals, e.g. increase spending time in social networks by reducing “bounce rate” of users, increase traffic capacity through certain websites for achieving maximum revenue from advertisements, or improve sales increase by helping to detect the most popular products.
Historically, web analytics techniques usually are separated into two major categories:
on–site and off–site web analytics. On–site web analytics refers to data collected on the current
site, it is used to effectively measure many aspects of direct user–website interactions, such as
number of visits, click path, time on site, etc. Off–site analytics are usually offered by third party
companies with using external web log storages, e.g. on the side of service provider or any other host. However, this meaning is quite blurred, mainly because of vendors providing tools that
span both categories. Many different vendors, e.g. Google Corporation with its Google Analytics, provide on–site web analytics software and services.
Figure 1: Basic steps of Web Analytics [Clifton, 2010]
It exists many ways to implement web analytics process, but in common sense, they are all the same sequence of actions, typical basic steps in web analytics is shown in figure 1. [Clifton, 2010] let us consider those four essential steps:
- Collection of data: collection of the basic elementary data, usually, this data is counts of some things e.g. visits, clicks. The objective of this stage is just to gather raw data for further processing.
- Processing of data into information: on this stage, usually making counts and makes
ratios. The objective of this stage is to take the data and transform it into information,
which is in most cases called “metrics”.
- Developing of KPIs: this stage focuses on using collected ratios and counts, and express them as a business solutions and strategies, referred to as Key Performance Indicators or KPIs.
- Formulating online strategy: reaching business effectiveness in online goals, objectives, and standards for the organization or business, these strategies usually related to making money, saving money, or increasing market share.
Each stage impacts on the following stage or can affect on the preceding stage or follow it. For example, sometimes specificity of the data available for collection affects the online strategy and the online strategy affects the data to be collected.
1.1.1 – Web Analytics data sources
Data for web analysis can be gathered from surveys, market reports, competitor
comparison, public information, etc. but mainly the data comes from four data sources [Hu and
Cercone, 2004] categorized into following types:
- Direct HTTP data traffic: is the user browser passing a web session or visit, which is started without a referer (HTTP header field that identifies the address of the web page). By checking the referrer we can see where the request is originated. An example of the typical HTTP request message is shown in figure 2. An HTTP request consists of a request command shown in the first line and HTTP headers.
- Application level data sent with HTTP requests: data generated and processed by application-level programs, such as JavaScript, PHP, and ASP.Net, it is usually embedded into HTTP requests. It includes “Session” data, which identifies client interactions with the website. Session data usually sent as URL parameters or session cookies. They are very important for calculating metrics like the number of visits, time
on site, the number of page views per visit, etc. “Referral” data can be used to analyze
traffic levels from expected and unexpected sources, or to gauge channel effectiveness in advertisement tracking.
- User action data: it is mostly keyboard and mouse actions made by users, e.g. user’s input of search parameters, and mouse actions like cursor coordinates, movements, clicks. It also includes application specific action such as playback of video or audio, bookmarking, etc. User action data also includes device specification information, e.g. display resolution, CPU model, or any other information about user’s settings not restricted by security policies.
- Network level and server generated data associated with HTTP requests: this data is not a part of the HTTP request, but it is required for successful request transmissions. Most of this information is exchanging on the TCP/IP level, thus hidden from the user and logged by the web server. Server generated details used for internal reference and recorded in the server log files. The log file, typically, records transferred files size, transfer time, server IP, request ID, etc.
- External data: any other data gathered during user activities on the web site, like registration, search history, income from advertisement traffic, etc. This is any data, which can be associated with a specific web page. This data could also come from the indirect indicators, e.g. geo-location, revenue generated by the web site, various data gathered by the third party data providers.
1.1.2 – Basic means of data mining of the typical Web Analytics tools
There are three major methods: web server logging, page tagging, and the most recent method – the application logging. The first and the oldest method for data collection is the web server logging, appeared at the same time when World Wide Web was invented. This method is based on data collection on the server’s side, where the web site is hosted, it records HTTP headers and some of the server’s activities into a textual log file, typically they are: server IP,
date and time, HTTP request command, response status, and response size, e.g. a common log
file implemented using Apache Web Server version 2.2 is shown in figure 3.
Additional information, such as HTTP headers, process id, scripts, request rewrite, etc. can be logged in numerous proprietary formats, called the “Extended log file format”. After emerging of the first web crawlers and search “bots” along with web proxies and dynamically
assigned IP addresses for large companies and ISPs, it became more difficult to identify unique human visitors on the website.
Figure 3: Example of the log file format in the Apache web server
Log analyzers responded by tracking visits with cookies, and by ignoring requests from known web crawlers. The use of web cache also makes a problem for log file analysis, because if users revisits a page, the second request will be retrieved from the browser's cache, and logging web server will receive no request. This means that the user's path through the site is lost. Caching can be passed by configuring the web server, but this can result in reduced performance for the users and increased calculation load on the server side, which is undesirable or even inacceptable in some cases. Today log file analysis has its own advantages, such as:
- No changes to the website required: each web server normally already produces log files, so the raw data is already available.
- Privacy and security: all the data are stored on the company's own servers and is a standard, rather than a proprietary format, which makes it easy for a business to switch web analytics software if needed, facilitating the use of the different software.
- Log files: contain information on visits from the search engines, which generally do not execute any logging scripts on the web page, and therefore is not recorded by the page tagging. Although these actions should not be reported as part of the human user’s activity, but it might be a useful information for the search engine or traffic analysis. - No additional DNS lookups or TCP slow starts: there is no external server calls, which
can slow down web page load speed, or result in uncounted page views.
- Transactions: the web server records every action it makes, e.g. playing video files and content generated by scripts hosted on the web page, and does not rely on the visitor’s browser actions.
- Local performance: log file analysis usually performed locally, which means the owner somehow need to manage this growing data by his/her own means, which makes additional load on the IT department.
- Software purchase: company needs to purchase log file analysis software, which imposes some limitations because vendors may introduce maximum annual page view limit with additional costs to process additional information. In addition to commercial offerings, several open–source log file analysis tools are available free of charge. - Data storage: to perform log file analysis, a company has to store and archive its own
data, which increases in volumes dramatically and very quickly, resulting in purchasing more storage space. In recent years, cost of the hardware dropping each year, but costs connected with the maintenance of the IT personnel, responsible for hardware servicing, is rising.
- Maintenance: for the log file analysis, the company needs to maintain logging software, including updates, security patches and of course cost for the IT department supporting the system.
Web page tagging is the second and more recent method, which uses client-side programs such as embedded scripts, browser add–ons and plug–ins. Page tagging de facto has become a standard in the modern web analytics. For example, using tracking method with JavaScript, a piece of JavaScript code is embedded in the web page and tracks different user’s activity, storing information in the cookie files. Then information is sent to a processing server, which might be not the same server that hosts tracked web site, e.g. the most widespread web analytics software - Google Analytics and open-source Open Web Analytics actively uses page tagging technology. For many companies and individuals, it has become a major type of usage of their web data collections. General advantages of the page tagging are:
- Instant start: page tagging statistics is activated by opening the web page in user’s browser, indicating that the web client runs the tagging scripts. If the web page is cached, the server will not count it, because cached pages can constitute a considerable part of all page views.
- Data: is gathered via the “tag” component on the page, usually written in JavaScript, though Java, ASP.NET or Flesh can be used instead. Ajax (a set of Web development
techniques using many Web technologies on the client side to create asynchronous Web applications) can also be used in conjunction with a server–side scripting language, such as PHP, to manipulate and store data in the database, enabling complete control over how the data is represented.
- Script: may have access to the additional information about Web client or user, which is not sent in the query, e.g. user’s screen resolution or prices for goods he/she purchased. - Page tagging: can report on events, which do not involve a request to the Web server, such as interactions within Flash movies, partial form completion, mouse events, such as onClick, onMouseOver, onFocus, onBlur etc.
- Cookies: page tagging service manages the process of assigning cookies to the visitors, with log file analysis, but the server has to be configured properly in order to do this. - Availability: page tagging is available to companies and users who do not have their
own web servers.
The third method of data collection is called application level logging. In recent times, it has gained wide popularity due to extreme usefulness for the marketing research. Application level logging is closely connected with an application, making it a functional feature of the application itself. This extends possibilities of the traditional web analytics, which now focuses not only on generic HTTP requests and user’s actions. The web application can be anything from a small retail shop to a big social networking service. Each of these applications now has its own unique data, e.g. user's registration information, product prices, metadata, etc. that data is collected beyond generic web requests but by user’s actions. For example, Microsoft SharePoint 2010 provides framework specific analytics data, like usage of templates and web parts.
1.1.3 – Key metrics used in typical Web Analytics tools
It exists many metrics, which are used for the web analysis. Each software package could have its own metrics, next will be considered only the most commonly used ones [Kaushik, 2009] and those, which will be used in the WARES recommender system:
- Hit: a request for a file from the Web server. The number of hits received by the website is frequently cited to assert its popularity, but the total number of visits or page views provides a more realistic and accurate assessment of popularity.
- Page view: a request for a file, or sometimes an event such as a mouse click, that is defined as a page in the setup of the web analytics tool.
- Event: a discrete action or class of actions that occurs on the website. A page view is a type of event. Events also encapsulate clicks, form submissions, key press events, and other client–side user actions.
- Visit/Session: a visit or a session defined as a series of page requests or in the case of tags, image requests from the same uniquely identified client. A unique client is commonly identified by the IP address or a unique ID that is placed in the browser’s cookie. Data collectors and analysis tools have no reliable way of knowing if a visitor has looked at other sites between page views; a visit considered “a single” visit as long as the events such as page views, clicks, whatever being recorded, are within 30 minutes or less interval. Note that a visit can consist of one page view, or thousands. A unique visit's session can be extended if the time between page loads indicates that a visitor has been viewing web pages continuously.
- First Visit/First Session: or “Absolute Unique Visitor”, in some web analytics tools. A visit from a uniquely identified client that has theoretically not made any previous visits. Note that the first visit label is not reliable if the site's cookies have been deleted since their previous visit.
- Visitor/Unique Visitor/Unique User: the uniquely identified client that is generating page views or hits within a defined time period, e.g. day, week or month. A uniquely identified client is usually a combination of a device and a browser. The identification is usually via a persistent cookie that has been placed on the device by the site page code. - Repeat Visitor: a visitor that has made at least one previous visit. The period between
the last and current visit called visitor “recency” and is measured in days.
- Return Visitor: a unique visitor with activity consisting of a visit to a site during a reporting period and where the “unique visitor” visited the site prior to the reporting period. The individual is counted only once during the reporting period.
- New Visitor: a visitor that has not made any previous visits.
- Impression: the most common definition of “Impression” is an instance of an advertisement appearing on the viewed page, but most measures of impressions do not necessarily mean an advertisement has been viewed.
- Single Page Visit/Singleton: a visit in which only a single page is viewed or a “bounce”. - Bounce Rate: the percentage of visits that are single page visits.
- Exit Rate / % of Exit: a statistic applied to an individual page, not a website. The percentage of visits seeing a page where that page is the final page viewed in the visit. - Page Time Viewed/Page Visibility Time/Page View Duration: the time a single page
or a blog, Ad Banner, was viewed. On the screen is measured as the calculated difference between the time of the request for that page and the time of the next recorded request, note that if there is no next recorded request, then the viewing time of that instance of that page is not included in reports.
- Session Duration/Visit Duration: an average amount of time that visitors spend on the site each time they visit. This metric can be complicated by the fact that analytics programs cannot measure the length of the final page view.
- Average Page View Duration: an average amount of time that visitors spend on an average page of the site.
- Active Time/Engagement Time: an average amount of time that visitors spend actually interacting with content on the web page, based on mouse moves, clicks, hovers and
scrolls. Unlike Session Duration and Page View Duration/Time on Page, this metric can
accurately measure the length of engagement in the final page view, but it is not available in many analytics tools or data collection methods.
- Average Page Depth/Page Views per Average Session: page depth is the approximate “size” of an average visit, calculated by dividing the total number of page views by the total number of visits.
- Frequency/Session per Unique: it measures how often visitors come to a website in a given time period. It is calculated by dividing the total number of sessions or visits by the total number of unique visitors during a specified time period, such as a month or year. Sometimes it is used interchangeably with the term “loyalty”.
- Click path: the chronological sequence of page views within a visit or a session. - Click: a single instance of user’s action following a hyperlink from one Web page to
another.
- Site Overlay: report technique in which statistics of clicks or hot spots are superimposed, by physical location, on a visual snapshot of the web page.
The common type of analysis, which could be performed by most modern web analytics tools, are the dimensional analysis, which involves metrics described above, and other derived metrics, aggregated at the different levels. For example, we can use dimensional analysis to answer the question: “how many visits per month, per day, per period?”. Dimensional analysis is the fundamental part of other analysis types and reports. The other most common types of analysis are:
- Trends analysis: overlooks the data along the time dimension and shows the chronological changes of the selected metrics. For example, the data can show how the percentage of the mobile client access has changed for the past two years.
- User interest/attention analysis: is an “internal” page analysis, which analyzes user’s attention to certain web page details during the browsing process. It uses embedded script to track user’s mouse movements and actions, and shows results in a form of a color matrix or “heat map”, where “cold” areas colored in blue or purple indicating a low level of attention and “hot” color areas such as orange and red indicating a high level of user’s attention. It can also show how far down visitors scroll the page. Analysis of “popularity” areas of attention helps to develop content placement strategies. For example, it could help to determine where the advertisement should be placed to have the most attention from the users.
- Cohort analysis: is a subset of behavioral analytics that takes the data from a given dataset, e.g. an e–commerce platform, web application, or online game, and rather than looking at all users as one unit, it breaks them into related groups for analysis. These related groups called cohorts, usually share common characteristics or experiences within a defined time–span. Cohort analysis allows a company to see patterns “clearly” across the life cycle of a customer (user), rather than slicing across all customers blindly without accounting for the natural cycle that a customer undergoes. An example of the
cohort analysis is an owner of the online store, who may only be interested in customers who signed up in the last two weeks and who made a purchase, in this case, this group of users is an example of a specific cohort.
- Distribution analysis: explains metric values by building various charts and count tables. Values are usually calculated as percentages of the total by one or more dimensions. It is often used to analyze the number of visitors per period and distribution of preferences in client profiles. For example, the percentages of visits from the different time zones per month may give information about clients shopping habits. Other commonly used dimensions for this type of analysis are: geo location, operation system version, device type, referral source, etc.
- Clickstream analysis: also called a click paths, it analyzes the navigation path of the user through a website. A clickstream is a list of actions for all web pages viewed by a user, represented in the viewing order. Applying clickstream analysis may help to improve website’s design and overall usability.
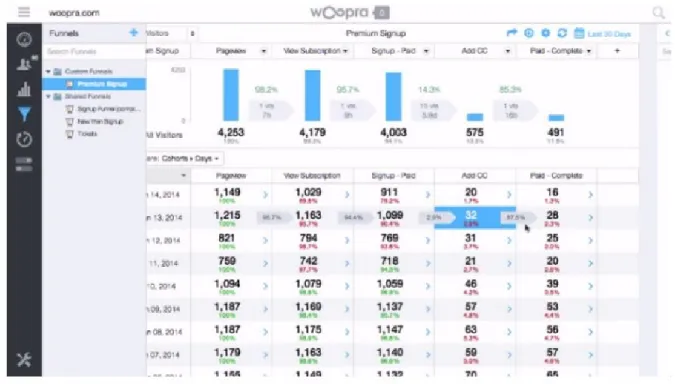
- Funnel Reports: using a series of events that lead towards a defined goal, e.g. from user’s engagement in a mobile application to a sale in an e–commerce platform or advertisement to purchase in online advertising. The funnel analyses is an effective way to calculate conversion rates on specific user behaviors. This can be done in the form of a sale, registration, or other intended action from an audience. The origin of the term funnel analysis comes from the nature of a funnel where individuals will enter the funnel, yet only a small number of them will perform the intended goals.
- Conversion analysis: is one of the key analyses in e–commerce and other sectors. The conversion rate is calculated by dividing the number of completed targeted actions, e.g. purchases, by the number of unique users visited the site. All web analytics providers strive to improve conversion tracking. For example, Google Analytics provides reports that show what campaigns, sources, or channels have contributed to a visitor's multi– visit conversion.
- Performance analysis: helps to reveal website performance issues, such as loading time or linking errors. For example, after a website redesign, indirect traffic volume needs to be watched. If there is less indirect traffic, then some links from other sites and/or bookmarks were potentially broken after the redesign.
- Engagement analysis: is one of the most frequently used analyses in the industry. It measures the following factors: “how many pages were visited per session?”, “what is the duration of a visit?”, “how often new visitors become returning visitors?”, “how often visitors return to the site, term loyalty?”. The goal of the visitor engagement analysis is to find out why the multitude of operations performed on a website did not end in conversion.
1.2 – Basic concepts about recommender systems
The typical definition of the Recommender System, as was described by Peter Falk [Falk, 2015] - a system that applies data mining techniques and some prediction algorithms in order to predict user’s interest on certain items, information, products or services among the tremendous amount of the similar items available on the market. In modern reality, the vast growth of information on the Internet adds new challenges for recommender systems, which are: producing accurate recommendation, coping with huge amounts of data, handling many recommendations efficiently with the growing number of participants in the system. Each recommender system has its own unique structure, but most features are shared between every recommender system. It was proposed using the following dimensions to describe a recommender system: Domain, Purpose, Context, Personalization Level, Whose Opinions,
Privacy and Trustworthiness, Interfaces, Recommendations Algorithms [Falk, 2015].
- Domain: is the type of content, which will be recommended. For example in the IMDB, it is movies, series and actors, but it can be anything: cars, e–learning courses, job listings, food, books, hotels, etc. in the case of WARES it is web analytics tools. Domain is an important because it provides hints on what would you do with recommendations. - Purpose: defines why the recommender system was created and the goals which it
pursues. For example, a typical end–user’s purpose of the eBay recommendations is to find a product that user wants to buy. The purpose for the recommendation provider (eBay) is ultimately to make customers pay for their purchases by having a certain % of the final purchase price. Another example of a purpose is to give an information or to help, to entertain, to educate the user, but in most cases, the purpose is - to sell more. In
the case with WARES the purpose is to give a single or few recommendations for the user that typically arrives once or a few times and expects a “good” recommendation. - Context: is the environment in which the consumer receives a recommendation. For
example, Netflix delivers service on many different platforms. The device, which customer is using is the context. The context is also could be the current location of the user, what time it is, and what the user is doing. Does the user have time to study the suggestions or a quick decision is needed? Context could also be the weather around the user. Consider a search for a restaurant using Google Maps. Is the user sitting at home and looking for a good restaurant or he is standing on the street and it just started raining? In the first scenario, the best response would be about good quality in a bigger radius, while in the second scenario, recommendations would ideally contain only the nearest place where you can drink and eat while the rain passes. In the case of WARES the context of the recommendation expected to be an office or home place, so the user will have some time before taking the final decision.
- Personalization: recommendations can come at many levels of personalization, from using basic statistics to looking at individual user’s data, three levels of personalization could be highlighted:
a) Non–personalized: a list of the most popular items is considered non–personalized recommendations: it is expected the current user might like the same items as most others do. Non–personalized recommendations also include showing things on sale or ordering items by date, such as showing the lowest price items first. Everybody who interacts with the recommender system receives the same list of recommendations, e.g. if user visiting Amazon.com as not registered (anonymous) user Amazon shows (recommend) items that are currently viewed by other users.
b) Segment–personalized: is when you divide users into groups. There is many different ways to segment users. It can be done by age, by nationality, by specific patterns, such as entrepreneurs or students, car drivers or bike cycle riders. Example of segment– personalization can be a concert ticket selling system that would recommend concerts based on the country or city. If user listening music using a smartphone, the system might try to deduce whether a person is out for exercising, by using the GPS and seeing that, the device is moving. While if it is stationary and considered as “at home”, then the
consumer is probably sitting on the sofa and the relevant music might be different, the recommender system does not know anything personal about you as a person, only as a member of a group. Other people who fit into the same group will get the same recommendations.
c) Personalized: a recommendation, which is based on the data about current user. Based on how the user interacted with a system in the past, as well as data on other forms of user’s behavior. This will generate recommendations specifically for this user. Most recommender systems using segments and popularity when creating personalized recommendations. For example, if a user looking for car parts at the bottom part of the web page of each eBay’s auction you can see a section “More Parts for your vehicle”, it is a personalized recommendation. Netflix is an extreme example of personalized, it will apply different types of recommendations, but so far, there are only a few examples like Netflix where everything is personalized. On YouTube you will see the list of videos, which is recommended based on your list of previously viewed videos. In the WARES given recommendations will be non–personalized.
- Whose options: in other words the area of experts, popular feature used on many websites in the past, for example “Canadian Tire recommends this brand of tires for your vehicle”, but is rarely used nowadays. Majority of the recommender systems integrated into websites now uses the opinion of the “masses”. In the past were expert systems, where pre-recorded variants from some experts was combined to recommend products such as wines or books, where it was, “accepted” that someone should be an expert to understand what is “good”, but modern recommender system, has no specific experts who decide, an algorithm representing opinion of the “masses” does all the work. - Privacy and trustworthiness: nowadays it is a serious concern! How well does the
system keep user’s personal data, how the collected information is used, how it is stored, etc.? The privacy is most likely the question of security measures, taken by recommender system owners, for storing personal user data complying with local laws about user’s data. Another aspect is trust, for example, it is quite common that you will have to pay money for your pension plan, which is handled by commercial banks. Often these banks will have different kinds of retirement savings schemes. A system, which should recommend these options, should have very strict rules for privacy. Imagine a user,
filling some data to get a pension plan recommendations, and describing that he has back problems, and a minute later receiving a phone call from a chiropractor with great offers to handle your exact problem. Or even worse, you buy a special bed for people with backbone problems, and an hour later, you receive an email that your health insurance premium has gone up. Many people think that recommendations are manipulation, because they present choices that a customer is more likely to pick than if they were offered as a random selection. Most shops are trying to sell more, so the fact that some shops are using recommendations to sell more makes people think that they are being manipulated. In fact, any form of filtering is a manipulation, but if that means watching a film that would entertain rather than bore, then it is okay. The trustworthiness is about how much the consumer will trust recommendations instead of considering them as commercials or attempts to manipulate them, it means if a user takes recommendations seriously, the system could be considered trustworthy. In WARES trustworthiness cannot be measured for several reasons: it is new, nobody except me tested it, the system has no intention to store any personal user’s data, like names, addresses or credit card numbers, only certain survey data about user’s needs in web analytics, which could be deleted after session ends.
- Interface of the recommender system is considering what kind of input and output it will produce. For example, Netflix enables the users to enter taste preferences by rating content, and add preferences on genres and topics. Netflix outputs recommendations in many ways. Netflix estimates predictions, they provide personalized suggestions, they show popular items, which normally is shown in the form of a “top 10”, but Netflix even personalizes that. It also provides suggestion based on the content you watch. Types of output could be predictions, recommendations or filtering. If the recommendations are integrated as a natural part of the page, it is called organic presentation. The rows shown on the Netflix website are a good example of the organic recommendations, they do not seem like a recommendations, it looks like an integral part of the web site; while the recommendations shown on Amazon are considered as non–organic personalized recommendations, and are shown in the field “Customers who bought this…”. Example of organic and non–organic recommendations is shown on the figure 4. The WARES is
designed to be a web application, it means the user could use WARES via his/her favorite web browser and will receive non–organic personalized recommendations.
Figure 4: Organic (right) vs. non–organic recommendations representation
- Algorithms: there are essentially two groups of them, based on what data the one uses to make recommendations. Algorithms that uses the user’s data are called collaborative filtering. Algorithms that uses content metadata and user profiles to calculate recommendations are called content-based filtering, more detailed they will be considered in the next section and in the chapter 2.
Some recommender systems will try to explain given recommendations, which is called the white box recommenders. For example, Amazon shows following text “Customers who bought this item also bought…”, which could serve as an explanation why this item was recommended to you, while recommender systems which do not try to explain are called the
black box, e.g. Netflix just showing covers of recommended movies, without any explanations.
Examples of such cases are shown on the figure 4. This is important to consider, when choosing the algorithm, since not all of them provide a clear path back to a reasoning in the prediction process. Deciding whether you want to produce a white box recommender or black box is quite important, since it can put quite a lot of restraint on which algorithms you can use and it also affects the level of the trustworthiness for your recommender system. The less your system needs to explain the more simple the algorithm will to be. The WARES will implement some of the white–box features.
1.2.1 – Basic approaches to solving recommendations problem today.
There are two major groups of algorithms, differing from each other by the data they are using to produce recommendations. Group of algorithms that uses collected data of user’s behavior are called collaborative filtering. Algorithms that use data from the description of the item and from the user's profile preferences are called content–based filtering.
Collaborative filtering: a set of methods which are based on collecting and analyzing a large amount of information on users’ behaviors, activities or preferences and predicting what users will like based on their similarity to other users. Figure 5 illustrates a simple way of collaborative filtering process. The outer set is the full catalogue. The middle set is a group of users, which consumes similar items. A recommender system will now recommend items from the “segment of user’s preferences” set, assuming that if users liked the same items as the current user, then a current user will also like other items in this group. This means that a current user is matched with other users. Then a gap of content, which the current user is missing, will be recommended, i.e. the part of the “middle sized” set which is not covered by the set representing what the current user likes. Collaborative filtering is based on the assumption that people who agreed in the past will agree in the future, and that they will like similar kinds of items as they liked in the past.
Many algorithms are used for measuring user similarity or item similarity in recommender systems. For example, the k–nearest neighbors (k–NN) approach and the Pearson
Correlation, see chapter 2 for details.
Content based filtering: is all about looking at the relationships between the items and original user’s profile preferences, based on objects and items user interacted in the past a “second” user’s profile is built to indicate the type of items this user likes. The system then constructs a profile for the each user, which contains categories of the content. To create this “second” user profile, the system mostly focuses on the original profile of the user's preferences and a history of user's interaction with the recommender system. Therefore, this method uses an item profile i.e. a set of discrete attributes and features, characterizing the item within the system. The system creates a content–based profile of users based on a weighted vector of item features. The weights denote the importance of each feature to the user and can be computed from individually rated content vectors, using a variety of techniques. Simple approaches use the average values of the rated item vector while other sophisticated methods use machine learning techniques such as Bayesian Classifiers, cluster analysis, decision trees, and artificial
neural networks in order to estimate the probability that the user is going to like the item, for
see chapter 2 for details.
1.3 – Comparative review of some existing Web Analytics tools
Today a wide range of tools for the web analysis was developed, to better understand their variety, and what user should expect from them, a comparative review of some notable web analytics tools was made. All these web analytic tools were present on the market when this review was done, year 2016. A table at the end of this section shows them all together, comparing some of their key features.1.3.1 – Google Analytics
Beginning with the major favorite [w3techs] on the market of the Internet–related services, a Google Corporation with its well–known “Google Analytics” [Google Analytics,
2016], next GA. It is a widely popular tool because of its integration with Google search engine, wide variety of metrics and relatively simple interface and fast setup, consisting of three simple steps, which are shown on the figure 6.
Figure 6: Google Analytics setup, (screenshot from Google.com)
Google launched GA service in November 2005 after acquiring Urchin Software Corporation, which was widely known by its web analytics product “Urchin” applying log file analysis on the server side, designed to show traffic information on the website based upon the log data. GA offers a full range of analysis for Web, but as always with Google in exchange of your privacy, it means that Google will have access to some of the user’s personal data such as geo-location, your search history, click history, etc. After completing the first step, consisting of entering the URL for the website, for which statistics will be gathered. Desirable name for analysis report and some other data, e.g. reporting time zone, and some extra features, user will get a Tracking ID and universal analytics tracking code, which user could insert into every web page that he/she wants to track, example of the JavaScript code and tracking ID for GA is shown on the figure 7.
Figure 7: Google Analytics tracking ID and tracking script, (screenshot from Groogle.com)
For example, this tracking code was inserted into one of the web pages hosted on the University of Montreal web server for students. A resulting report for one–month period from mid–October 2016 to mid–November 2016 is shown on the figure 8. This is a standard report about visitors, representing total number of visits, average session duration, country of user’s
origin, etc.
By customizing this report, many other metrics and goals, could be added, see section 1.1 for details about used metrics. Typically, a goal is an action that the site owner wants a user to complete, e.g. viewing a particular number of pages, going to a specific page, clicking on a specific button, clicking a link, making a purchase, and so on. Goal completion is meeting the conditions set in the goal parameters. A session in which the goal was completed is called a
conversion. A single conversion may include multiple completions of the same goal. The ratio
of conversions to the total number of sessions is called the conversion rate. Some major features of Google Analytics are:
- Cloud hosting with computational power from the leading data centers on Earth. - Documentation, lots of documentation about it, so anyone could learn how to use it. - Video performance, allows to measure your video performance using YouTube service. - Integration with AdWords, DoubleClick Bid Manager, AdSense, AdMob, and other
advertising service for businesses wanting to display ads on Google.
- Support for all devices, running Windows, Linux, Android, iPhone/iPad and Mac. - Cutting edge technology from the leading IT company on the market for Internet
services.
Some disadvantages of Google Analytics are:
- Privacy – it is a major tradeoff for receiving free quality service in web analytics from Google, as by using GA, you automatically agree to share your data with Google. - Support is limited to a help center and user forum unless you hire support from a
certified partner.
Standard and customized reports could be distributed by any accessible time periods, e.g. day, week, month, and what is very important in the age of social networks GA could detect
user bounces from social networks such as Facebook or Twitter and evaluate user’s social
network preferences, e.g. user’s most popular categories in a social network. GA also providing
Cohort analysis, see section 1.1.3 for details, which helps to understand the behavior of
component groups of users apart from total population of users. It is very much beneficial to marketers and analysts for successful implementation of marketing strategy. GA is a “freemium” service, which means it is provided free of charge, but money (premium) is charged for proprietary features, functionality, or virtual goods, for example a user can have 100 GA site
profiles. Each profile generally corresponds to one website. It is limited to sites, which has traffic of fewer than 5 million page views per month, roughly it is two page–views per second, so to have more statistical data the one must pay for maintenance of additional profiles, unless the site is linked to a Google AdWords campaign. As reported by Web Technologies Survey website [w3techs], which is making surveys for various types of technologies used on the web, market share claimed by Google Analytics is around 54% of all websites in the world.
1.3.2 – Open Web Analytics
An open source web analytics software “Open Web Analytics” package [OWA, 2016], which anybody can use to track and analyze how users use websites and applications. OWA is licensed under the GPL license and provides website owners and developers with easy ways to add web analytics to their sites using simple JavaScript, PHP, or REST based applications, it has nice and relatively clear user interface, which is shown on the figure 9. Like all open–source software its source code is open, so this mean if the one knows something in the matter of programming he/she can modify this web analytics tool for his/her own needs.
Major benefit features of OWA are:
- No restrictions on the amount of user data, it can be used for multiple URL resources. - Information about last visit, individual and detailed reports on the last site visitor with
its locations, type of browser, pages viewed, visit duration, referral, etc.
- Click–stream, heat click and click tracking maps, which intend to record user’s cursor movements, where user click the most, track where exactly on the site user click’s. - Support for WordPress and MediaWiki plugins.
- PHP applications support. - Cost – Free!
- Privacy means all the data is stored on your own server. Major disadvantages of using OWA are:
- Time – it takes some time to install and figure out how to use, as always with most GPL applications.
- No export – no support for file export function from the application interface, you can only do this from the database.
Figure 9: Open Web Analytics dashboard, (screenshot from Open Web Analytics website)
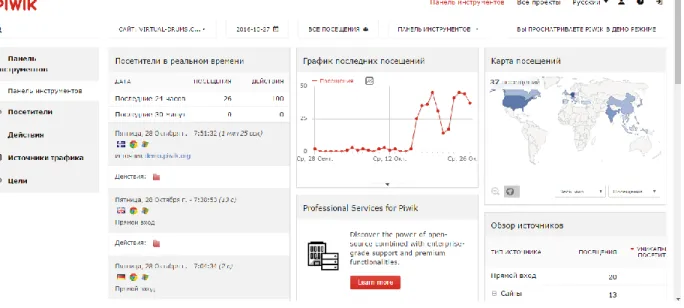
1.3.3 – Yandex Metrica
Another powerful web analytic tool is Russian Yandex Metrica [YM, 2016], in the post– soviet countries of Eastern Europe and in Russia it considered as a major adversary of Google Analytics. It is connected with Russian search engine, which is also called Yandex. By registering a user account for Yandex, called “Yandex passport”, a user automatically gets free access to Yandex Metrica services. To configure YM first the one should register with Yandex, it is like a Google account for GA, but Yandex claims that it will not use user’s personal information to gain profit, as Google does. Second log in into your account, go to YM page, insert website’s URL, the one wants to track and get tracking HTML code for it, and it is done. Now the user can start creating his/her own dashboards and charts, with the most popular metrics and some unique features only available for Yandex Mertica users, such as Yandex Direct, which is actually an analogue of Google AdWords. Hence, this web analytics tool was
developed in Russia, it also provides an English user’s interface, so potentially it could be used by US and Canada users.
Yandex Metrica provides four major conversion types:
- Goals related to tracking someone landing on a specific page URL. - Achievements – plan for achieving a specific amount of page views. - Events, such as clicks on specific buttons.
- Multistep goals where you can combine up to five page URLs or events.
One account in Metrica allows the one to track multiple websites, each having its own set of goals. YM offers an asynchronous code by default in code settings. This type of code does not block or influence the loading speed of your website. It also does not matter where the code is placed, e.g. in the header, body or the footer, even if someone decides to leave the page before it loads completely it will still be classed as a “visit”. Visitor’s actions are reflected in Metrica’s reports between 30 seconds and 5 minutes after the actions, whereas all the other statistics are updated every 30 seconds. All the data is displayed in the table, or on the dashboard, as well as in a variety of neatly presented graphs, interface of the YM is shown on the figure 10, alongside with a simple dashboard.
Yandex Metrica offers following major reporting features:
- Traffic and source reports, including traffic source by region, traffic behavior on your website (number pages viewed, bounce rate, time spent on each page, etc.)
- Visitors interests, which are calculated using analytics technology called Crypta. This technology classifies web users based on their previous online actions. Crypta is based on Yandex’s own machine learning method MatrixNet.
- Sources which leads visitors to your site, e.g. ads, search queries, social networks. - Content reports, which shows statistics on visitor’s interaction with the site’s content
such as entry and exit pages, traffic from external links, file downloads, orders made by visitors and their costs, it is very useful for marketing research.
- Behavior reports: if YM user wondered how people behave when they land on his/her website, using Metrica he/she can see a recording of every visit, up to 1000 per day! - Analysis of user behavior during filling of a web form, this tool provides information
on the number of views of the page containing the form, the number of interactions with the form, the data on sent forms as well as the video recordings of how people behaved when filling in the form.
- Click path analysis with text highlighted in different colors on the map depending on their popularity.
- Heat maps, which measure and displays statistics for clicks on the website, also highlighting by colors most clicked areas. Unlike the link map, the heat map shows clicks on all page elements and not just on links, and even further if a user has 3D glasses he/she can see 3D map!
- Scroll map, by using the scroll map, it is possible to find out how users of long websites view different elements of the page.
- Report builder, allows to create your own report from all the statistics available with a variety of filters and segmentation options to choose from.
- Offline monitoring, Metrica can track when your website is down and provides a report on this data. If a user connected his/her Yandex account with Yandex Direct (Yandex
![Figure 1: Basic steps of Web Analytics [Clifton, 2010]](https://thumb-eu.123doks.com/thumbv2/123doknet/12553001.344163/15.918.140.782.187.556/figure-basic-steps-web-analytics-clifton.webp)