Université du Québec
Institut National de la Recherche Scientifique Centre Energy, Matériaux, Telecomunication
DEVELOPMENT OF LAB ON A CHIP PLATFORMS FOR
BACTERIA DETECTION BASED ON LOOP-MEDIATED
ISOTHERMAL AMPLIFICATION
Par
Mohammadali Safavieh
Mémoire ou thèse présentée pour l’obtention du grade de Philosophiae doctor (Ph.D.)
la science des matériaux
Président du jury et interne Professor Marc Andrè Gauthier Examinateur Institut national de la recherche
scientifique, Université du Québec
Examinateur externe Professor Jalal Hawari
Département des génies civil, géologique et des mines Ecolè Polytechnique de Montrèal Examinateur externe Professor Alexis Vallée-Bélisle
Département de Chimie, Université de Montréal
Directeur de recherche Professor Fiorenzo Vetrone Institut national de la recherche scientifique, Université du Québec
REMERCIEMENTS
“As we express our gratitude, we must never forget that the highest appreciation is not to utter words, but to live by them.”
John F. Kennedy
First and foremost, I would like to express my deepest gratitude to my research supervisor Professor Mohammed Zourob for his encouragement, guidance, patience and continuous support throughout my graduate studies and research. His insight and enthusiasm for research has motivated me to continue a career in this field. I would also thank to Professor Tsuneyuki Ozaki , Dr. Minhaz Uddin Ahmed and Dr. Chaker Tlili for their great support and their guidance.
My sincere gratitude should also be extended to Brigham Women Hospital and Harvard Medical School to provide me an opportunity to work with them. My Special thanks goes to Dr. Hadi Shafiee and Professor Joseph Bonventure. I also extend my acknowledgement to the administration of INRS-EMT and technical support of laboratory of micro and nanofabrication at INRS specially, Dr. Boris Le Drogoff.
Natural Sciences and Engineering Research Council (NSERC), Fonds de recherché du Quebec Nature et Technology (FRQNT) and Programme de Bourse pour de Court Séjours a l’étranger (PBCSE) are gratefully acknowledged for their financial support. The support I have received from my colleagues and friends over the last four years has been invaluable. My special thanks go to Esen Sokullu, Shimaa Eissa, Gastón Contreras Jiménez, Reda Elshafy, Sharifun Nahar, Gina Zhou, Dr. Valeria Felice, Dr. Goe Gerald, Dr. Irina Stateikina, Dr. Ali Vakil and Dr. Mohammad Amin Qasaimeh. I have learned a lot from these excellent people.
Last but not least, I would like to thank my brother, Dr. Roozbeh Safavieh for his unconditional support and encouragement. His technical guidance and useful discussions was always a treasure for me.
DEDICATION
I dedicate this thesis to my parents, Who thought me tenacity, passion and hard work.
“Out beyond ideas of wrongdoing and rightdoing there is a field.
I'll meet you there.
When the soul lies down in that grass the world is too full to talk about.” Rumi
ABSTRACT
Infectious disease accounts for nearly 50 million illness incidences around the world. Applications of lab on chip devices in conducting biomedical research have been drawn substantial interests from scientists and researchers all over the world. These lab-on-a-chip systems create clinically useful technologies and have a number of competitive advantages over the conventional biomedical instruments due to the reduced reagents/samples consumption, decreased analysis times and operational costs. In addition, these systems facilitate the development of the portable devices and the possibility of automatically performing multiple assay processes. Early detection and notification of pathogenic bacteria, is therefore of considerable significance in disease control. DNA-based amplification technique, known as a precise diagnostic tool for detecting pathogens, has presented a distinctive advantages over the conventional microbiological culture-based methods for pathogen detection such as high sensitivity, specificity and rapidity, especially in the detection of bacteria in samples containing low concentrations. over the past decade, loop-mediated isothermal amplification (LAMP) has caught significant attention as it is provides rapid amplification with high sensitivity and specificity of the target gene. In this thesis, various lab on a chip based platforms have been developed combining DNA LAMP amplification for detection and quantification of pathogens. In the first part, a microfluidic device designed for amplification of malB gene of E.coli bacteria followed by electrochemical detection of the amplified product. Through amplification time optimization, microfluidic chip could detect and quantify 48 cfu/ml of bacteria in 35 min employing immobilisation-free electrochemical transduction. In the second part of thesis, we have invented a cassette device for high throughput detection of various bacteria types (gram negative & gram positive). The cassette consists of two aluminum reels and a plastic ribbon, which has an array of chambers. one reel act as the provider of ribbon whilst the other one act as collector. The collector reel is connected to a heater to provide adequate temperatures for the amplification. LAMP solutions with E.coli (as gram negative model for bacteria) was applied to each reservoir and a plastic tape cover the chambers and rolls into the
method employing Hydronaphthol blue (HNB) with a 30 CFU/ml limit of detection. The color of HNB changed from purple to blue in the presence of bacterial amplified product. Through procedure modification we were able to detect as low as 200 CFU/ml of S.aureus as an example gram-positive bacteria using Calcein.
In the third part of thesis, the cassette’s ribbon has been modified by using flexible screen-printed electrode attached at the bottom of each chamber. Using Osmium redox and immobilisation-free of electrochemical technique, we could monitor the amplification of DNA of E.coli and S.aureus bacteria in a real-time analysis and quantification.
In the forth part of thesis, a novel biosensor platform has been developed to detect the viability of bacteria using T4 bacteriophage and label free impedance spectroscopy. We have shown that we could monitor viability of bacteria in the range of 103 -109 CFU/ml, while using LAMP amplification and linear sweep voltammetry technique we could detect 102 CFU/ml within 40 min response time.
In the last part of the thesis, we summarize our findings, and provide contribution of these researches to the knowledge as well as health. In addition, future possible path to the research work will be discussed.
TABLE OF CONTENT
Remerciements ……… i Dedication……….iv Abstract………..v Table of Content……….……….………vii List of Tables….………..……….xi List of Figures……….……….……xii Abreviations……….………...xiv Contribution of authors……….xix 1. Chapter 1: Introduction…...……….1 1.1 Background……….1 1.2 Research objective………3 1.3 Thesis overview……….42. Chapter 2: Background Knowledge………..6
2.1 Principle of bacteria detection………..6
2.2 Nucleic acid based bacteria detection………8
2.2.1 Multi thermal amplification ……….12
2.2.1.1 PCR microfluidics ……….16 2.2.1.2 Nano/Pico litter PCR ………17 2.2.2 Isothermal amplifications……….22 2.2.2.1 NASBA………22 2.2.2.2 RCA……….……23 2.2.2.3 HDA……….…………23
2.2.2.4 SDA……….………24 2.2.2.5 LAMP………..…………24 2.1.2 Electrochemical techniques………25 2.1.3 Detection Mechanism………..………29 2.1.3.1 Electrochemical Detection………...30 2.1.4 Microfluidic……….34
3. Chapter three: Microfluidic Electrochemical Assay for rapid detection and Quantification of E.coli………...…………36
3.1 Introduction………...………36
3.2 Material and methods……….…39
3.2.1 Bacteria preparation and DNA extraction………39
3.2.2 Microfluidic Chip……….………..40
3.2.3 LAMP reaction……….……….…40
3.2.4 Electrochemical Detection………..………40
3.3 Results and Discussion………..………41
3.3.1 DNA detection………..……41
3.3.2 Bacteria detection………43
3.3.3 Time optimization……….………44
3.3.4 Chip calibration……….……45
3.3.5 Cross reactivity tests………46
3.4 Conclusion………46
4. Chapter four: A simple cassette as point-of-care diagnostic device for naked-eye colorimetric bacteria detection……….… 49
4.2.1 Cassette fabrication and operation………51
4.2.2 Flexible substrate fabrication………..…52
4.2.3 LAMP reaction……….……….…53
4.2.4 Finite element method modeling………..……..…54
4.3 Results and Discussion……….….54
4.3.1 Colorimetric detection of E.coli……….…..54
4.3.2 Colorimetric detection of S.aureus……….…55
4.3.3 Heat transfer of cassette reel……….57
4.4 Conclusion………59
5.Chapter five: High-throughput real-time electrochemical monitoring of LAMP for pathogenic bacteria detection………..61
5.1 Introduction………...62
5.2 Materials and Methods………64
5.2.1 Chemical reagents and Materials………..…64
5.2.2 Cassette fabrication and operation………65
5.2.3 Electrochemical Assay……….…65
5.2.4 LAMP assay………..66
5.3 Results and discussion ………..66
5.3.1 Cassette Operation………..…66
5.3.2 Real-time detection of E.coli bacteria………68
5.3.3 Real-time detection of S.aureus bacteria……….69
5.3.4 End point detection and cross reactivity………...74
5.3.5 Comparison between Gel image and Electrochemical result………76
6. Chapter six: Bacteria Screening, Viability, And Confirmation Assays Using Bacteriophage-Impedimetric/Loop-Mediated Isothermal Amplification Dual-Response
Biosensors………...77
6.1 Introduction………...78
6.2 Experimental setup………..80
6.2.1 Chemical and Materials………...80
6.2.2 Pretreatment of the Gold Electrode and Surface Modification……..81
6.2.3 Culturing of E.coli cell………..82
6.2.4 Aparatus………82
6.3 Results and discussion………...…84
6.3.1 Electrochemical Characterization of the Gold Electrode and Surface Modification……….………84
6.3.2 Detection of E. coli Bacteria by Electrochemical Impedance (EIS)..88
6.3.3 Specificity, Reproducibility, Stability, and Viability Test……….92
6.3.4 LAMP based E.coli biosensor……….96
6.4 Conclusion………97
7. Chapter seven: Chapter seven : Summary and Future work………..99
7.1 Summary of findings………99
7.2 Recommandations for future direction………...100
Appendix I ……….102
Appendix II……….129
Appendix III………131
Appendix IV………...133
LIST OF TABLES
Table 2.1 Microfluidic Platforms with DNA microarrays……….10
Table 2.2 Various non isothermal PCR amplification techniques.……….15
Table A1.1 Various Dyes used for LAMP detection.……….………...104
Table A1.2 Various redox has been used for LAMP detection.………108
Table A1.3 LOC Companies used LAMP technology ……..……….127
Table A2.1 LAMP primers and primers sequences and size for E.coli Tuf gene and Mcat S.aureus gene amplification ………..130
Table A3.1 RSD % of real-time analysis for quantification of the assays bacteria quantification of (A) E.coli (B) S.aureus………...132
LISTE OF FIGURES
Chapter 2
Figure 2.1 Schematic of a Solid phase sandwich ELISA-type process used to measure
the concentration of proteins in the solution.………...7
Figure 2.2 Microfluidic microarrays for bacteria pathogenic detection based on various driving force of sample.………...14
Figure 2.3 Microfluidic NanoPCR Chips...21
Figure 2.4 Schematic representation of various isothermal amplification reaction processes...………...26
Figure 2.5 Schematic diagram of CV...28
Figure2.6 Schematic representation of DNA hybridiation on gold substrate…………....31
Figure 2.7 Schematic of electrochemical DNA hybridization detection based on molecular beacon. ………...33
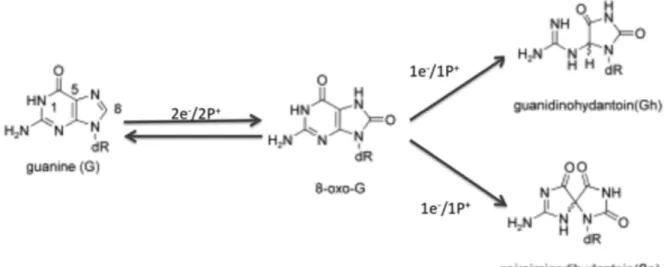
Figure 2.8 Schematic of the guanine oxidation...33
Figure 2.9 Schematic of electochemical detection of NA...34
Figure 2.10 Schematic of various biomolecules and their length scale ranging from angstrom (water) to tens of micrometer (cancer cells)...35
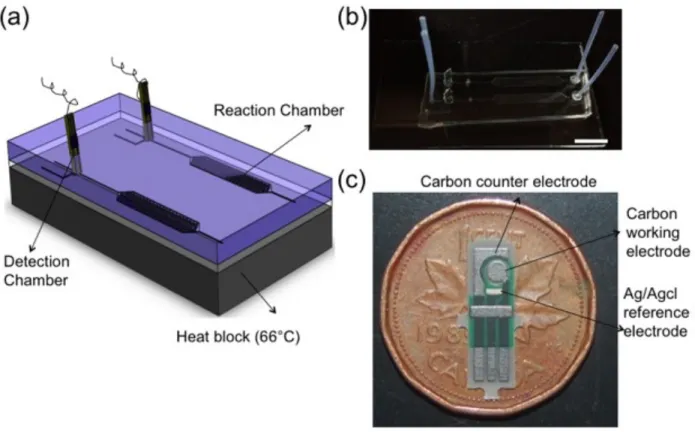
Chapter 3 Figure 3.1 Schematic representation of the microfluidic chip for E.coli detection...39
Figure 3.2 Schematic of the electrochemical detection in the electrode chamber on microfluidic chip.... ………...41
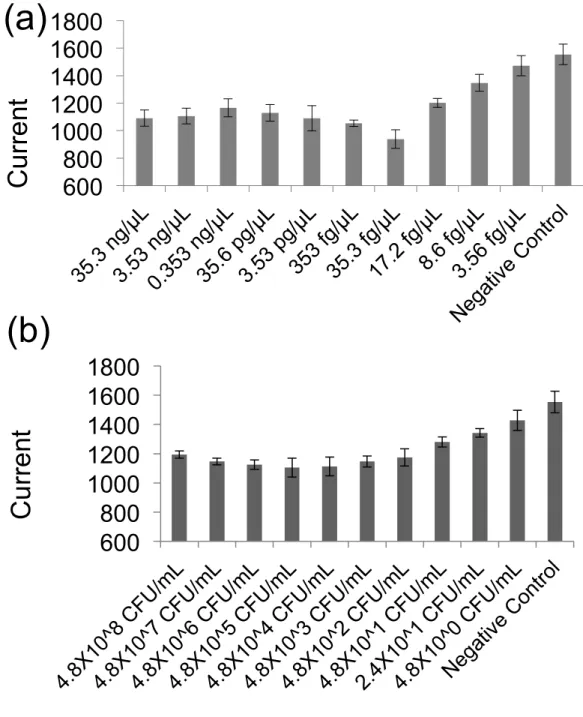
Figure 3.3 Electrochemical detection of E.coli in the microfluidic chip...43
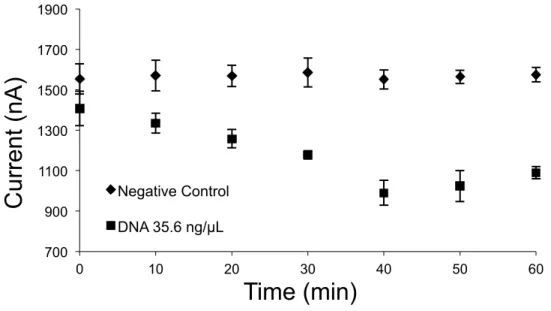
Figure 3.4 Time optimization of DNA sample on the chip...45
Figure 3.5 Quantification of E.coli bacteria in different media...47
Chapter 4
Figure 4.1 Overview of Cassette device and its components……...52
Figure 4.2 Fabrication of flexible substrate………...53
Figure 4.3 E.coli real sample detection assay on flexible substrate...56
Figure 4.4 S.aureus real sample detection assay………...58
Figure 4.5 Numerical heat-transfer simulation around the Cassette reel and ribbon….59 Chapter 5 Figure 5.1 Schematic representation of the cassette...66
Figure 5.2 Schematic of the real-time electrochemical monitoring of LAMP amplicon...67
Figure 5.3 Real-time measurement of E.coli using 0.5 µM Osmium redox...71
Figure 5.4 Real-time measurement of S.aureus bacteria...74
Figure 5.5 End-point detection of bacteria at different concentration and cross-reactivity tests...76
Chapter 6 Figure 6.1 Schematic representation of the T4-bacteriophage biosensors………...83
Figure 6.2 T4-bacteriophage biosensor characterization on Au electrode...86
Figure 6.3 Nyquist impedimetric diagram of T4-bacteriophage-modified gold electrode interface at different concentrations of E.coli...90
Figure 6.4 T4-bacteriophage biosensors selectivity against Listeria cells...93
Figure 6.5 Viability test of live (●) and dead (blue ▲) E.coli bacteria cells...95
Figure 6.6(A) Linear Sweep voltammetry (LSV) monitoring the LAMP amplification of the Tuf gene target. (B) Calibration curve of the LAMP assay...97
Appendix 1 Figure A1.1 LOC devices based on LAMP amplification and colorimetric detection....107
Figure A1.2 Microchip devices for electrochemical LAMP assay at End point
detection………...110
Figure A1.3 Microfluidic electrochemical for real-time monitoring of LAMP...111
Figure A1.4 Microfluidic integrated with Fiber optics...114
Figure A1.5 Microchip LAMP bacteria detection integrated with Spectrophotometer...116
Figure A1.6 LAMP Microfluidic chips integrated with CCD Camera...118
Figure A1.7 PH sensing chip for LAMP monitoring...120
Figure A1.8 Multiplexing and High throughput LAMP LOC devices...125
Figure A1.9 Electricity free cartridges for LAMP amplification………...127
Appendix 2 Figure A2.1 Schematic of the geometry of reel for heat transfersimulation...129
Figure A2.2 Schematic of the fabrication process..……….………...131
Figure A2.3 Gel electrophoresis image for real time monitoring of E.coli bacteria after 50 min amplification time for various concentrations. Negative Control was set as S.aureus DNA. ………...……….………...131
Figure A2.4 Gel electrophoresis image for S.aureus bacteria after 50 min amplification time for various concentrations. Negative control was set as E.coli DNA ……….132
ABREVIATIONS
ASSURED………..Affordable, Sensitive, Specific, User-friendly, Rapid and robust, Equipment-free and Deliverable to end users CE……….. Capilary electrophoresis CFU ……….Colony Forming Unit DL ……….Double layer dCTP……….Deoxycytidine triphosphate DEP………Disposable Electrochemical Printed DNA ……….Deoxyribose nucleic acid DPV ………Differential Pulse voltametry dsDNA………....double stranded DNA EIS ………..Electrochemical impedance spectroscopy ELISA ……….Enzymatic linked immunosorbent assay HDA ……….… Helicase dependant amplification HNB………Hydronaphthol Blue LAMP ……….Loop-mediated isothermal amplification LOC………Lab on a Chip LOD………Limit of detection LSV ………..Linear sweep voltametry NA ………..Nucleic Acid NASBA ……….Nucleic acid sequence based amplification PBS……….Phosphate-buffered saline PCR ………Polymerase Chain Reaction PDMS……… Poly dimethylsiloxhance
PMMA ………..Poly methyl metha acrylate POC ………..Point of Care qPCR………Quantified Polymerase Chain Reaction RCA ………..Rolling Circle amplification RNA ………...Riboxy nucleic acid SWV ……….Square wave voltametry SPE………..Screen printed electrodes ssDNA……… Single stranded DNA SAM………Self assembled monolayer WHO………World health organization XPS………X-ray photoelectron spectroscopy
CONTRIBUTION OF AUTHORS
This thesis is prepared by the collection of articles written by the candidate with the contribution from the co-authors. Chapter 1 presents the scope of thesis. In the chapter 2, general literature survey and background knowledge has been studied. Chapters of 3-6 represent the results, which have been either published or submitted in a peer- reviewed scientific journals. Finally, Chapter 7, summarize and concludes the findings and prospects the key elements for future works. Dr. Mohammed Zourob appears to be the co-authors of the paper for contribution in designing the research projects, leading the scientific research, helping to analyze the data and involvement in manuscript correction and submission. In Chapter 3, Dr. Minhaz Uddin Ahmed helped to accomplish the experiments and thought how to run various biological and electrochemical assays. On the chapter 4&5, Dr. Ahmed contributed to the project by designing the primers for loop mediated isothermal amplification, correcting the manuscript and discussing the data and achievements, Dr. Andy NG contributed effectively on manuscript correction and modifications. In Chapter 4, Esen Sokullu helped to run various biological assays, and Dr Breascau analyzed the finite element analysis data. In Chapter 5, Dr Chaker Tlili had the contribution by performing the experiments of viability test using electrochemical impedance spectroscopy measurements and writing the manuscript.
1
CHAPTER 1 : INTRODUCTION
1.1 Background
Effective bacteria detection and in vitro diagnostics are essential for clinical practices. These bioassays use body fluid such as blood, urine, and saliva to detect pathogens. The golden standard for bacteria detection relied on culture techniques, which can detect a single bacterium by growing it onto a specific media to form a distinct visible colony. However, it requires highly skilled personnel to conduct, it is time-consuming and depending on the bacterial type. It can take from 24 hours to weeks for some bacteria.
Immunoassays are biochemical tests that are used to detect various pathogens and viruses in different matrices. The assay is based on the high affinity and specificity in binding of an antigen and its corresponding antibody for the detection and quantification of this antigen in biological fluids. The immunoassays are available in various formats such as enzymatic linked immunosorbent assay (ELISA) and lateral flow assays that are developed for detection of various types of bacteria, virus, and also for spores detection [1]. However, these techniques are laborious, multi-step and semi quantitative, which does not provide high sensitivity to diagnose diseases caused by low concentration of infectious doses that most of the bacterial infections require another disadvantage, is cross-reactivity. Therefore, development of other types of biosensors is necessary.
Among other assays, DNA hybridization and amplification techniques provide accurate and reliable results. Microarrays spotters and nucleic acids amplification based point of care (POC) devices are two important tools that are commonly used to perform diagnosis. Microarrays spotters print millions of short nucleic acids or protein probes on the surface of glass or other substrates such as nitrocellulose which makes it a viable platform for pathogen detection [2]. The probes are designed in a complementary way to sequences of target organism biomarker. Various techniques have been used to spot onto the array such as mechanical deposition [3], inkjet spray using printer tip as well as
photo catalytic reaction [4] . In order to analyze samples with these arrays, nucleic acids first should be extracted. The DNA can be amplified by different amplification techniques such as polymerase chain reaction (PCR) and labelling. The labeled DNA is incubated for several hours to hybridized with the probe. Later, the array is washed to remove unbound DNA. The fluorescent intensity of the bound DNA is scanned with the bright sections representing the probes that are complementary to the DNA.
The most common and sensitive technique for the amplification of nucleic acids and genomic analyte is PCR. Since it was first published in 1985 [5], PCR demonstrated a promising technique for detection of organisms at low concentrations. Since it detects the target based on the amplification rather than the original signal, it is much less prone to false positive result. The principle of PCR is based on three sequential steps and it requires different temperature cycles. The high temperature, commonly, 90°C, is used to denature DNA template and form the single strand template. The lower temperature (~50°C) is for annealing of the primers to the target section of DNA and the intermediate temperature (~70 °C) which lies between the previous two temperatures is used to help the polymerase enzymes to generate huge number of copies of the target DNA[6]. Miniaturization of conventional assays can provide many advantages such as using minute volumes of samples as well as reagents. In addition, it increases the surface to volume ratio and provides better mass transfer in the reaction and reduces the time of the assay. Moreover, it provides portability and ease of use. The World Health Organization (WHO), set the remarkable criteria called ASSURED (Affordable, Sensitive, Specific, User-friendly, Rapid and Robust, Equipment-free and Deliverable to end-users) as the ideal criteria for POC diagnostic devices. As a results, significant efforts have been accomplished toward meeting these criteria [7].
POC diagnostics consist of different sections of liquid handling devices, which controls the sample, and in some cases interfaces. The interface is designed for sample preparation (i.e. PCR processing), signal quantification and demonstration of the signal results. The main components of the liquid handling device is to a reaction chamber, where reagents can react together and a detection unit, where the signal is obtained at
place in separate time-consuming multi-steps processes. Despite the fact that, it is cumbersome to satisfy all the ASSURED criteria, the liquid handling or the assay process can be designed in such a way to be close to ASSURED with minor use difficulties. Thus, the main challenge is to provide POC liquid handling devices that operate in a multi function fashion while satisfying the ASSURED requirements [8]. Our research objective is to develop a novel POC diagnostic device that is both accurate and rapid in detection of bacteria. The first technology described here is development of a novel microfluidic system for the detection and quantification of E.coli bacteria. We first developed a microfluidic device, with different components like valves, and fluidic reaction chamber and electrochemical detection components. Afterwards, we ran the electrochemical assay based on amplification of malB gene for E.coli detection, which can be used in the POC devices. LAMP is used as an amplification method with high sensitivity and specificity. We have detected the amplicon using linear sweep voltammetry (LSV). This device has a high potential to be used for detection of any gram-negative bacteria.
In the second part, we present cassette as a novel device for POC diagnostic device. We fabricated a roll of plastic and designed it to be used as a cassette format. Firstly, the plastic polyethylene ribbon composed of reaction chamber to implement the LAMP for detection of multiple targets of Tuf E.coli gene. Secondly, the cassette operation was modified in order to detect S.aureus bacteria. Through numerical simulation, the heat transfer around the collector reel was simulated in order to estimate the number of samples that can be analyzed in a high throughput format.
In the third part, the cassette was modified by attaching the flexible SPE at the bottom of each reservoir of flexible ribbon. The osmium redox was employed in the electrochemical detection and enabled the device to monitor real-time detection of amplicon in the solution. We were able of detection same levels of detection, previously achieved by colorimetric detection for E.coli and S.aureus bacteria in 30 min and 37 min, respectively followed by bacteria quantification. The cross reactivity test was employed, to check that the assays are highly specific to the target genes.
The aim of the last part is to provide a novel detection mechanism for future biochip design to test the viability of pathogens. Liveability of E.coli was tested using T4 bacteriophage as the natural E.coli bacteria receptor and monitoring the viability of E.coli using label free impedance spectroscopy. The assay provides confirmation of bacteria using LAMP following by LSV technique.
1.2 Research Objectives
Our research objective is to develop a novel POC diagnostic device that is both accurate and rapid in detection of bacteria. The first technology described here is development of a novel microfluidic system for the detection and quantification of E.coli bacteria. We first developed a microfluidic device, with different components like valves, and fluidic reaction chamber and electrochemical detection components. Afterwards, we ran the electrochemical assay based on amplification of malB gene for E.coli detection, which can be used in the POC devices. LAMP is used as an amplification method with high sensitivity and specificity. We have detected the amplicon using linear sweep voltammetry (LSV). This device has a high potential to be used for detection of any gram-negative bacteria.
In the second part, we present cassette as a novel device for POC diagnostic device. We fabricated a roll of plastic and designed it to be used as a cassette format. Firstly, the plastic polyethylene ribbon composed of reaction chamber to implement the LAMP for detection of multiple targets of Tuf E.coli gene. Secondly, the cassette operation was modified in order to detect S.aureus bacteria. Through numerical simulation, the heat transfer around the collector reel was simulated in order to estimate the number of samples that can be analyzed in a high throughput format.
In the third part, the cassette was modified by attaching the flexible SPE at the bottom of each reservoir of flexible ribbon. The osmium redox was employed in the electrochemical detection and enabled the device to monitor real-time detection of amplicon in the solution. We were able of detection same levels of detection, previously achieved by colorimetric detection for E.coli and S.aureus bacteria in 30 min and 37
employed, to check that the assays are highly specific to the target genes.
The aim of the last part is to provide a novel detection mechanism for future biochip design to test the viability of pathogens. Liveability of E.coli was tested using T4 bacteriophage as the natural E.coli bacteria receptor and monitoring the liveability of E.coli using label free impedance spectroscopy. The assay provides confirmation of bacteria using LAMP following by LSV technique.
1.3 Thesis overview
This thesis covers our work in the development of various platforms of POC diagnostic systems and is organized as follows:
Chapter two provides introduction of the thesis and covers basic principles of bacterial detection. We focus mainly on amplification techniques as the most prominent and reliable method for bacterial detection. We specifically focus on the loop-mediated isothermal amplification. Various electrochemical detection mechanism that are suitable for POC diagnostics are reviewed. Also it covers a review of LAMP techniques in microfluidic platforms.
Chapter three initiates the result of the microfluidic electrochemical platform for detection and quantification of E.coli bacteria using disposable screen-printed electrodes (SPEs). Electrochemical detection was used based on interaction of Hoechst 33258 and DNA amplification products using LSV. We used a novel method to simultaneously lyse the bacteria followed by amplification of released DNA in the sample. The assay was tested using bacteria E.coli sample in the LB broth media without purification. LOD of 24 cfu/ml in 1 hour. amplification time was achieved. Afterward, we optimized the amplification time and 48 cfu/ml was detected in 35 min following by quantification of the bacteria. We have tested our chip and showed that we could detect the bacteria in various turbid media such as low concentration filtered urine.
Chapter four demonstrates the novel architecture as a proof of concept for POC diagnostic device using the naked-eye bacteria detection in a cassette format. The cassette consists of two aluminum reels as a provider and collector of the flexible
ribbons that has multi reservoirs for sample processing. We used a colorimetric assay with two different colorimetric dyes (HNB and Calcein) for detection of E.coli (as a gram-negative bacteria model) and S.aureus (gram positive model), respectively. We could first detect 20 cfu/ml of E.coli bacteria. The operational process for S.aureus bacteria detection was modified and 200 cfu/ml of S.aureus bacteria in 1 hour amplification time was achieved. Using numerical simulation, temperature profile around the collector reel a minimum of 32 samples can be analyzed simultaneously.
Chapter five, introduces the novel process for real-time bacteria detection with high sensitivity and specificity. The flexible ribbon in the cassette was modified using flexible screen-printed carbon electrode attached to the bottom of each reservoir. Then we used the Osmium redox to provide real-time monitoring of redox intercalating with amplification products. We have shown that we could detect 20 CFU/ml of E.coli and 200 CFU/ml of S.aureus bacteria following real-time analysis. Since all the lysis step as well as amplification was implemented in sealed chips, costly post processing is not required and as a consequence, it reduces the cost and potential of contamination for the environment.
Chapter six introduces the novel detection mechanism for the viability test of E.coli bacteria using T4 bacteriophage. Two different assays have been integrated to provide viability, screening and confirmation of bacteria in the sample. The first assay provides a viability test by monitoring of impedance spectroscopy of bacteria detection using T4 bacteriophage as the natural receptor with the sensitivity range between 109- 103 CFU/ml. Then the assay's sensitivity was increased using LAMP amplification technique followed by electrochemical detection using Hoechst 33258 redox based on LSV technique. While the linear relation response of LSV was achieved in the range of 102 -107 CFU/ml with the LOD of 8×10² CFU/ml in less than 15 min and 102 CFU/ml within a response time of 40 min was achieved.
Chapter seven provides discussion, summary of findings and outline for the future prospects of these projects.
2
CHAPTR TWO: BACKGROUND KNOWLEDGE
2.1 Principle of bacteria detection
Development of a rapid, sensitive and accurate bacterial detection device is essential for controlling infectious disease. In general, identifying the bacteria in samples is the most critical step in order to cure patients and protecting individuals [9-11]. The development of rapid and sensitive platforms to detect pathogenic bacteria is essential for providing a rapid response to an outbreak [12]. This rapid response is more difficult in the area of biodefense and bioterrorism where immediate, appropriate preventive procedures are required.
Generally, there are various techniques for bacterial identification. The golden standard technique for bacteria detection relies on morphological characteristics of the microorganisms as well as bacteria’s ability to grow in different media. This technique involves culturing and assessing growth of individual viable bacteria using either non selective media, such as trypticase soy agar or selective ones i.e Xylose, lysine desoxyscholate, MacConkey agar [13]. However, culturing technique is time consuming and depends on a specific bacterial strain, it takes between several hours to even several weeks to culture the baceria colonies. Moreover, culturing technique for bacteria detection will be more challenging if low number of bacteria exists in the sample. Pre-enrichment step is required to increase the concentration of bacteria.
Immunoassays are biochemical tests that are used to measure the concentration of one or many bio-analytes in a biological sample by means of antigen-antibody reactions. The assays take the advantage of the high-affinity and specificity in binding between an antigen and its corresponding antibody to detect and quantify the antigen in biological fluids. Many types of immunoassays have been developed and used for bacteria, virus, and spores detection. Figure 2.1 illustrates the schematic of an immunoassay, commonly used in the Immuno-chromatographic assays (i.e. Solid phase sandwich ELISA-type). In this format, the capture antibody is first immobilized on the surface. Subsequently, the sample is flowed over the capture antibody, and the analyte (antigen) in the sample is captured by the immobilized protein (antibody). Finally, by passing the
detection antibody, which is conjugated with a label [14] over the captured analyte pathogen can be detected. Despite using very short assay time in comparison with culture techniques, unfortunately this technique cannot detect microorganism in real time. Besides, this technique has some major drawbacks like poor sensitivity as well as being a multistep process. Other method for bacteria detection relies on detection of the nucleic acid located intracellular which refres to nucleic acid (NA) test. Whilst, the first method provides faster, and less manipulation technique, with lower specificity, NA tests provide higher sensitivity and accuracy.
The detection of pathogens in clinical samples has several technical challenges due to the fact that a) biological samples has a complex structure, b) samples are in very limited quantities, c) it might contain a very few pathogens (early infection and diagnostics).
Figure 2.1 Schematic of a Solid phase sandwich ELISA-type process used to measure the concentration of proteins in the solution. (a) The capture antibody (CAb) is immobilized on the surface. (b) Later on, we flow the sample over the capture antibody; as a result the analyte (antigen) in the sample is captured by the CAb. (c) Finally, we pass the secondary detection antibody combined with a label over the captured protein to detect the desired protein*.
2.1.1 Nucleic acid based bacteria detection
Nucleic acids (NA) tests are the most reliable technique for pathogen detection. Generally, NAs can be detected by using microarray or amplification techniques. DNA Microarrays emerged as a viable platform for pathogen detection [4] by immobilizing
substrate such as wafer, glass or nylon. The probes are designed in such a way to be complementary to the sequences of target organism's genomic DNA. Then, the sequences are labeled by fluorescent or radioactive labels [15]. Once the sample is added either in bulk or using liquid handling device such as microfluidics to the microarray, hybridization takes place. The array will then be scanned to visualize the fluorescent pattern tilled on the surface of the substrate and the pattern is read out by microarray reader.
Various techniques have been used in order to spot probes onto the array such as mechanical deposition, inkjet spray using printer tip as well as photo catalytic reaction [16]. In order to analyze samples with this type of array, nucleic acids first should be extracted from the cells at the bench top. Probe design and selection is one of the important factors and a good design can help in resolving many issues to provide proper specificity and sensitivity. These issues are the cross hybridization, orthogonal probe binding to the target DNA, uniformity of the annealing temperature (GC content) and length of the probe [17]. All these issues result in false positive or false negative responses, which can have significant negative effects particularly when dealing with the deadly pathogens.
Over the past decade, combining microfluidic and DNA microarray technology has been exploited simultaneously for pathogen detection analysis. The main advantages of microfluidic technology, in this regard, is that first, it requires a small volume of sample to initiate the process in protein and DNA assays a very small amount of sample volume is provided which can not be implemented in the bulk analysis. Microfluidics provide a solution to analyze these materials in portable LOC devices. Moreover, surface hybridization of the DNA in microfluidic can be accelerated in comparison with bulk samples. Conventional DNA microarray with approximately 30-µl sample requires overnight incubation in order for the hybridization to take place. Initially, the kinetic of the hybridization is based on the reaction limited phenomenon [18]. After that, the probe depletion is based on a diffusion based limited phenomenon [19]. Since the diffusion coefficient (D) of the nucleic acid is 10-7 cm2/s, and the length scale (L) such that the NA are moving according to (L= Dt ), is in the order of 1 mm in 24h. Yet, the time scale
(t) for precipitation of the DNA to the microarray will be much faster due to the fact that the convection forces in the micro-channel will enhance the diffusion of the nucleic acid and consequently increase the hybridization efficiency of DNA. Generally speaking, in conversional microarray, the DNA sample is loaded on to the surface of the microarray and incubated for several hours. In order to to overcome the barrier of the diffusion, various driving forces can be exploited. Initially, the negatively charged DNA is driven by electro-kinetic forces in the microfluidic channels [20]. Another intuitive approach to drive the flow into the microarray chamber is to render the pressure driven flow using a typical syringe pump. That is because the hybridization is more efficient if the solution-containing target DNA moves toward oligonucleotide probes in the small microarray chamber and can encounter every single probe. However if the microarray chamber is large, a series of approaches can take it into the consideration such as using peristaltic pump to recirculate the target DNA sample [21] or chaotic mixing of the DNA sample [22].
Other types of driving forces in the microfluidic platforms are rotational force in a CD based microfluidic [23] devices. Peytavi et al developed a microfluidic CD platform for DNA/PCR amplicon hybridization in less than 15 min for detection. it distinguished 4 different clinically relevant Staphylococcus speciousthat differ by as little as 1 base pair mismatch with a high sensitivity for as low as 10 copy of genome DNA. The captured probes were immobilized on 4 linear arrays with the size of 5-µm×75 µm. Table 2.1 shows the different platforms of microfluidic for DNA microarrays. Capillary force is another type of driving force, which was used in the microarray microfluidic systems. Sabourin et al developed a microfluidic chip made of PMMA to detect human beta globin (HBG) gene, which contains a mutation for 18 patients. The 60 µl sample were filled into the microchannel using capillary force and was detected based on fluorescent analysis [24]. Recently, conjugated beads with the target DNA have been used in the coated micro-channels with DNA probes. Javanmard et al developed a microfluidic system for DNA detection based on conductance measurement. The DNA beads were then injected to the microfluidic channels and were bound to the surface of the
11 Reference [24] [25] [26] [27] [28] [29] [30] [31] [32] [33] Hybridization time 37°C for 2 hrs
86.5°C for 2 min, 35 cycles of 86.5°C for 45 s, 50°C for 1 min 30 s, and 65°C for 5 min,
85°C for 2 min and 40°C for 45 min
45°C at 5 min 42 °C for 2 h. 45 °C for 2 hr
5 min room temperature 40 min at room temperature
42 °C for 5–300 s. 15 min & 30 min 15 min Chip material PMMA PC Glass PDMS PDMS PDMS PDMS PDMS PC PDMS Throughput analysis 18 Samples 1 3 High throughput 3 4 High throughput 1 2 1 Driving force Capilary force Capilary force Capilary force Centrifugal based Centrifugal based Centrifugal based Centrifugal based R product Pnumatic pump Syringe pump syringe pump (bead
Sample type cDNA,PCR product PCR product, Oligonucleotide PCR product PCR product, Oligonucleotide PCR product DNA, PCR product DNA PCR product, cDNA, Single base
Sample Volume 60 µl 15 µl -- 1 µl 1 µl 2 µl 1 µl 16 µl 25 µl --
12 [34] [35] [36] [37] [38] [39] [40] 500 sec 42°C 40°C for 10 min 40-60°C for 5 min 45–50 °C UV 45 °C 65°C PMMA PDMS PMMA PDMS PDMS PDMS COP 1 3 1 -- 4 3 4 syringe pump syringe pump syringe pump syringe pump syringe pump syringe pump syringe pump DNA PCR product PCR product mRNA cDNA cDNA DNA 1 µl 90 µl 30 µl 30 µl 25 µl -- 50 µl
were taken between the two sides of the micro-channels using two electrodes fabricated at each side of the micro-channel. Optical microscopy was exploited to prove that the electrical changes took place as result of the beads binding between the electrodes. Figure 2.2 shows different types of microfluidic microarrays based on different driving forces of sample fluid. Despite attractiveness of providing precision, microarray is not suitable for POC diagnostics due to the fact that it requires scanner facilities as well as a costly microarray reader. Consequently, more efforts have been focused on other types of techniques for NA detection. Since the quantity of NA in bio-samples is relatively small, the amplification technique plays a critical role in the bacteria diagnostics. Generally speaking, amplification techniques are performed by DNA synthesis through a thermal reaction. Depending on the amplification techniques, differentiation can be categorized into two different subsection based on thermal cycling system (multi-thermal amplification) and isothermal amplification.
2.1.1.1 Multi thermal amplification
The most commonly used technique for NA amplification is PCR. PCR has been demonstrated as a promising technique for detection of micro-organisms. Since it detects the target based on amplification, rather than the signal thus it is much less prone to false positive results. The principle of PCR primarily uses three different temperatures to control various sequential steps (denaturing, annealing, extension). The high temperature, commonly 90°C, is used to denature DNA template and form the single strand template. Lower temperature (~50 °C) is for annealing of primers to the target sections of DNA and at intermediate temperature (~70 °C) between the previous two temperatures the polymerase enzymes generate huge number of copies of target gene in DNA [5].
PCR has distinct advantages over culture method and other standard methods and provides high sensitivity, specificity, rapidity and ability to detect small amounts of DNA in the sample. Various PCR methods have been developed based on their application for amplification. For example, quantitative real-time PCR can be used for quantification of DNA concentration by detecting the intensity of florescent signal [41]. RNA quantification can be achieved using reverse transcriptase PCR (RT-PCR), nested PCR
can be used to prevent contamination of product due to unexpected primers binding sites [42]. Long range PCR is for the nucleic acid amplification for more than 5k base pair. Multiplex PCR can amplify various DNA templates simultaneously [43]. Table 2.2 shows various type of PCR techniques.
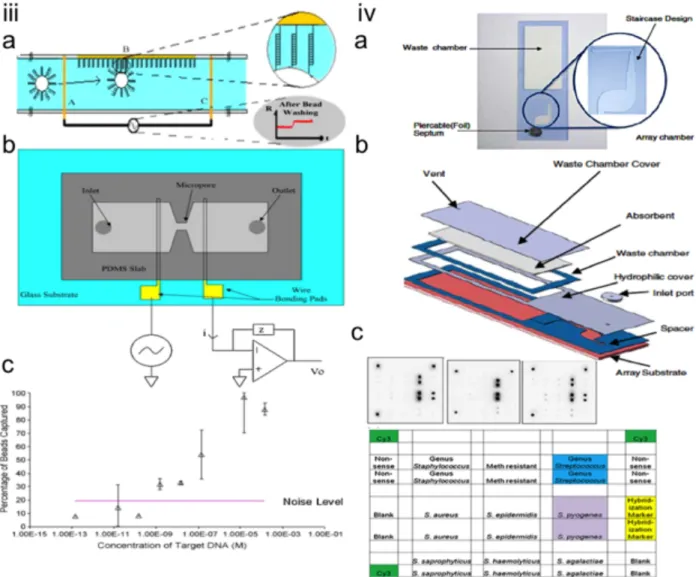
Figure 2.2 Microfluidic microarrays for bacteria pathogenic detection based on various driving forces (i) Microfluidic microarray using active pump for injecting samples. (a) Schematic of the microfluidic chip consisting of the series of the microarray chamber. (b) Image of the microfluidic chip, which was connected to the step motor for injecting the sample into the chip. (c) Image of the fluorescent for detection of various influenza various subtypes. (ii) CD based microfluidic using centrifugal force.(a) schematic of the microfluidic platform for microarray hybridization. (a) PDMS microfluidic unit attached on a glass slide consisting of chambers 2 (3.5 µl), 3 (12 µl), and 4 (10 µl), which allow the reagents to flow through a middle micro-channel 5 to reach the hybridization chamber 1(140 nL). (b) Schematic view of the hybridization chamber showing the area of the chamber that can keep up to 150 nucleic acid capture probes spotted onto a glass slide. (C), the PDMS microfluidic chip is attached to a glass slide on which the capture probes are arrayed. The glass slide is placed on a CD support that can hold up to 5 biochips. The hybridization reagents are positioned to be pumped sequentially through the hybridization chamber using centrifugal force starting with chamber 2. (d) Detection of four different Staphylococcus subtypes and the fluorescent intensity.(iii) Bead based microfluidic microarray for DNA detection and quantification based on electrical impedance measurement. (a) Schematic of the bead, which the DNA was attached to the surface. The beads are injected through the microfluidic channel and are attached to the surface of the microarray. (b) Two
electrodes are fabricated at each side of micro-channel to measure impedance. Hybridization of the DNA into microarray causes the increasing of the resistant between two sides of the micro-channel. (c) Optical measurement and quantification of the DNA detection. The detection limit is 1 nM. (iv) Capillary based microfluidic microarray. (a) Schematic of the capillary microfluidic microarray. (b) The microfluidic consists of substrate of array, a spacer tape to provide flow pathway, a hydrophilic film, which enhance the substrate to fill by capillary force, inlet port and waste chamber. (c) The assay result and the array map corresponding to the image of each test (Adapted from [24],[29],[33],[38]). Table 2.2 Various non-isothermal PCR amplification techniques.
Multi-thermal description Reference
PCR -- [5]
Real-time PCR Measure real-time
monitoring of fluorophore during PCR amplification
[41, 44-46]
RT-PCR Reverse transcriptase PCR
which transform RNA into cDNA
[47-50]
Nested PCR Increasing the specificity by reducing of background of non-specific amplification
[42, 51]
Ligase PCR Provide better specificity by using small DNA linkers ligated to DNA and multiple primers annealing to DNA linkers
[52, 53]
Long range PCR Amplify templates more than 5k base pairs.
amplify multiple target in one solution.
Solid phase PCR Amplify target on the surface of the substrate by bounding primers on the surface and enhance parallel amplification on single chip.
[57, 58]
Hot start PCR Reduce non-specific amplification by increasing the pcr component to denaturation temperature.
[59, 60]
Touchdown PCR Reducing the non-specific background by gradually lowering the annealing temperature during PCR process.
[61, 62]
2.1.1.1.1 PCR microfluidics
PCR microfluidics offers a great benefit in many applications especially in POC. Mainly, it reduces the cost of tests as well as time-consuming sample preparation as well as post processing processes. It also increases portability and multiple parallel sample amplification and analysis.
With the advances and development of the PCR technique in 1986, there was no immediate implementation of miniaturization using PCR, probably due to the lack of experience with silicon microchips. Around 20 years after the first microfluidic chip was developed by Northrup et al [63], the concepts of microfluidic and PCR merged together by development of various different platforms. With the development of capillary electrophoresis (CE) in the chip [64] , the first CE-PCR was developed in 1996. Despite
the fact that CE and PCR was not implemented in the single chip in the integration platform, it opened up the path for integration of PCR with other pre/post DNA and amplicon processing in a single chip with a silicon and glass substrate.
In addition, main effort were focused on flow through PCR initially in Manz group by developing the idea of passing the PCR solution into the micro-channel passing through three different temperature zones (90°C, 50°C, 70°C) to provide adequate temperatures for denaturing, annealing and, extension, respectively [65]. This process, significantly reduce the temperature ramping time from one temperature to another, which reduces the amplification time significantly.
For microfluidic PCR, there are various primary designs, which were developed over the past two decades, which has been described in the Table 2.3.
Table 2.3 Microfluidic PCR design and description.
Design Description References
Single/multi chamber Stationary PCR
The PCR solution is amplified in a single/multi chambers
[63, 66-69]
Flow through PCR PCR flow solution is injected and passes through three different temperature zone as follow :denaturation temperature→extension temperature→annealing temperature
[65, 70-75]
Circular
arrangement PCR
Arrangement of three themperature zones in a circular format
[76-80]
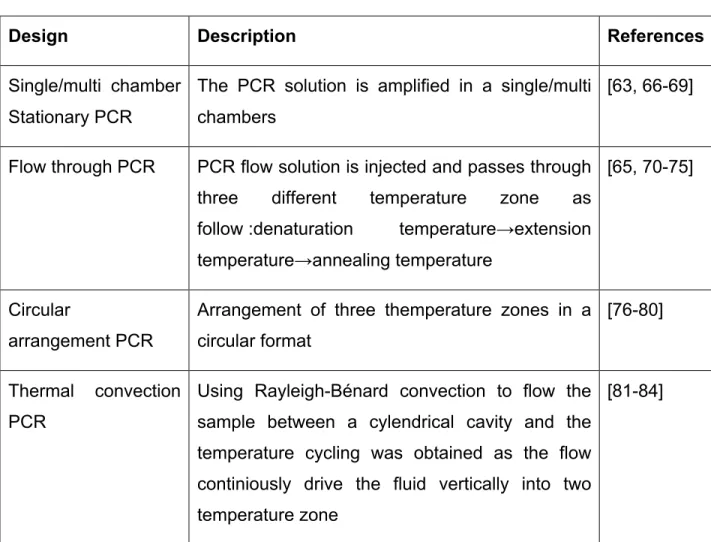
Thermal convection PCR
Using Rayleigh-Bénard convection to flow the sample between a cylendrical cavity and the temperature cycling was obtained as the flow continiously drive the fluid vertically into two temperature zone
Rotary chamber PCR Using rapid motor , microfluidic chip is rotating between three different temperature zone for each amplification cycle.
[85-87]
Droplet based PCR Generating a droplet of PCR mixture and passeing through three different temperature zone or three different thermal cycle.
[88, 89]
2.1.1.1.2 Nano/Pico litter PCR
The importance of miniaturization as well as reducing the sample size from microliter to pico liter and nano-liter provides the possibility of high throughput analysis as well as multiplexing in a limited volume sample. However, the main obstacle using PCR in the nano-liter volume is that sample may be los due to heat and evaporation. In order to overcome this obstacle, various engineering approaches have been developed. Liu et al developed a matrix microfluidic chip with three district function layer [90]. The matrix microfluidic layer was sandwiched between two layers with integrated hydraulic valves and pneumatic pumps. Each vertex of the matrix has 3nl reservoir for PCR reaction and the reagents are loaded from the rows and the DNA templates are injected from the column. The third layer provides 20×20 array of rotary pump to facilitate mixing of the reagents as well as DNA templates. The whole process of PCR using three thermal cycle takes place for 1 hour following by fluorescent colorimetric detection. Despite reducing the aliquot sampling as well as high throughput analysis, fabricating array of pumps and valves makes the platform costly and expensive and does not make the platform suitable for low cost analysis.
Droplet based microfluidics, can form small droplet size with nano-liter using pulse pressure which can be confined in a water-immiscible liquid such as mineral oil and completely prevent sample loss due to the evaporation [91]. For example, Leung et al fabricated a programmable, high throughput droplet-based microfluidic chip for cell sorting, cultivation and bacterial genome identification [92]. The chip contains 2D addressable array of chambers, reagent meter, cell sorting platform as well as integrated nozzle for automated collecting the reagent product without cross
contamination and can produce 133 pico-liter volume-droplets for detection and genome analysis of Salmonella typhimurium. Shen et al developed the slipChip® made out of glass for multiplexed PCR analysis with sample size of 30 nl for simultaneous detection of 5 different bacterial or fungal species [93]. Figure 2.3 shows various microfluidic chip designs for nano/pico litter PCR.
However, these methods have some drawbacks as well. In most of the cases, having three different precise thermal cycles is one obstacle in engineering aspect of LOC as it needs several thermal controller heating systems. Nevertheless, it requires highly equipped laboratory and skilled personnel. Also, the DNA extraction processing as well as purification, which is a highly time-consuming process. In order to apply this method in routine biosensor device for environmental or POC applications, there is an immense need of a compacting the device that can accomplish all the processes in a short period of time. Recently, great efforts has been put to accomplish the development of PCR microchip to meet the requirements of miniaturized micro- total- analysis system (microTAS) and can be applied as diagnostics [94].
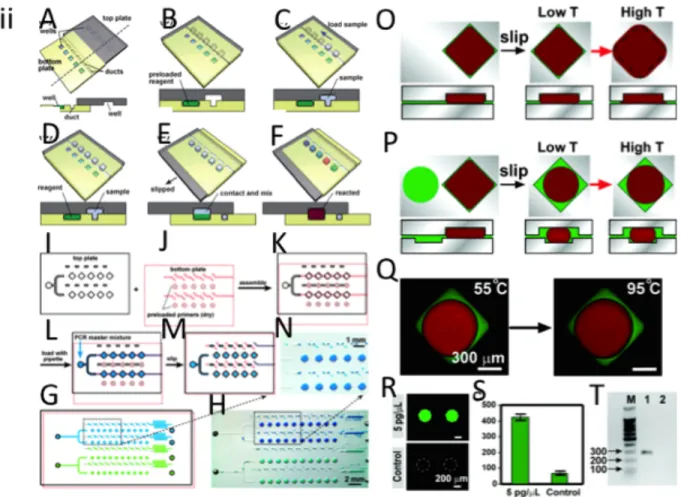
Figure 2.3 Microfluidic NanoPCR Chips. (i) Microfluidic matrix chambers for high-throughput nano PCR chips. (A) Schematic representation of matrix chip with N=20 and showing the input and output layouts. The small reactor unit has been shown in the upper left and different colors show with green (control line) , DNA polymerase (yellow), primers (red), rotary pump (white). (B) Two color fluorescence emission image for PCR analysis and Yellow represent the positive signal and no primer/ negative control shows red the negative one. The odd rows were filled with the forward primer and column even numbers was filled with reverse primer. The correct combination of forward and reverse primer in one chamber only shows that PCR sample works properly. (C) Fluorescence intensity ratio vs initial cDNA template. The fluorescent intensity was taken after 20 cycle of the PCR. (ii) Programmable droplet based microfluidic for single bacteria analysis. (A) Microfluidic device schematic showing the elution nozzle. (B) Schematic of microfluidic addressable array consist of 95 chamber organized in 19 rows and 5 columns. (C) Schematic of the single chamber for droplet immobilization and coalescence using flow controlled wetting. (1) Before passing the sample to the chamber, the walls were lubricated to prevent wetting. (2) Side channels provide a bypass for the oil, which was shown by green arrows. (3i) Below the critical velocity wetting takes place and the droplet positioned at the entrance of the chamber. (3ii) Above the critical velocity, the droplet does not wet and it goes through the chamber. (D) Micro image of one chamber consist of 2.7 nl of water sample. (E) Schematic of cell sorting module. The cell-sorting module consists of a
On chip culturing of single bacteria in a chamber microfluidic. Growth trend of each sample with different cell numbered based on (G) green fluorescent protein (GFP), and (H) red fluorescent protein (RFP) with respect to time. (I) Combined bright field and fluorescent image of single RFP expressing cell in a droplet. (J) Normalized plot of GFP and RFP fluorescent in scattered micro-channel for mixed cultures seeded with different number of both bacteria strain. (K) Confocal image of cultured array which was stored in droplets, with various seeded cells (1) a single cell, (2) a single cell of each strain, (3) 1000 cells of each strain, (4) 100 cells of each strain (5) 10 cells of each strain, (6) 100 GFP expressing cell (7) 100 RFP expressing cell. (iii) SlipChip schematic representation. (A-B) Schematic of the preloaded bottom wells, ducts at the bottom level as well as wells at the top chip. (C-D) Loading the sample in the duct and bottom wells as well as upper well chip. (E-F) Slipping the top layer to the bottom layer disconnects the upper samples from the duct and overlap bottom and top samples together which cause the mixing two samples together. (G-N) Schematic of the digital PCR using SlipChip.(O) Analysis of thermal expansion of chambers during thermal cycling by using different geometries. The master mix PCR solution (red) and mineral oil (green) was filled in the chamber. By slipping, mineral oil surround the PCR master mix in the low temperature (low T) and by increasing the temperature, the solution enter between the gap between the two plates of the SlipChip (High T) (P) Top and side view of schematic representation of shallow circular well. By slipping, the aqueous PCR mater mixes form to droplet due to surrounding by hydrophobic chamber. By increasing the temperature in the chamber, mineral oil moves outside of the well and goes between the two plates of the chip (High T). (Q) Micrograph of experiment, which was represented on (P). (R) Micro-image of fluorescent intensity in PCR result of S. aureus DNA. Negative Control (NC) shows no fluorescent intensity. (S) Analysis of fluorescent intensity between amplified PCR sample and NC.(T) Gel electrophoresis image of PCR amplicon in SlipChip with 100 bp DNA ladder . The first column contains the sample from PCR product taken from SlipChip and shows 270 bp band. The second column consist the sample from negative control, which shows no band. Adopted with the permission from [91-93].
2.1.1.2 Isothermal amplifications
Limitations of PCR have led to the use of isothermal amplification, which provides genomic amplification in a rapid and low-cost manner at single temperature only. Various isothermal amplification methods have been developed over the past decade, which meets the demand, of needs of nucleic acid amplification. Isothermal amplifications are different from PCR techniques in a sense that the rate of enzyme activity is a limiting factor for amplification whereas in PCR, it is the rate of cycling. Consequently, it is unlikely for microfluidic isothermal amplification to increase the rate of enzymatic reaction by changing the thermal cycling.
2.1.1.2.1 Nucleic acid sequence based amplification (NASBA)
Nucleic acid sequence based amplification is an isothermal amplification technique, which amplify the target gene based on rotavirus RNA replication. NASBA is highly
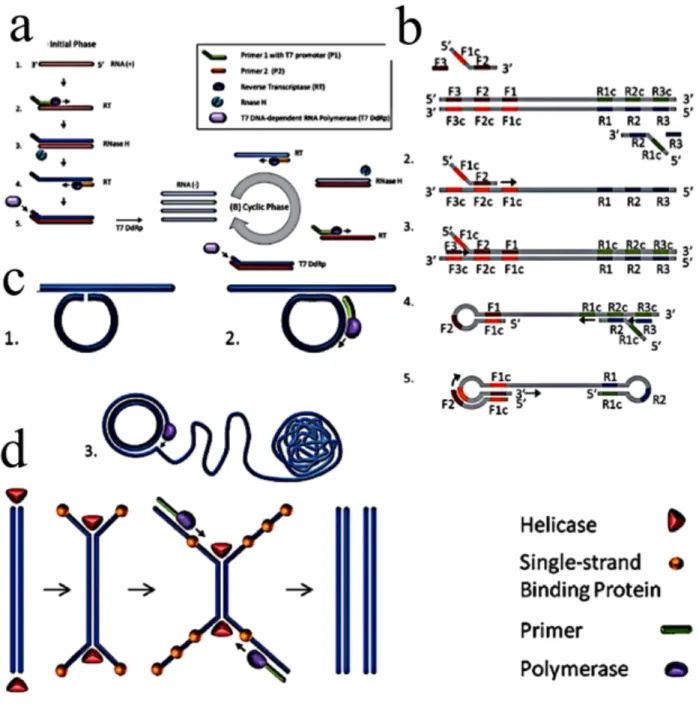
specific for the target RNA sequence and has gained popularity for amplification in clinical and environmental applications since introduction in 1991[95]. The whole process is based on using two primers and three reverse transcriptase enzymes, namely, R Nase H, T7 RNA polymerase. The first primer is attached to the complementary site at 3’ end of the template. Subsequently, reverse transcriptase destroys the RNA template and forms the complementary DNA strand and the second primer attaches to the 5’ site of the cDNA template. T7 RNA polymerase continuously polymerizing the templates which takes place at 41°C. The NASBA amplicon can be detected by various means and methods such as real time optical technique, lateral flow assay, electrochemiluminescence, or electrochemical techniques. The simplicity, sensitivity as well as amplification at low temperature make it highly desirable for portable diagnostic devices. However, using three enzymatic reaction as well as, using RNA as a template makes this technique limited in some application that use DNA as the template.
2.1.1.2.2 Rolying cycle amplification (RCA)
Rolling cycle amplification (RCA) is another amplification technique that employs one enzyme and one primer only. The padlock probe first anneals to the single stranded DNA, forming a circle with small gap that is sealed by ligation. The RCA reaction is initiated using a polymerase enzyme. Subsequent strand displacement forms a long chain with the template of ssDNA in a sphere shape. RCA requires 37°C temperature for amplification in less than an hour. Simplicity as well as using one primer makes it very attractive method for amplification. However, lack of specificity is a main drawback of this system and development of specific molecular probe is required to increase the assay’s precision.
2.1.1.2.3 Strand displacement amplification (SDA)
Rolling cycle amplification (RCA) is another amplification technique that employs one enzyme and one primer only. The padlock probe first anneals to the single stranded DNA, forming a circle with small gap that is sealed by ligation. The RCA reaction is initiated using a polymerase enzyme. Subsequent strand displacement forms a long
for amplification in less than an hour. Simplicity as well as using one primer makes it very attractive method for amplification. However, lack of specificity is a main drawback of this system and development of specific molecular probe is required to increase the assay’s precision.
Strand displacement amplification (SDA) uses two primers for amplification and like NASBA it requires multiple enzyme to proceed amplification. SDA requires multiple enzymes (e.g., a thermo-stable polymerase and restriction enzyme). However, it requires multiple primers in a specific order (four total) to amplify the target sequence and displace the copied sequence. An additional difference is its use of a chemically modified deoxynucleotide base (thiolated dCTP). The amplification process uses two phases: the target generation phase and the amplification phase. In the target generation phase, an engineered primer that has a restriction enzyme site incorporated into it binds to its complementary target and initiates strand synthesis using a thermo stable polymerase. A bumper primer displaces the strand generated from the primer containing the restriction enzyme site. Because the newly generated strands incorporate thiolated dCTP, they are not susceptible to restriction enzymatic digestion. A thermo-stable restriction enzyme introduces a single-strand nick in the double-stranded molecules. The thermo-stable polymerase then extends the new strand and thereby displaces the strand 3′ to the nick. Ultimately, new strands that incorporate this restriction enzyme site lead to the exponential generation of target copies.
2.1.1.2.4 Helicase dependent amplification (HDA)
Helicase-dependant amplification (HDA) is another isothermal amplification technique, which makes the helicase enzyme available to open the double stranded DNA in order to facilitate the primers hybridization, extention and formation of two copies. This mechanism operates at the same temperature range as LAMP, but it is simpler because it requires two enzymes and like PCR, only two specific target oligos. However, compared to the LAMP method, it takes longer time to copmplete.
2.1.1.2.5 Loop-mediated isothermal amplification (LAMP)
Loop-mediated isothermal amplification (LAMP) is one of the most common isothermal amplification methods. The final result can be analyzed either by fluorescence intensity
measurement or by the naked eye for turbidity due to the precipitation of magnesium pyrophosphate as a by-product, which makes it suitable for locations with limited resources. The entire LAMP method is accomplished at a static temperature (60-65 °C). The target DNA is amplified by the use of multiple primers, including loop primers and Bst polymerase, resulting in an amplification rate of 109 target nucleotides (i.e., 1 billion DNA copies) within 15–60 minutes at a single, static temperature. The whole principle of LAMP is based on using one polymerase enzyme with de-strand displacement activity and 4-6 sets of primers which was first published in 2000 [96]. There are two outer primers (F3, B3) and two inner primers (FIP, BIP). FIP and BIP are forward and backward two inner primers. LAMP amplification has two initial step and cycling step. In the initial step all four primers take part to the amplification. Yet, in the cycling step only inner primers continue the amplification. The mechanism start with the inner primer of FIP which hybridize in the specific region and outer primer hich is a bit shorter than FIP hybridize to the specific region of DNA and with the bst polymerase with displacement activity initial de-stranding the dsDNA into ssDNA template. Later on, from the other side of the template, BIP and B3 hybridize to the template and form a loop structure. This loop structure acts as the initial template for the cycling step. By subsequent self-prime annealing of self-primers a billion copies of the loop structure molecule is formed with the cauliflower loop structure. The use of four–six sets of primers makes this technique very specific to the target DNA in comparison with other amplification technique such as PCR. Figure 2.4 shows the schematic of various isothermal amplification techniques. Recent advances in LOC devices based on LAMP have been developed over the past years and it is reviewed in Appendix I.
2.1.2 Electrochemical techniques
Electrochemical biosensors use various electrochemical techniques to detect bio-analytes, which are mainly potentiometric, voltametric and impedance. Potentiometric measures collected potential/charges at the surface of the electrode with respect to a reference when there is no current flow and provides data on ion activity. Impedimetric
on measurement of the generated current on the surface of a sensor in response to the applied voltage. Generally, most electrochemical biosensors are composed of three-configuration electrodes of working electrode (WE), Counter electrode (CE) and reference electrode (RE). WE is the electrode where electrochemical reaction takes place. The purpose of CE is to complete the electrical circuit which is responsible of transfering the electrochemical signal from WE to the Potentiostat, completing the circuit to perform current measurement and control potential variance that cause damage of sensitive surface of WE.

![Figure 2.10 Schematic of various biomolecules and their length scale ranging from angstrom (water) to tens of micrometer (cancer cells)[121]](https://thumb-eu.123doks.com/thumbv2/123doknet/5392647.125440/57.918.124.757.498.717/figure-schematic-various-biomolecules-length-ranging-angstrom-micrometer.webp)