OATAO is an open access repository that collects the work of Toulouse
researchers and makes it freely available over the web where possible
Any correspondence concerning this service should be sent
to the repository administrator:
[email protected]
This is an author’s version published in:
http://oatao.univ-toulouse.fr/24347
To cite this version:
Ganfoud, Nidhal and Sene, Assane
and Haefele, Matthieu and Marin-Laflèche,
Abel and Daffos, Barbara
and Taberna, Pierre-Louis
and Salanne, Mathieu
and Simon, Patrice
and Rotenberg, Benjamin Effect of the carbon microporous
structure on the capacitance of aqueous supercapacitors. (2019) Energy Storage
Materials, 21. 190-195. ISSN 2405-8297
Effect of the carbon microporous structure on the capacitance of
aqueous supercapacitors
Nidhal Ganfoud
a, Assane Sene
b,c, Matthieu Haefele
d, Abel Marin-Lafl!eche
d, Barbara Daffos
b,c,
Pierre-Louis Taberna
b,c, Mathieu Salanne
a,c,d, Patrice Simon
b,c, Benjamin Rotenberg
a,c,*aSorbonne Universit"e, CNRS, Physico-chimie des "electrolytes et nano-syst!emes interfaciaux, PHENIX, F-75005, Paris, France bCIRIMAT, Universit"e de Toulouse, CNRS, INPT, UPS, 118 Route de Narbonne, 31062 Toulouse Cedex 9, France cR"eseau sur le Stockage Electrochimique de l’Energie (RS2E), FR CNRS 3459, 80039 Amiens Cedex, France
dMaison de la Simulation, USR 3441, CEA, CNRS, INRIA, Universit"e Paris-Sud, Universit"e de Versailles, F-91191, Gif-sur-Yvette, France
A B S T R A C T
Using a combination of cyclic voltammetry experiments and molecular dynamics simulations, we study the effect of microporous carbon structure on the performance of aqueous supercapacitors using carbide derived carbon (CDC) electrodes. The structures investigated by molecular simulations are compatible with the experimental results for CDC synthesized at 800!C, but not with the other two materials (CDC-1100 and YP-50F), which are more graphitic. In fact, the specific capacitance obtained for the latter two are in good agreement with molecular simulations of graphite electrodes, assuming that all the charge is localized in the first plane in contact with the electrode (a very good approximation). Our molecular simulations further allow to examine the solvation of ions inside the electrodes. Unlike what was observed for large organic ions dissolved in acetonitrile, we find that most Naþcations remain fully solvated. Overall, microporous carbons such as CDCs are good candidates for
applications involving aqueous supercapacitors, in particular the harvesting of blue energy or desalination, but their performance remains to be optimized by tailoring their microstructure.
1. Introduction
Nowadays, with the increase of the world population, the demand for energy is growing rapidly and has become a major societal and geopo-litical issue. In the last 50 years, the energy consumption has increased six times and studies predict a further doubling of energy consumption by 2050. On the one hand, fossil fuels (oil, natural gas, coal), which account for about 85% of the total energy supply, have a negative impact on the environment and generate significant emissions of greenhouse gases which lead to global warming and climate change. On the other hand, the use of fossil fuels will be limited in time due to the depletion of available resources, and resort to alternative energy sources is urgent. Among the various possibilities of renewable energies, “blue” or osmotic energy, which aims at recovering the entropy from mixing of fresh and salty water (e.g. in estuaries), has the advantage of being non-intermittent and could provide a significant contribution to the mix of electricity pro-duction sources on the global scale [1–4]. Nevertheless, the efficient harvesting of this energy remains a great practical challenge.
In this context, electrochemical devices are likely to play a crucial role, either to store the electric current produced by diffusio-omosis with new generations of membranes [5,6], or at the core of alternative
approaches such as Capacitive Mixing [7–10]. This process involves the charge/discharge of electrodes, successively using solutions with different salt concentration as electrolytes. In such Electric Double Layer Capacitors, or supercapacitors, the charge is stored by adsorbing the ions of the electrolyte on the surface of the electrodes. In order to maximize this adsorption, carbide-derived carbons (CDCs) are a promising family of electrode materials. Their main advantage is that they are mostly microporous, with a very well-controled pore size distribution depending on the synthesis temperature and carbide precursor. One of the key factors governing the capacitance is the carbon local structure, which plays an important role in the process of the charge and the discharge of the electrodes. Hence, a fundamental understanding of the effect of carbon structure is essential to predict the capacitance and to optimize the energy storage device.
A second essential feature influencing the capacitance value is the electrolyte local structure, since the charge compensation at the surface of the electrode is governed by the adsorption properties of the ionic species. In principle, increasing the contact surface area between the liquid and the electrode material should generally lead to better perfor-mances. However, it was shown recently for ionic liquid electrolytes that the degree of confinement of the various adsorption sites plays a major
* Corresponding author. Sorbonne Universit"e, CNRS, Physico-chimie des "electrolytes et nano-syst!emes interfaciaux, PHENIX, F-75005, Paris, France.
E-mail address:[email protected](B. Rotenberg).
2.2. Molecular dynamics simulations
The simulation cell consists of two CDC-based electrodes and an aqueous electrolyte composed of sodium chloride salt dissolved in water. We have used similar supercapacitor cells to the ones described in our previous work [10]. Two different CDC electrodes, denoted CDC-1 and CDC-2 in the following, as well as graphite electrodes, were studied with the same electrolyte (aqueous NaCl) at two different salt concentrations 1.0 and 0.5 mol L#1. The CDC electrodes were obtained by quenched molecular dynamics [17] and consist of 3821 and 3649 atoms for CDC-1 and CDC-2, respectively. Their structure will be described in more detail below. In the case of CDCs, repulsive walls are placed on both extreme sides of the non periodic dimension of the simulation cell to prevent the mobile molecules from exiting. As discussed below, both CDC-1 and CDC-2 serve here as models for the experimental CDC-800, while the experimental performance of CDC-1100 is rationalized using insights from the planar electrodes.
The system corresponding to CDC-1 with an electrolyte salt concen-tration of 1.0 M (resp. 0.5 M) contains 7615 (resp. 7700) water molecules and 139 (resp. 70) NaCl ion pairs, while for CDC-2, the concentration of 1.0 M (resp. 0.5 M) corresponds to 8800 water molecules and 160 (resp. 80) NaCl ion pairs. The box dimensions for CDC-1 (resp. CDC-2) are 43.3 $ 43.3 $ 183.0 #A3 (resp. 43.7 $ 43.7 $ 186.4 #A3). These di-mensions, combined with the above-mentioned number of atoms lead to the correct density of water in the bulk region between the two elec-trodes. For the graphite case, the system consists of three layers of gra-phene in each electrode containing 1440 carbon atoms per electrode and 2200 water molecules with 40 NaCl pairs, leading to a concentration of 1.0 M. The box dimensions are 34.1 $ 36.9 $ 67.9#A3.
Following the approach detailed in Refs. [18,19], the electrode is modeled as a perfect conductor, i.e. a fixed potential difference of ΔΨ ¼ 1 V is imposed between the two electrodes and the charge of each electrode atom is recomputed at each step of the molecular simulation, leading to the fluctuation of the (local and total) charge of the electrode in response to the instantaneous microscopic configuration. This method was previously shown to be suitable for the simulation of ionic liquids, organic electrolytes as well as aqueous electrolytes in nanoporous carbon electrodes [10,11,20–24]. We used an in-house code dedicated to such classical MD simulations of metallic electrodes. The potential difference of 1.0 V is chosen to be as high as possible in order to maximize the ef-fects and hence improve the sampling of the properties, while staying within the electrochemical window of water (1.23 V).
The simulations are conducted in the NVT ensemble with a timestep of 1 fs. The temperature of the electrolyte is maintained at room tem-perature (298 K) by applying a Nos"e-Hoover thermostat with a time constant of 1 ps while the electrode atoms are fixed. Two dimensional periodic boundary conditions are used, so that there is no periodicity in the direction perpendicular to the electrodes (z direction). Short-range interactions are computed using a cut-off radius equal to half of the shortest box length, while the computation of electrostatic interactions involves an Ewald summation in 2D (x and y directions only) for the combination of point charges (for the electrolyte) and Gaussian charges (for the electrode atoms) as described e.g. in Refs. [18,25]. The force field consists of a sum of coulombic and Lennard-Jones interactions. Lorentz-Berthelot mixing rules were applied for Lennard-Jones parame-ters. The SPC/E model was used for water molecules [26] that are kept rigid using the Shake algorithm [27,28]. Interaction parameters for carbon atoms and for ions are taken from Refs. [29,30]. The systems are first preequilibrated by fixing the electrode charges to zero (about 600 ps for the CDCs, 2 ns for graphite), then under constant potential conditions. Once a steady state is reached, equilibrium trajectories are sampled for about 10 ns (resp. 17 ns) for the two CDC systems (resp. graphite) to compute all the relevant properties such as capacitance, number density profiles, as well as solvation numbers.
role [11], which leads to situations where materials with an optimal accessible surface area do not show a large enhancement of the capaci-tance [12]. The importance of the degree of confinement was recently confirmed in the case of aqueous solutions by Prehal et al., who com-bined modelling with in situ X-ray scattering inside nanoporous carbon supercapacitors [13].
Unlike the case of ionic liquids, only a few studies on the structure and the capacitance of concentrated aqueous electrolytes inside nanoporous carbon electrodes have been reported. We have recently shown [10] for a single CDC structure that conventional theories should be applied with some caution under conditions relevant to the context of blue energy, due to i) the large ionic concentration and ii) the strong confinement effect. Molecular dynamics simulations then appear as an efficient tool to quantitatively predict the capacitance and the ion adsorption capacity, and to get access to the microscopic processes occurring inside the electrode. It can further be used to parametrize more conventional the-ories to extrapolate to other conditions (e.g. at low salt concentration).
In this work, we investigate the effect of the nanoporous carbon structure on the capacitive properties of supercapacitors using NaCl so-lutions as electrolytes, at concentrations which are representative of sea water (0.5 and 1 mol L#1). We compare the experimental values obtained for two different CDC materials by cyclic voltammetry to the simulation values obtained for two CDC structures as well as a graphite electrode. The simulations involve a constant-potential method to simulate realis-tically the electrochemical conditions. Experiments show that the CDC carbon with both the lower average pore size and the smaller graphitic character has a larger capacitance. The simulations made with the CDC yield very similar capacitance despite the different porosities, pointing towards a prominent role of the graphitization, a result which is further confirmed by the results obtained with the pure graphite electrode. 2. Systems and methods
2.1. Electrochemistry experiments
Microporous Carbide Derived Carbons (CDC) powders (Carbon-Ukraine) were prepared by chlorination of TiC powder at 800!C or 1100!C as reported elsewhere [14,15]. CDC powders were further annealed for 2 h at 600!C under H
2 to remove traces of chlorine and other surface groups. The resulting materials were denoted as CDC-800 and CDC-1100, respectively. CDC carbons show 100% of the porous volume in the microporous range (< 2 nm) [14,15]. A commercial actived carbon YP-50F (coconut shell-derived carbon from Kuraray Chemical Co., Japan) was also used for comparison purpose [16]. The specific surface area is 1730 m2 g#1 and the total porous volume is 0.75 g cm#3. YP-50F shows an average pore size of 0.9 nm with 92% of pores being smaller than 2 nm and 8% of mesopores, while the other two are exclusively microporous.
Electrochemical tests are performed using two-electrode Swagelok cells. Active films are made by mixing 95 wt% CDC with 5 wt% poly-tetrafluoroethylene (PTFE from Dupont™) binder. Once calendered, 11 mm diameter electrodes are cut. The active film thickness is around 300 μm, with a weight loading of 15 mg cm#2. Platinum disks are used as
current collectors and two layers of 25 μm-thick porous cellulose (from
Nippon Kodoschi Corporation, NKK) as a separator. Cyclic voltammetry experiments are carried out with a multi-channel potentiostat (VMP3, Biologic), for two NaCl concentrations (0.5 and 1 M) at a scan rate of 1 mV s#1. Two series of measurements per system for two ranges, be-tween 0.0 and 0.6 V and bebe-tween 0.0 and 0.7 V, are performed, leading for each of them to four estimates of the capacitance. The values and uncertainties reported here are the corresponding averages and standard deviations. Such voltages are sufficiently low to avoid faradaic (redox) processes linked with water decomposition on the high surface area carbon electrodes.
3. Results and discussion
3.1. Capacitance
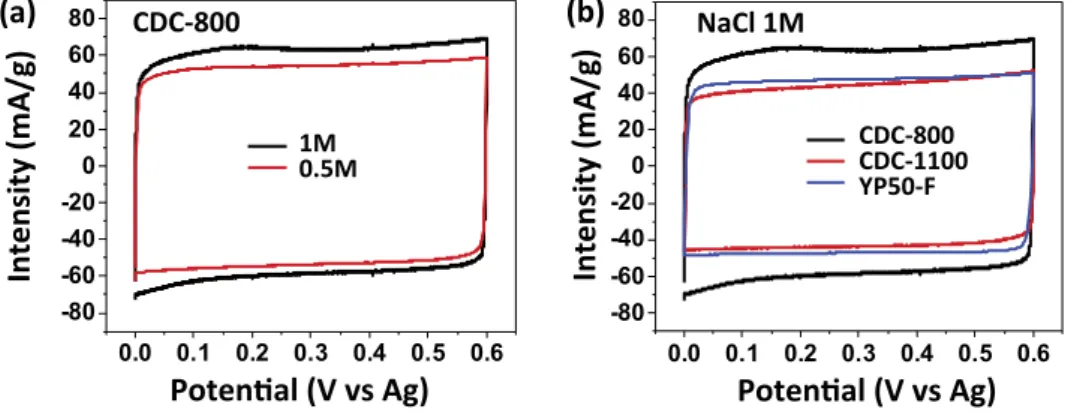
Fig. 1displays the cyclic voltammograms (CV) for i) two different salt concentrations and ii) three different microporous carbons, for potentials varying between 0.0 and 0.6 V (to stay within the electrochemical sta-bility potential window of water). The rectangular shape of the CV is typical of a capacitive electrochemical response in the considered range of concentrations and voltages. The experimental capacitance is then determined by differentiating the electrode charge with respect to the potential. The latter is obtained by integrating the electric current during the discharge of the electrochemical cell. In molecular simulations, the integral cell capacitance is computed from the average charge hQi of the electrodes:
Ccell¼ hQi=ΔΨ (1)
It is related to the capacitance of the two electrodes as 1
Ccell¼
1
Cþþ 1
C#.
Each of them can then be obtained by assuming that the electrodes behave symmetrically (Cþ ¼ C#). The experiments performed using a
3-electrode cell confirm that this assumption is reasonable since C#is only
slightly larger than Cþ(by less than 10%).
The capacitances corresponding to the CVs ofFig. 1are summarized inTable 1. The values for CDC-800 are consistent with those previously reported for the same material [10]. The increase in capacitance with salt concentration is relatively limited compared to the Debye-Hückel pre-diction (increase as the square-root of salt concentration), which is not unexpected in this high concentration range.
The effect of the carbon material is much larger. Since CDC-800 contains smaller pores than the other two materials, a larger capaci-tance is not unexpected, however the effect is much more pronounced than previously reported for aqueous electrolytes, for which alkali cat-ions and the chloride anion generally do not show strong sieving effects for the pore size range we investigate [31]. This suggests that the carbon structure plays a role beyond the average pore size. In particular, the extent of graphitization may contribute to the observed differences be-tween the microporous carbons. Large planar surfaces should indeed be detrimental since they do not promote enough the confinement of the adsorbed ions [11,13].
3.2. Effect of the microporous structure
In order to investigate the effect of the carbon structure, we compare the simulation results for the capacitance obtained for the two carbon structures shown inFig. 2a. The pore size distribution in both materials, computed using the software Zeoþþ [32,33] with a probe of radius of 1.3 Å (comparable to water molecule size), are shown inFig. 2b. The pore
sizes for CDC-1 (resp. CDC-2) are in the range 3-14 Å (resp. 3-17 Å) with an average of 7.5 Å (resp. 9 Å). Geometrical analysis of the nanoporous structure results for CDC-1 (resp. CDC-2) in a porosity of Φ ¼ 23:3% (resp. Φ ¼ 35:0%) and a specific surface area of SSA ¼ 1934 ( 2 m2g#1 (resp. 1857 ( 2 m2g#1). The two carbons also have different mass den-sities, ofρsolid ¼ 0.939 g cm#3and 0.872 g cm#3, respectively.
Based on the pore size distribution analysis, the CDC-1 was shown by Palmer et al. to be consistent with an experimental structure of a CDC synthesized at 800!C. While the average pore size of CDC-2 corresponds approximately to the average pore size of the experimental CDC-1200 (synthesized at 1200!C), it contains much less graphitized areas than the experimental CDC-1200 and CDC-1100 [17]. In fact, recent data obtained from X-ray diffraction (XRD), suggests that the local structure inside the CDC-2 resembles that of CDC synthesized from silicon carbide (SiC), rather than titanium carbide (TiC) as in the present experiments, as illustrated inFig. 2c [34]. Therefore, both CDC-1 and CDC-2 serve here as models for the experimental CDC-800, while the experimental perfor-mance of CDC-1100 is rationalized later using insights from the planar electrodes.
The specific capacitances (per unit mass of the electrode) from mo-lecular simulations of the two electrode materials, with the same aqueous NaCl electrolyte at two different concentration (0.5 and 1.0 M), are summarized inTable 2. Both of them yield capacitances that are in good agreement with the experimental results ofTable 1for CDC-800, with a difference of )10% in both cases (with CDC-1 underestimating it while CDC-2 overestimates it). The relative increase with concentration is also similar, even though not quantitative.
This is consistent with the structural analysis of the carbons, since CDC-1 shows a pore size distribution typical of CDC-800 while CDC-2 has a slightly larger average pore size but a very similar local structure as shown in the structure factors comparison. The larger capacitance ob-tained with CDC-2 compared to CDC-1 confirms that even if small pore sizes are necessary to confine the ions, knowing the average pore size is not sufficient to predict the capacitance, and that it is necessary to have a correct representation of the pore shape as well. Note that a larger spe-cific capacitance was already obtained in our previous simulations of CDC-2 (denoted CDC-1200 in Ref. [23]) in contact with ionic liquids as electrolytes.
The larger specific capacitance of CDC-2 also correlates with its lower
Fig. 1. Cyclic voltammograms of electrochemical cells based on microporous carbons and aqueous solutions of sodium chloride as electrolytes: (a) for CDC-800 and two concentrations (0.5 and 1 M); (b) for 3 carbons (CDC-800, CDC-1100 and YP-50F) at an electrolyte concentration of 1 M. The potential scan rate is 1 mV s#1in all cases.
Table 1
Electrode specific capacitance (in F g#1) from cyclic voltammetry.
Carbon structure Salt concentration Capacitance (F g#1)
CDC-800 0.5 M 113(3
1 M 123(3
CDC-1100 1 M 87(3
density (larger porosity), which results into more ions inside the pores per unit mass of carbon, and fewer small pores, so that the access of the ions from the bulk electrolyte into the pore is less hindered. The composition of the liquid inside the electrodes can be determined from the density profiles shown inFig. 3, which clearly indicates that the main charging mechanism is ion exchange, i.e. the replacement of anions (resp.
cations) by cations (resp. anions) in the negative (resp. positive) elec-trode. The capacitance of the system, i.e. the amount of electronic charge stored inside the electrode material, is then determined by the extent to which the electrode can accommodate such a net charge in the confined electrolyte (which compensates that of the electrode).
Table 3summarizes the number of cations and ions inside the elec-trodes (and the region corresponding to the bulk electrolytes), for the two simulated systems under a voltage of 1 V. It shows that not only the total number of ions inside the pores, but also the charge imbalance is larger in CDC-2 than CDC-1. Since the size of the electrode is comparable in both simulated systems, this means that the larger specific capacitance (charge per unit mass of electrode) is not only due to the smaller mass density of CDC-2. Together with the fact that the surface area per unit volume (SSA divided by mass density) is slightly larger in CDC-2 than CDC-1, this underlines the importance of the interface between the carbon and the electrolyte – as expected for supercapacitors.
3.3. Planar electrodes
Going back to the cases of CDC-1100 and YP-50, our simulations with the CDC-1 and CDC-2 electrodes cannot be used to interpret the experi-mental results because these carbons have a local structure which has a stronger graphitic character. We have therefore performed additional simulations of the NaCl-concentrated electrolytes in contact with a pure graphite electrode to gain further insight. As discussed in Ref. [35], for planar electrodes the best metric is the capacitance per unit area, since the mass of the electrode depends on the number of graphite planes,
Table 2
Electrode specific capacitance (in F g#1) from molecular simulations for the two carbon structures CDC-1 and CDC-2.
Salt concentration Capacitance (F/g)
CDC-1 CDC-2
0.5 M 103 ( 2 124 ( 3
1.0 M 107 ( 3 135 ( 3
Fig. 3. Density profiles along the z axis perpendicular to the electrodes for CDC-1 (top) and CDC-2 (bottom) with the same salt concentration of CDC-1.0 M for both systems. The negative (resp. positive) electrode is on the left (resp. right) side.
Table 3
Average number of cations and anions numbers inside both electrodes and in the bulk electrolyte, for both systems under a voltage of 1 V.
System Negative electrode Bulk Positive electrode
Nþ N# Nþ N# Nþ N#
CDC-1 27 ( 2 6 ( 1 108 ( 2 110 ( 2 4 ( 0:7 22 ( 1 CDC-2 35 ( 1 7 ( 1 119 ( 2 120 ( 2 7 ( 1 33 ( 2 Fig. 2. (a) Snapshots of the two carbon structures CDC-1 and CDC-2 simulated in the present work. (b) Pore size distribution for CDC-1 and CDC-2 electrodes calculated using a probe with radius 1.3 Å, corresponding to the size of a water molecule. (c) Structure factor computed from the atomic positions for 1 and CDC-2, compared with X-ray diffraction experiments on CDC synthesized from silicon carbide (SiC) of Ref. [34].
Table 4
Electrode surfacic capacitance (inμF cm#2) of graphite electrodes, with a 0.5 M
and 1 M aqueous NaCl solutions as electrolytes, obtained by molecular simulations.
Electrolyte concentration (mol L#1) 0.5 1.0 Surfacic capacitance (μF cm#2) 6:9 ( 0:7 6:9 ( 0:7
while most of the charge is stored in the first plane in contact with the electrolyte. Nevertheless, for comparison purposes it is useful to estimate the specific capacitance by assuming that all the charge is located in the graphite plane in contact with the electrolyte (which is a very good approximation, of the order of 3%).
The capacitance per unit area of graphite electrode, using aqueous NaCl solutions as electrolyte, is reported inTable 4for two concentra-tions. We first note that within the accuracy of our simulations, the capacitance is independent of concentration in this high concentration regime. Converting the surfacic capacitance to specific capacitance, within the above approximation, leads to an estimate of * 90 F g#1, which is comparable to that of CDC-1100 and YP-50F (see Table I). Even though in these materials not all the interface is purely graphitic and not all the carbon atoms are in contact with the electrolyte, this confirms the importance of the degree of graphitization in the performance of the electrode material.
3.4. Ion solvation
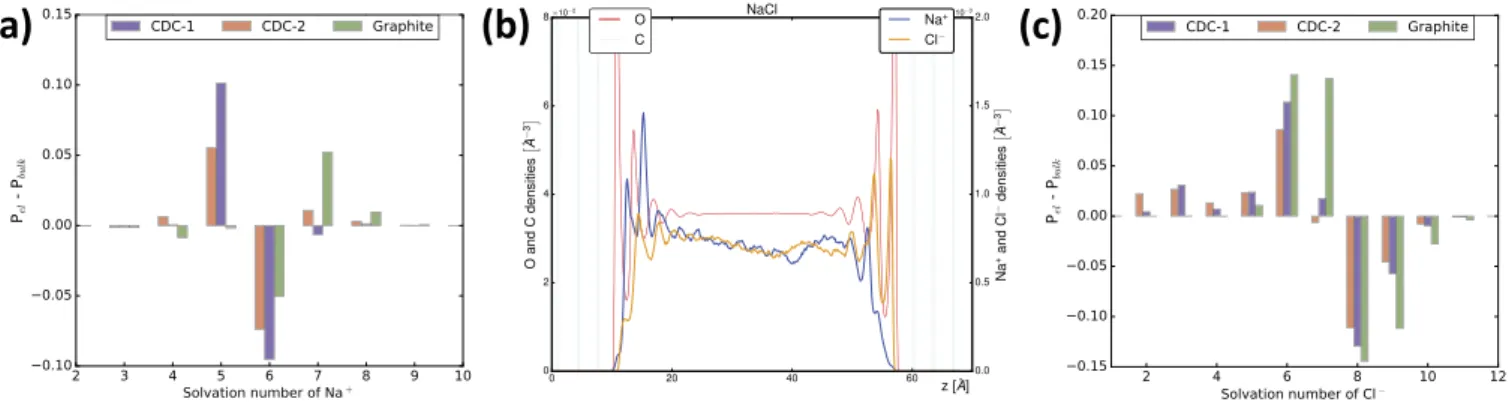
Finally, molecular simulations also give access to information that is difficult to obtain experimentally than the electrode capacitance, in particular pertaining to ion solvation inside the electrodes. Conventional electrochemical techniques such as CV are not sufficient and it is for example necessary to use electrochemical quartz crystal microbalance [36] or sophisticated in situ diffraction techniques [13]. In contrast, simulations provide a high level of details on the local structure. For example, the solvation number of an ion is easily defined as the number of water molecules located in its first solvation shell, the latter being defined by a cutoff radius which is determined beforehand from the position of the first minimum observed in the radial distribution func-tions between the water and each ion. The corresponding cutoff radius are the following: 3.9 Å and 3.3 Å for Cl#and Naþ. Here we investigate how the adsorption of ions inside the microporous structure (for CDC-1 and CDC-2) or within the first layer of ions at the surface of graphite (see below) modifies their solvation shell with respect to the bulk electrolyte.
As shown onFig. 4a, the desolvation effect is rather scarce for Naþ cations, with small differences in solvation numbers for the sodium ions adsorbed at the surface of the electrodes and in the bulk: In contrast to organic ions dissolved in acetonitrile [11], which can lose several solvent molecules from their solvation shell, most of the sodium ions remain fully solvated. However, a fraction of them (around 10%) lose one water molecule in the case of the microporous carbon, while almost no effect is seen in the case of graphite. For the latter, the density profiles (Fig. 4b) show that the sodium ions adsorbed at the surface of the electrode lie between two molecular layers of water, so that they can keep their sol-vation shell intact.Fig. 4c finally shows that the desolvation of Cl#anion
is more pronounced that of Naþcations for all electrodes, with a typical loss of 1–2 molecules, or even more in the case of the CDCs. In the case of graphite (Fig. 4b), the position of the first layer of chloride anions co-incides with that of the water molecules, which indeed requires the partial desolvation of the anion to allow direct contact with the carbon plane. In terms of performance, the overall moderate decrease in the ion solvation number in these systems suggests that this effect does not play a significant role in their capacitive properties.
4. Conclusion and perspectives
Using a combination of cyclic voltammetry experiments and molec-ular dynamics simulations, we have studied the effect microporous car-bon structure on the performance of aqueous supercapacitors using carbide derived carbon (CDC) electrodes. The structures investigated by molecular simulations are compatible with the experimental results for CDC synthesized at 800!C, but not with the other two materials (CDC-1100 and YP-50F), which are more graphitic. In fact, the specific capacitance obtained for the latter two are in good agreement with molecular simulations of graphite electrodes, assuming that all the charge is localized in the first plane in contact with the electrode (a very good approximation). Our molecular simulations further allowed to examine the solvation of ions inside the electrodes. Unlike what was observed for large organic ions dissolved in acetonitrile, we found that most Naþcations remain fully solvated. Overall, microporous carbons such as CDCs are good candidates for applications involving aqueous supercapacitors, in particular the harvesting of blue energy or desalina-tion, but their performance remains to be optimized by tailoring their microstructure. Beyond these applications, which involve aqueous elec-trolytes with composition imposed by the sources (sea and river water), it would be particularly interesting to investigate the effect of the nature of the electrolyte (ion specific effects). Such a study would shed more light on the relation between ion solvation thermodynamics, which also de-pends on the choice of the force field [37], and the capacitive properties of such systems. Work in this direction is in progress.
Acknowledgments
The authors acknowledge financial support from the Ville de Paris (Emergences, project Blue Energy), the French National Research Agency (Labex STORE-EX, Grant No. ANR-10-LABX-0076), as well as HPC re-sources granted by PRACE (Grant No. 2015122929), GENCI (rere-sources of TGCC, Grant No. t2016087725 and Cines, Grant No. a0050907725) and Sorbonne Universit"e (MeSu). We acknowledge support from EoCoE, a project funded by the European Union Contract No. H2020-EINFRA-2015-1-676629.
Fig. 4. (a) Change in the probability distribution of solvation number of Naþbetween the bulk electrolyte and at the negative electrode, for the three electrode types considered in this work. In the case of graphite, only ions in the first adsorbed layer are considered. (b) Density profiles in the case of graphite electrodes. (c) Same as (a) for Cl#in the positive electrode.
References
[1] R.E. Pattle, Nature 174 (1954) 660.http://www.nature.com/nature/journal/v174/ n4431/abs/174660a0.html, 0028-0836.
[2] R.S. Norman, Science 186 (1974) 350, 1095-9203,http://www.sciencemag.org/cgi /doi/10.1126/science.186.4161.350, 0036-8075.
[3] J.N. Weinstein, F.B. Leitz, Science 191 (1976) 557, 1095-9203,http://science.scie ncemag.org/content/191/4227/557, 0036-8075.
[4] M. Olsson, G.L. Wick, J.D. Isaacs, Science 206 (1979) 452, 1095-9203,http://scie nce.sciencemag.org/content/206/4417/452, 0036-8075.
[5] A. Siria, P. Poncharal, A.-L. Biance, R. Fulcrand, X. Blase, S.T. Purcell, L. Bocquet, Nature 494 (2013) 455, 1476-4687,http://www.nature.com/articles/nat ure11876, 0028-0836.
[6] A. Siria, M.-L. Bocquet, L. Bocquet, Nat. Rev. Chem. 1 (2017) 91.https:// www.nature.com/articles/s41570-017-0091.
[7] D. Brogioli, R. Zhao, P.M. Biesheuvel, Energy Environ. Sci. 4 (2011) 772.http: //pubs.rsc.org/en/Content/ArticleLanding/2011/EE/C0EE00524J.
[8] D. Brogioli, R. Ziano, R.A. Rica, D. Salerno, O. Kozynchenko, H.V.M. Hamelers, F. Mantegazza, Energy Environ. Sci. 5 (2012) 9870.http://pubs.rsc.org/en/Co ntent/ArticleLanding/2012/EE/C2EE23036D.
[9] R.A. Rica, D. Brogioli, R. Ziano, D. Salerno, F. Mantegazza, J. Phys. Chem. C Nanomater. Interfaces 116 (2012) 16934.https://www.ncbi.nlm.nih.gov/pmc /articles/PMC3850643/, 1932-7447.
[10] M. Simoncelli, N. Ganfoud, A. Sene, M. Haefele, B. Daffos, P.-L. Taberna, M. Salanne, P. Simon, B. Rotenberg, Phys. Rev. X 8 (2018) 13.https://journals.ap s.org/prx/abstract/10.1103/PhysRevX.8.021024.
[11] C. Merlet, C. P"ean, B. Rotenberg, P.A. Madden, B. Daffos, P.-L. Taberna, P. Simon, M. Salanne, Nat. Commun. 4 (2013a) 2701.http://www.nature.com/ncomms /2013/131029/ncomms3701/full/ncomms3701.html, 2041-1723.
[12] T. M"endez-Morales, N. Ganfoud, Z. Li, M. Haefele, B. Rotenberg, M. Salanne, Energy Storage Mater. 17 (2019) 88.http://www.sciencedirect.com/science/article/pii/ S2405829718311759, 2405-8297.
[13] C. Prehal, C. Koczwara, N. J€ackel, A. Schreiber, M. Burian, H. Amenitsch, M.A. Hartmann, V. Presser, O. Paris, Nat. Energy 2 (2017) 16215.http:// www.nature.com/articles/nenergy2016215, 2058-7546.
[14] J. Chmiola, G. Yushin, Y. Gogotsi, C. Portet, P. Simon, P.L. Taberna, Science 313 (2006) 1760, 1095-9203,http://science.sciencemag.org/content/313/5794/1760, 0036-8075.
[15] C. Largeot, C. Portet, J. Chmiola, P.-L. Taberna, Y. Gogotsi, P. Simon, J. Am. Chem. Soc. 130 (2008) 2730, 1520-5126,http://pubs.acs.org/doi/abs/10.1021/ ja7106178, 0002-7863.
[16] J.M. Griffin, A.C. Forse, W.-Y. Tsai, P.-L. Taberna, P. Simon, C.P. Grey, Nat. Mater. 14 (2015) 812.http://www.nature.com/nmat/journal/vaop/ncurrent/full/nmat 4318.html, 1476-1122.
[17] J. Palmer, A. Llobet, S.-H. Yeon, J. Fischer, Y. Shi, Y. Gogotsi, K. Gubbins, Carbon 48 (2010) 1116.http://linkinghub.elsevier.com/retrieve/pii/S0008622309007684, 00086223.
[18] S.K. Reed, O.J. Lanning, P.A. Madden, J. Chem. Phys. 126 (2007), 084704, 1089-7690,http://aip.scitation.org/doi/10.1063/1.2464084, 0021-9606.
[19] J.I. Siepmann, M. Sprik, J. Chem. Phys. 102 (1995) 511, 1089-7690,http://a ip.scitation.org/doi/10.1063/1.469429, 0021-9606.
[20] C. Merlet, B. Rotenberg, P.A. Madden, P.-L. Taberna, P. Simon, Y. Gogotsi, M. Salanne, Nat. Mater. 11 (2012) 306.http://www.nature.com/nmat/jour nal/v11/n4/full/nmat3260.html, 1476-1122.
[21] C. Merlet, C. P"ean, B. Rotenberg, P.A. Madden, P. Simon, M. Salanne, J. Phys. Chem. Lett. 4 (2013b) 264.http://pubs.acs.org/doi/10.1021/jz3019226, 1948-7185.
[22] C. Merlet, M. Salanne, B. Rotenberg, P.A. Madden, Electrochim. Acta 101 (2013c) 262.https://linkinghub.elsevier.com/retrieve/pii/S0013468612020816, 00134686.
[23] C. P"ean, C. Merlet, B. Rotenberg, P.A. Madden, P.-L. Taberna, B. Daffos, M. Salanne, P. Simon, ACS Nano 8 (2014) 1576.https://doi.org/10.1021/nn4058243, 1936-0851.
[24] C. Pean, B. Daffos, B. Rotenberg, P. Levitz, M. Haefele, P.-L. Taberna, P. Simon, M. Salanne, J. Am. Chem. Soc. 137 (2015) 12627, 1520-5126,http://pubs.acs .org/doi/10.1021/jacs.5b07416, 0002-7863.
[25] T.R. Gingrich, M. Wilson, Chem. Phys. Lett. 500 (2010) 178.http://linkinghub.else vier.com/retrieve/pii/S0009261410013606, 00092614.
[26] H.J.C. Berendsen, J.R. Grigera, T.P. Straatsma, J. Phys. Chem. 91 (1987) 6269, 1541-5740,http://pubs.acs.org/doi/abs/10.1021/j100308a038, 0022-3654. [27] J.-P. Ryckaert, G. Ciccotti, H.J. Berendsen, J. Comput. Phys. 23 (1977) 327.http
://linkinghub.elsevier.com/retrieve/pii/0021999177900985, 00219991. [28] G. Ciccotti, M. Ferrario, J.-P. Ryckaert, Mol. Phys. 47 (1982) 1253, 1362-3028,
http://www.tandfonline.com/doi/abs/10.1080/00268978200100942, 0026-8976. [29] T. Werder, J.H. Walther, R.L. Jaffe, T. Halicioglu, P. Koumoutsakos, J. Phys. Chem.
B 107 (2003) 1345.https://doi.org/10.1021/jp0268112, 1520-6106.
[30] S. Koneshan, J.C. Rasaiah, R.M. Lynden-Bell, S.H. Lee, J. Phys. Chem. B 102 (1998) 4193.https://doi.org/10.1021/jp980642x, 1520-6106.
[31] L. Eliad, G. Salitra, A. Soffer, D. Aurbach, J. Phys. Chem. B 105 (2001) 6880, 1520-5207,http://pubs.acs.org/doi/abs/10.1021/jp010086y, 1520-6106.
[32]T.F. Willems, C.H. Rycroft, M. Kazi, J.C. Meza, M. Haranczyk, Microporous Mesoporous Mater. 149 (2012) 134.
[33]R.L. Martin, B. Smit, M. Haranczyk, J. Chem. Inf. Model. 52 (2012) 308. [34] M. Thompson, B. Dyatkin, H.-W. Wang, C. Turner, X. Sang, R. Unocic, C. Iacovella,
Y. Gogotsi, A. van Duin, P. Cummings, C 3 (2017) 32.http://www.mdpi.com/ 2311-5629/3/4/32, 2311-5629.
[35] T. M"endez-Morales, N. Ganfoud, Z. Li, M. Haefele, B. Rotenberg, M. Salanne, Energy Storage Mater. (2018).https://linkinghub.elsevier.com/retrieve/pii/S2405829 718311759, 24058297.
[36]M.D. Levi, G. Salitra, N. Levy, D. Aurbach, J. Maier, Nat. Mater. 8 (2009) 872. [37] D. Horinek, S.I. Mamatkulov, R.R. Netz, J. Chem. Phys. 130 (2009) 124507.htt