OATAO is an open access repository that collects the work of Toulouse
researchers and makes it freely available over the web where possible
Any correspondence concerning this service should be sent
to the repository administrator:
[email protected]
This is an author’s version published in:
http://oatao.univ-toulouse.fr/21411
To cite this version:
Gravina, Rosanne
and Josse, Claude
and Viguier, Bernard
and
Laurino, Adrien and Alexis, Joël and Hughes, Anthony E. and Blanc,
Christine
Corrosion behaviour of AA 1370 strands for wires:
Identification of the critical metallurgical parameters. (2018) Corrosion
Science, 134. 112-121. ISSN 0010-938X
Corrosion behaviour of AA 1370 strands for wires: Identification of the
critical metallurgical parameters
Rosanne Gravina
a,b, Claudie Josse
a,c, Bernard Viguier
a, Adrien Laurino
b, Joël Alexis
d,
Anthony E. Hughes
e, Christine Blanc
a,⁎aCIRIMAT, Université de Toulouse, CNRS, INP-ENSIACET, 4 allée Emile Monso, CS 44362, 31030, Toulouse, France bLEONI Wiring Sytems France, 5 avenue de Newton, 78180, Montigny-le-Bretonneux, France
cUMS Castaing, Université de Toulouse, 3 rue Caroline Aigle, 31400, Toulouse, France dUniversité de Toulouse, LGP, ENIT/INPT, 47 Avenue d’Azereix, 65016, Tarbes, France eCSIRO, Mineral Resources, Gate 5, Normanby Road, Clayton, Victoria, 3168, Australia
A R T I C L E I N F O
Keywords: A. Alloy A. Aluminium B. TEM B. Polarisation C. InterfacesA B S T R A C T
The corrosion behaviour of AA 1370 in different metallurgical states was studied in chloride-containing sulphate solutions. The microstructures of a rod, a deformed strand and an annealed strand constitutive of wires were examined using scanning electron microscopy, transmission electron microscopy and electron backscattered diffraction. Results offered evidence for the ultra-fine grain size, high density of interfaces and high level of misorientation of the interfaces as relevant explanations for the low corrosion resistance of the deformed strand compared to the rod and the annealed strand.
1. Introduction
In the automotive industry, copper is largely used for wiring har-nesses, in particular because it combines good electrical properties and corrosion behaviour which prevents corrosion of the wiring harnesses in severe corrosive environments, e.g., de-icing road salt, coolant, and windshield washer fluids. Considering the need to reduce the weight of cars in the context of the rarefaction of fossil fuels and the reduction of greenhouse gas emissions, automotive manufacturers proposed to substitute copper with aluminium alloys to reduce both the cost and weight of wiring harnesses. One promising material is 1370 aluminium alloy (AA1370) which has good corrosion resistance. However, wiring harnesses are constituted of thin strand arms, which are obtained by wire-drawing. This metalworking process consists of a reduction in the rod or wire diameter by passing it through a series of drawing dies interspersed, if necessary, with aging heat treatments to release the stresses induced by the process. The different microstructures obtained after each step of the manufacturing process strongly depend on the thermo-mechanical process characteristics, which also affect the cor-rosion behaviour of the material. Therefore, before using AA1370 for wiring harnesses, efforts are required to ascertain the corrosion beha-viour of the aluminium alloy after wire-drawing.
AA 1370 contains Fe-rich coarse particles [1,2] and corrosion sus-ceptibility is often explained on the basis of the cathodic activity of
these intermetallics which can promote pitting corrosion in the Al-matrix [3–5]. Osario et al. showed that Al3Fe and Al6Fe intermetallic
fibres significantly influenced the electrochemical behaviour of a Fe-containing aluminium alloy [6]. However, samples are severely de-formed during wire-drawing; this can lead to a fragmentation of the coarse particles [7,8] as shown by Adamczyk-Cieslak et al. for Al–Fe–Si coarse particles in a 6060 aluminium alloy [9]. The severity of corro-sion for severely deformed samples could be due to the simple multi-plication of potential pit sites leading to more pitting or more compli-cated effects such as local deformation of the matrix during the flow and fracture of intermetallic particles that promote more severe pitting corrosion. Brunner et al. partially explained the modification of the intergranular susceptibility of an AA2024-T351 alloy taking into ac-count the impact of equal-channel angular pressing (ECAP) on the size and distribution of intermetallics [10]. But, it is known that the cold drawing process leads to other metallurgical changes for aluminium alloys e.g. modification of the grain size, morphology and orientation, of the interface characteristics and of the dislocation density [11–13]. For example, Mishin et al. studied recovery and recrystallisation in commercial purity aluminium cold rolled to an ultrahigh strain and isothermally annealed and showed that microstructural changes were significant in terms of final grain size and texture [11]. These me-tallurgical changes due to the wire-drawing process could also con-tribute to the corrosion response of the strand arms. The complexity of
⁎Corresponding author at: CIRIMAT, Université de Toulouse, CNRS, INP−ENSIACET, 4 allée Emile Monso, BP 44362, 31030, Toulouse, France. E-mail address:[email protected](C. Blanc).
corresponded to a 9.5 mm diameter disk in transverse section and to a 9.5 × 10 mm2 rectangle in longitudinal section (10 mm-long rod
po-lished to the core). For the strands, the electrodes were made by em-bedding 22 strands in transverse section (exposed surface equal to 22 disks with a 0.52 mm diameter). The strands were organized to obtain a regular arrangement of their cross-sections (the axis of each individual strand being parallel to the others) and embedded together in an epoxy-resin. All the cavities between the strands were filled by the epoxy-resin to avoid crevice corrosion. For the longitudinal section, the surface exposed to the electrolyte was 0.52 × 15 mm2; it corresponded to that
of a 15 mm-long strand polished to the core i.e., at the maximum dia-meter. The electrical connection, made by using silver glue to avoid using welding, was protected by epoxy-resin to both strengthen its mechanical resistance and to avoid galvanic coupling with the alumi-nium alloy. Before all corrosion tests, the surface of the specimen was mechanically abraded with 2400 grit SiC paper and then polished from 6 to 1 μm grade with diamond paste and distilled water as lubricant.
Open circuit potential (OCP) measurements were performed with a test duration of 3 h with one measurement per second. The OCP reached a nearly stable value after 1 h but the experiments were per-formed for 3 h to reach a stable OCP value. The OCP values given in the results section corresponded to the mean of the measurements per-formed during the last 30 min, i.e. between 2 h 30 min and 3 h. For each condition, at least three samples were tested; the total number of measurements performed was between 9 and 16 (as detailed inFig. 1) to ensure the reproducibility of the results. Prior to the potentiokinetic polarisation experiments (E-I curves), the samples were maintained for 1 h at OCP; then the potential was scanned from OCP − 50 mV to 800 mV/SCE for the anodic branch and OCP + 50 mV to −300 mV/SCE for the cathodic branch. The potential scan rate was 0.07 mV s−1. At
least three E-I curves were collected for each sample to ensure the re-producibility of the results. The electrolyte used for both electro-chemical tests was a 0.1 M Na2SO4+ 0.001 M NaCl solution at room
temperature, open to air and stirred. This electrolyte was chosen be-cause it is less severe than a pure chloride solution. Preliminary tests were performed in NaCl solutions but the corrosion damage was so extensive that it was difficult to distinguish between the different samples. Solutions were prepared by dissolving analytical grade che-mical salts in distilled water.
2.3. Optical microscope (OM), scanning electron microscope (SEM) and transmission electron microscope (TEM) observations
The microstructure of the three samples was characterised using a combination of OM, SEM and TEM observations. OM observations using an Olympus PMG3 microscope allowed the Fe-rich intermetallic parti-cles to be observed for a 1 μm-polished surface. The surface density of these particles was determined for the three samples by analysing SEM micrographs obtained with a LEO-435-VP SEM (15 kV) using image analysis software (ImageJ). The rod grain structure could be observed in OM after etching in Keller’s reagent (1 mL of hydrofluoric acid (40 wt %), 1.5 mL of hydrochloric acid (35 wt%), 2.5 mL of nitric acid (68 wt %) and 95 mL of distilled water). The grain size was too small for the strands to use this method effectively. Further characterisation was performed using a JEOL-JEM-2010 TEM. The samples were prepared using mechanical polishing to obtain a 100 μm-thick slice. A dimple was machined in the central region using a South Bay Technology dimpler. Final electron transparency was achieved by ion milling on a precision ion polishing system (PIPS(tm), Gatan) using 5 kV Ar+ ions. All TEM observations were performed on longitudinal sections parallel to the cold drawing direction.
OM and SEM observations were used also to characterise the cor-rosion morphology. In this case, the samples were removed from the electrolyte after the electrochemical tests, rinsed with distilled water and then air-dried before being observed.
establishing a clear relationship between the grain size and the corro-sion resistance of an alloy has been addressed in other studies [10,14–18]. Kim et al. suggested that the grain boundary character distribution (GBCD) had a great effect on intergranular corrosion sus-ceptibility of aluminium in HCl [19]. Luo et al. showed that there was a relationship between the dislocation density in a grain and the ability of the grain boundary to be corroded [20]. The conclusion from both these studies is that the corrosion activity should increase as the grain size decreases. On the other hand some studies found a tendency for the intergranular corrosion rate to decrease and a movement of the corro-sion potential to more noble values as the grain size decreases [10,14,15]. It can be concluded from this short review of the literature that corrosion susceptibility is due to a number of factors including grain size, level of residual deformation, constituent particles dis-tribution, and the density of precipitates (for alloys where they are important). Any combination of these effects may contribute to the corrosion susceptibility of an alloy. It should also be pointed out that these features of the microstructure are related to corrosion propaga-tion that occurs in the body of a strand. Corrosion initiapropaga-tion through the surface developed on a strand, is also important, but not the focus of this study.
The aim of this work is to determine the critical microstructural parameters explaining the corrosion propagation occurring in the body of a strand. In this context, the corrosion behaviour of AA1370 was studied depending on its metallurgical state in relation to the wire-drawing process. The size and distribution of Fe-rich particles were considered. In addition considerable attention was also paid to micro-structural parameters mentioned above at the polycrystal scale: this means that the crystallographic orientation and size of the grains, as well as the nature of the interfaces (either grain boundaries or subgrain boundaries corresponding to the level of misorientation at the inter-faces) were considered as potential critical metallurgical parameters influencing the corrosion susceptibility of the AA 1370 alloy. To study the impact of these microstructural parameters on the corrosion beha-viour of the alloy, electron backscattered diffraction (EBSD) analyses were performed for AA1370 alloy at each step of the wire-drawing process and related to the potentiokinetic polarisation behaviour. These studies were also supported by optical microscopy, scanning electron microscopy as well as transmission electron microscopy.
2. Experimental procedure 2.1. Material
The material used for this study was a 1370 aluminium alloy (AA1370; expressed as wt%: 99.7% Al, 0.072% Fe, 0.0045% Mg, 0.045% Si) in three metallurgical states corresponding to the different steps of the cold drawing process leading from a rod to a strand. All the samples were provided by LEONI WIRING SYSTEMS FRANCE. The rod has a 9.5 ± 0.05 mm diameter and was made by continuous casting and rolling. The strands were obtained by a multistep cold drawing process from the wire rod leading to a 0.52 ± 0.01 mm diameter strand. The strands were annealed at 270 ± 2 °C for 4 h as used for wire harnesses. In the following, the designations for the rod, deformed strand and annealed strand were R, DS and AS respectively.
2.2. Electrochemical measurements
For electrochemical measurements, the experimental set-up con-sisted of a three-electrode electrochemical cell with a large surface area platinum electrode used as a counter electrode and a saturated calomel electrode (SCE) with a Lugin capillary as a reference electrode. All potentials are relative to the SCE reference. The working electrode corresponded to specimens of AA1370 alloy such as R, DS and AS. Rod samples were embedded in an epoxy resin with the transverse or longitudinal section exposed to the electrolyte: the surface area
Since the strands were small area, some further experiments were
performed in order to demonstrate that the electrodes were both re-producible and representative. First, because corrosion events might be related to the Fe-rich intermetallics, which were heterogeneously dis-tributed, experiments were performed with electrodes built with dif-ferent numbers of strands; results showed that the electrode surface area chosen was representative of the microstructure. Then, in order to check whether the electrode diameter had an influence on the elec-trochemical response between the three samples, another rod electrode (in transverse section) with a 0.7 mm diameter was prepared by using a milling tool: similar results were obtained for both the 0.7 mm and 9.5 mm rods indicating that electrode diameter was not a variable. Further, the result showed that the altered surface layer (ASL) that could be present on the surface of the cylindrical samples due to the manufacturing process (elaboration of the rod and then use of the milling tool) did not significantly influence the electrochemical re-sponse of the rod even though it has been shown that, in other cases, it could be of significant importance [22–26]. More globally, corrosion propagation that occurs in the body of the strand was the focus of this study. Therefore, the ASL that could be present on the surface of the cylindrical samples (both rods and strands) due to the manufacturing process was not considered here. In the same way, as shown by Seong et al. [25], polishing could also induce the growth of an ASL on the sample surface which could alter the electrochemical response. TEM observations showed a 500 nm-thick ASL on the different polished samples. Removal of the ASL by vibratory polishing followed by elec-trochemical measurements showed that there was no significant dif-ference between samples with and without the polishing-induced ASL. 3.1.2. OCP measurements and E-I curves
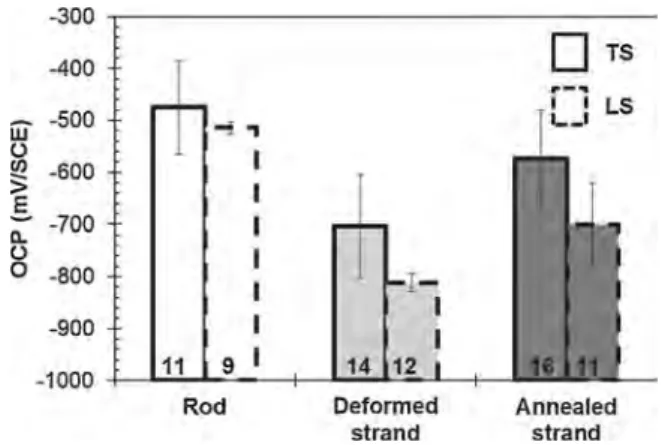
Fig. 1 sums up the OCP values for the three samples for both transverse and longitudinal sections. In all cases, the OCP values mea-sured for the rod were less negative than those for the deformed strand with a mean OCP value equal to −470 mV/SCE (−510 mV/SCE) for the rod compared to −700 mV/SCE (−810 mV/SCE) for the deformed strand in transverse section (longitudinal section). Independent of the sections, the mean OCP value for the annealed strand (−570 mV/SCE for transverse section and −700 mV/SCE in longitudinal section) was between the OCP values for the rod and deformed samples. The results were in agreement with those obtained from the E-I curves (Fig. 2) which showed differences in the corrosion potential values for the three samples with Ecorr (R) > Ecorr (AS) > Ecorr (DS) for transverse and
longitudinal sections. Furthermore, the results suggested that, in-dependent of the metallurgical state, the OCP values were slightly less negative for the transverse sections compared to longitudinal sections (Fig. 1) which was also reflected in the Ecorrvalues measured from the
E-I curves (Fig. 2) for transverse and longitudinal sections.
Fig. 2also showed that for all samples, the E-I curves had a weakly
Fig. 1. OCP values of a rod, a deformed strand and an annealed strand measured in transversal and longitudinal sections after 3 h of exposure in a 0.1 M Na2SO4+ 0.001 M NaCl solution. The number of tests is indicated in the bars.
2.4. Hardness measurements and tensile tests
Hardness measurements were performed to complete the micro-structural characterisation of the samples by using a nanoindentor XP from MTS with a Dynamic Contact Module. For each sample, at least 10 measurements in the Continuous Stiffness mode were carried out with a Berkovich indenter by fixing a maximum in-depth displacement of 2000 nm. The distance between the indents was either 50 or 100 μm for the strands and the rod respectively. Before measurements, the samples were abraded and then polished to 1 μm using diamond paste. To avoid the influence of hardening due to sample polishing, the depth interval for calculating the hardness varied between 500 and 1750 nm as compared to the maximum in-depth displacement. Hardness measure-ments were completed by tensile tests performed using a dual column MTS testing machine with a frame capacity of 30 kN for the rod. For the strands, a BOSE ElectroForce 3330 testing machine with a frame ca-pacity of 5 kN was used. All tests were performed at a strain rate of 10−3 s−1.
2.5. Study of the critical microstructural parameters at the polycrystal scale EBSD analyses were performed on transverse and longitudinal sec-tions for the three samples. For the rod, surface preparation consisted in mechanical abrading to 2400 grit SiC paper with water as lubricant then polishing down to 1 μm with diamond paste and water + ethanol as lubricant. Finally, they were etched in Keller’s reagent followed by ethanol rinsing allowing the altered surface layer due to polishing to be removed as confirmed by EBSD analyses. For the strands, the previous surface preparation was not adequate; therefore, a cross section pol-isher JEOL IB-19500 CP was used for 6 h at 6 keV. The samples were analysed using an OXFORD INSTRUMENTS HKL EBSD system (Nordlys Nano EBSD detector) and version 3.1 of the Aztec software. The EBSD detection unit is mounted on a JEOL JSM 7100F SEM with a field emission gun. Samples were analysed at 20 kV at spot size 16. This spot size typically corresponds to an incident beam current of approximately 12.5 nA. The EBSD data were then post-processed using the commercial software package Oxford Channel 5. First large field (around 1 or 1/ 10 mm2) areas were studied, using a step size of 0.3 μm and an
acqui-sition speed of 43.9 patterns per millisecond. Such low magnification analyses were selected for drawing representative image orientation mapping and texture analysis. More detailed analyses of the micro-structure were performed in regions of about 80 × 80 μm2, using a step
size equal to 0.05 μm. Those were used to study the grain structure and local misorientation. Grain boundaries were defined as a local interface corresponding to a misorientation larger than 15° (high angle grain boundaries). This misorientation value was derived from data available for pure aluminium [21]. Subgrain boundaries were defined as local interfaces with a misorientation ranging from 2° to 15°. The individual grains were identified as closed surfaces surrounded by high angle grain boundaries. All grains constituted by less than 3 pixels were auto-matically removed from the maps prior to data analysis. The grain size was determined from the grain area. In order to quantify the amount of interfaces on the different specimens, the interface maps (successively grain and subgrain boundary maps) were analysed using ImageJ soft-ware. The binary image was skeletonised in order to reduce the thick-ness of the interface to one pixel, then the surface fraction of the in-terface was calculated and this corresponds to the surface density as reported later in the manuscript.
3. Results and discussion
3.1. Corrosion behaviour of the AA 1370 alloy: from the rod to the annealed strand
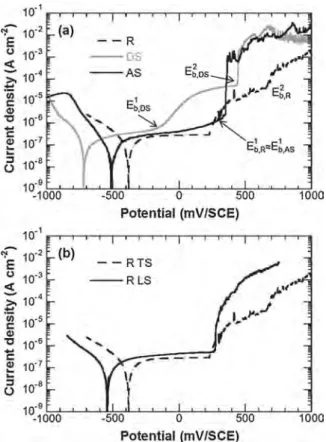
pronounced cathodic plateau corresponding to oxygen reduction below the OCP. For the rod, the anodic branch showed a passive plateau be-tween OCP and a first breakdown potential (E1
b,R≈ 250 mV/SCE) where there was a significant increase of the anodic current density. The an-nealed and deformed strands showed initial breakdown potentials (E1
b,AS) at ≈ 350 mV/SCE and (E1b,DS) around −200 mV/SCE
respec-tively. At E1
b,DSthe current density for the deformed strand increased by
around 2 orders of magnitude above the other samples which were still below their first breakdown potentials (Fig. 2a). This means that the deformed microstructure is much more active in this potential range (−200 to ≈ 350 mV/SCE) than the other samples. For the first break-down potentials, E1
b,R≈ E1b,AS >E1b,DS (Fig. 2a). No significant
differ-ence was observed between the E1
bvalues when transverse and
long-itudinal sections were studied but the passive current density was found to be slightly higher for longitudinal section compared to transverse section (Fig. 2b). A second breakdown potential (E2
b,X) was observed on
the polarisation curves for the rod and the deformed strand (X = R or DS), with E2
b,DS <E2b,R.
Independent of the samples and the sections, similar corrosion features were observed on the surface in relation with previous elec-trochemical results, as exemplified inFig. 3for the rod. Comparison of SEM (Fig. 3a) observations performed before exposure to the electrolyte and both OM (Fig. 3b) and SEM (Fig. 3c) observations after the OCP measurements showed that a weak dissolution of the matrix around the Fe-rich particles (typical spectrum shown in Fig. 3d) occurred at the corrosion potential as observed in other studies [3–5]. SEM observa-tions were performed also for samples after interrupted polarisation tests in the anodic domain at chosen potentials.Fig. 3e shows a re-presentative SEM micrograph of corrosion features observed at 20 mV above the first breakdown potential (E1
b,X, with X = R, DS or AS) which
correlated with the sharp increase in anodic current density. It can be seen that there is localised attack around the Fe-rich intermetallics as observed in other studies [3–5]. SEM observations performed at the end
of the polarisation tests (Fig. 3f–h), i.e. after the second breakdown potential (E2
b,X), showed more extensive pitting around the Fe-rich
in-termetallics as proved by the presence of the inin-termetallics inside the growing pits (Fig. 3h).Fig. 3f and g also showed that filaments were growing from the pits suggesting grain boundary attack penetrating into the surrounding matrix. These observations suggested that the increase in current density at E2
b,Xwas associated with grain boundary
dissolution promoting pit propagation into the matrix [27].
The nobler corrosion potential, a lower passive current density and more positive breakdown potentials of the rod compared to the de-formed strand indicates that the cold drawing had a detrimental effect on the corrosion resistance for the AA 1370. The annealing treatment resulted in a movement of the corrosion potential to more noble values compared to the deformed strand and an increase of the pitting re-sistance with similar E1
band ipassivevalues for the rod and the annealed
strand and even if the Ecorr value for the annealed strand remained
more negative than that for the rod. Therefore, for the rod, the com-bination of intermetallic related corrosion and matrix breakdown at E1
b,Ris consistent with a microstructure where the matrix is relatively
homogeneous, i.e., no significant grain boundary effects and no de-formation related corrosion. A similar conclusion could be drawn for the annealed strand. On the other hand, the deformed strand clearly has corrosion susceptible microstructure which has been introduced during forming and manifests itself at E1
b,DS; an enhanced reactivity of the grain
boundaries, relevant with the significant increase of the anodic current above E2
b,DS, could be probable explanation for the lower corrosion
re-sistance of this sample. 3.2. Role of Fe-rich intermetallics
The results described in the previous paragraph showed that the corrosion behaviour of AA 1370 was related to Fe-rich particles, as reported in the literature. Studies have shown that the fragmentation of these intermetallics during deformation should explain the evolution of the corrosion behaviour of the aluminium alloys after processing [7–9]. Therefore the first part of this study was to identify whether different distributions of the Fe-rich intermetallics were responsible for the corrosion behaviour. Electron diffraction analysis (Fig. 4a) performed in [312] zone axis showed for all metallurgical states that the inter-metallic particles were the cubic phase Al17Fe4Si2(lattice parameter
equal to 12.56 Å). OM, SEM and TEM were performed to determine the distribution of intermetallics for the three types of samples. Regardless of metallurgical state,Fig. 4b shows that the fraction of surface area of intermetallics was low and varied between 0.5–0.8%, in the transverse section; the differences were not significant taking into account the heterogeneity of the particle distribution as shown by the error bars. The size distributions were similar for all metallurgical states and in-dicate that the majority of the Fe-rich intermetallics were between 0.5–1.5 μm2 (Fig. 4c). Size distributions and the fractions of surface
area of Fe-rich intermetallics were similar for transverse and long-itudinal sections. Therefore, even though some studies have concluded that cold drawing leads to fragmentation of intermetallics, this was not observed here. In the present study, it is evident from the results that the differences in corrosion behaviour between the AA1370 rod, de-formed strand and annealed strand could not be explained by the level of fragmentation of intermetallic particles. Hence attention was paid to other microstructural parameters suspected to be changed due to the cold drawing.
3.3. Influence on the AA 1370 corrosion behaviour of microstructural parameters at the polycrystal scale
3.3.1. Influence of the crystallographic orientation of the grain and texture on the corrosion behaviour
Fig. 5 shows the orientation maps for the transverse and long-itudinal sections of the rod, the deformed strand and the annealed
Fig. 2. Polarisation curves in a 0.1 M Na2SO4+ 0.001 M NaCl solution for (a) a rod, a deformed strand and an annealed strand in transverse section, and for (b) a rod in transverse and longitudinal sections.
strand. In these maps, the color indicates the crystallographic orienta-tion along a direcorienta-tion normal to the image according to the standard triangle (Inversed Pole Figure; z0). First, analysis of different zones for the three samples showed, mainly for the rod and the annealed strand, a strong heterogeneity in the grain size. The areas selected for examina-tion (maps shown inFig. 5) are assumed to be representative as judged from general observations on the grain scale for each sample. Com-parison of the orientation maps for the rod (Fig. 5a and b) and the deformed strand (Fig. 5c and d) showed unambiguously that the cold drawing had induced a strong decrease of the grain size [13]. The an-nealing treatment seemed to lead to a grain size similar to that mea-sured for the rod suggesting that a static recrystallisation phenomenon had occurred [11]. Comparison of all maps for transverse and long-itudinal sections, showed that the thermomechanical treatments
(rolling for the rod and cold drawing for the strands) led to an elongated grain structure observed with either OM (rod) after etching in Keller’s reagent (insets inFig. 5a and b), or EBSD.
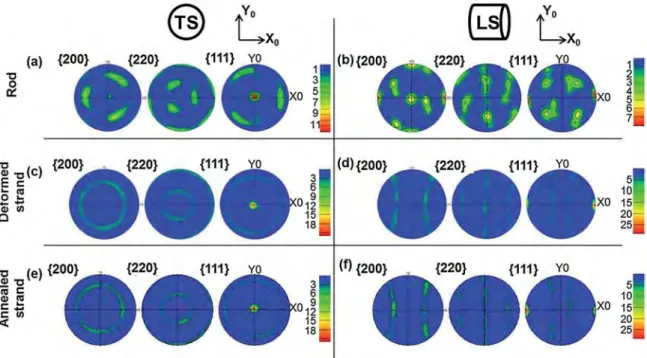
Fig. 6a and b showed that the rod exhibited two components of fibre texture along the rolling axes, i.e. the most pronounced parallel to 〈111〉 direction and the second one parallel to 〈200〉 direction. By contrast, the strands (Fig. 6c–f) showed only one strong fibre texture component along the drawing direction parallel to 〈111〉 direction. The texture intensities (color legend inFig. 6) were similar for the deformed and annealed strands both of which were stronger than in the rod. The results were consistent with literature data concerning the micro-structural evolution of rolled F.C.C. metals and cold-drawn aluminium wire [28–32]. Differences in Ecorr between the transverse and
long-itudinal sections can be clearly related to differences in mean
Fig. 3. (a) SEM micrograph of AA 1370 before exposure to the electrolyte. (b) Optical and (c) SEM micrographs of the corrosion damage localised around intermetallic particles for AA1370 after 3 h of immersion at open circuit potential. (d) EDX analyses performed on a Fe-rich particle from (c). SEM observations of AA1370 after polarisation tests with (e) tests interrupted 20 mV after the first breakdown potential (f) and (g) tests completed. (f) and (g) referred to the same zone, (f) is a micrograph in secondary electron mode, (g) in backscattered electron mode. (h) is a zoom on (f). Electrolyte: 0.1 M Na2SO4+ 0.001 M NaCl solution. Micrographs obtained for the rod.
crystallographic orientation. However, the differences in the texture intensity were larger between the annealed strand and the rod than between the two strands even though the rod and the annealed strand displayed similar electrochemical behaviour. These contradictory re-sults clearly showed that factors other than texture were at play in explaining the differences in the corrosion behaviour.
3.3.2. Influence of the grain size and density of interfaces on the corrosion behaviour
Fig. 7shows that thermomechanical treatment led to complex mi-crostructures. During cold-drawing, the microstructural evolution pro-gresses by subdivision of grains into cell-blocks on a smaller and smaller scale with interfaces made of geometrically necessary boundaries and
Fig. 4. (a) TEM micrograph and electron diffraction pattern of an intermetallic par-ticle. (b) fraction of surface area covered by the particles and (c) distribution of the particle surface area for a rod, a deformed strand and an annealed strand. ForFig. 4b and c, data were calculated from the ana-lysis of more than 25 SEM images (size: 108 × 76 μm2 corresponding to a 1000 times magnification). ForFig. 4c, the results are only given for transverse sections but they are similar for longitudinal sections.
Fig. 5. Orientation maps for the transverse and longitudinal sections of (a,b) a rod (c,d) a deformed strand and (e,f) an annealed strand. Insets in Figs. (a) and (b) are optical observations of the rod after metallographic attack with Keller's reagent. The word ‘center’ and the white arrow in LS micrograph indicate roughly the position of the rod/strand axis.
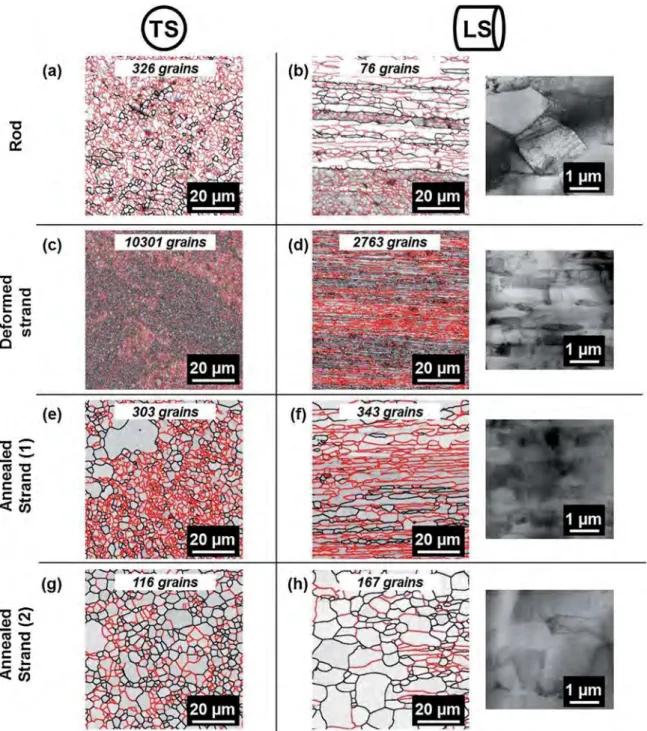
incidental dislocation boundaries [33]. The two types of boundaries are both composed of dislocations and are difficult to distinguish in TEM micrographs. In the present study, distinction was initially made only between grain (misorientation > 15°) and subgrain (misorienta-tion < 15°) boundaries. These boundaries are superimposed in band contrast images inFig. 7. For the rod,Fig. 7a and b show that grains, separated from each other by grain boundaries, could be subdivided into small subgrains (separated by subgrain boundaries) visible in TEM observations (inset inFig. 7b). Plate-like zones of materials, identified as microband structure (i.e. deformation bands), were clearly visible in
Fig. 7b. For the deformed strand which experienced increased strain, the width of the microbands decreased from tens of micrometers for the rod to less than 1 μm (Fig. 7c and d).
The resulting microstructure can be described as a common de-formation structure, relatively homogeneous, and known as a ‘bamboo’ microstructure [34] easily visible in TEM (inset inFig. 7d). The cold drawing had induced high angle grain boundaries extended in the cold drawing direction and the high angle grain boundary spacing was compressed in the normal direction with strain. A significant density of retained low angle boundaries was observed, which were pre-dominantly oriented in the transverse direction cross-linking the high angle boundaries parallel to the cold drawing axis. For the annealed strand, two types of zones were distinguished (Fig. 7e–h). Zones with a ‘bamboo’ microstructure (Fig. 7e and f, zone 1), characterised by a high angle grain boundary spacing higher than for the deformed strand, coexisted with zones for which the microbands seemed to have dis-appeared (Fig. 7g and h, zone 2). Some coarse grains were observed among the fine grains in zone 1 in transverse sections. The grain structure for zone 1 was characteristic of only partial recrystallisation while, for zone 2, a complete discontinuous recrystallisation was ob-served and the deformation structures had evolved into a uniform equiaxed grain structure.
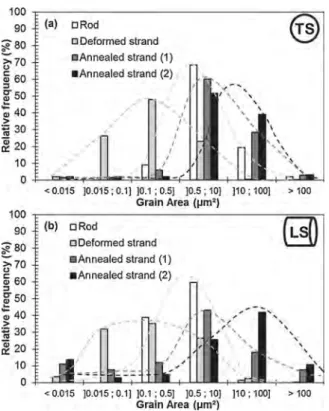
The difference in microstructures for the three metallurgical states is evident inFig. 8. All samples showed wide distributions for the grain area. Moreover, the results highlight the formation of ultra-fine grain structure for the deformed strand as confirmed by the large number of grains determined in Fig. 7c being 10301 (average grain area = 0.62 μm2) compared to 326 (average grain area ≈ 20 μm2) for
the rod (analysis area of 80 × 80 μm2). Comparison of the grain size
between the rod and the annealed strand was more difficult due to the
heterogeneity of the grain structure for both samples particularly for the annealed strand. In transverse section, the number of grains de-termined in the band contrast micrographs (Fig. 7) was 303 for the annealed strand in zone 1, similar to the rod (326 grains) but higher than in zone 2 of the annealed strand (116 grains).Fig. 8seemed to reveal a slight coarsening of the grains for the annealed strand but, because of the heterogeneity of the grain structure, the grain size for the rod and the annealed strand was considered similar. These results are also reflected in the hardness measurements (Fig. 9) with hardness values similar for both the rod and the annealed strand, and nearly half those for the deformed strand [35,36]. Increase in hardness can be interpreted on the basis of a Hall and Petch law, where the refinement of the grain size for the deformed strand leads to an increase in the hardness. Results were well-correlated with tensile measurements (Table 1).
The large changes in grain and subgrain size had an influence on the grain boundary populations.Fig. 10shows the determination of the boundary surface density. For transverse sections (Fig. 10a), the total surface density of boundary was similar for the rod and the annealed strand as seen inFigs. 7 and 8. By contrast, this parameter was 2–3 times higher for the deformed strand as shown inFig. 7, confirming the refinement of the grain size due to the deformation. The same trend was observed for longitudinal sections (Fig. 10b) but the total surface density of boundary was lower than the transverse section.
Comparison of results from electrochemical measurements (Figs. 1–3) and microstructural characterisations suggested a ‘grain size-corrosion resistance’ relationship including a lower corrosion re-sistance for finer grains structure, i.e. for the deformed strand compared to the rod and the annealed strand. This is supported by some other studies [16–18] that showed that a better corrosion resistance was achieved with coarse microstructures as observed here. This relation-ship is based on a lower density of grain (and subgrain) boundaries leading to lower corrosion activity based on the assumption that in-terfaces act as preferential sites for anodic dissolution as suggested by Yamasaki [27]. This was well-correlated with interface dissolution observed inFig. 3and could explain the shift of the second breakdown potential towards more noble values for the rod compared to the de-formed strand.
However, other authors come to the conclusions that a Hall–Petch type relationship may exist for corrosion rate and grain size because
their results revealed a tendency for corrosion rate to decrease as grain size decreases [10,14,15,37]. Such a contradiction reflects the diversity of interfaces in relation to the composition and metallurgy of the in-terfaces. In this case the composition is not likely to be different to the matrix (due to either segregation or grain boundary precipitates and depletion related zones) as a result of the purity of the material; how-ever, the metallurgical processing may lead to changes in the level of misorientation.
3.3.3. Influence of the misorientation level of interfaces on the corrosion behaviour
Fig. 11shows the ratio of subgrain boundaries surface density/grain boundaries surface density for both sections for all samples. No differ-ences were observed between the two sections. For the deformed
strand, the ratio was significantly lower than for the rod and the an-nealed strand in zone 1 which was evident in the increase of the level of misorientation of the interfaces for the deformed strand due to the deformation. For the annealed strand, the heterogeneous micro-structure was once more evident with differences between zones 1 and 2. In zone 2, the complete recrystallisation from the deformed strands led to a decrease of low angle grain boundaries (subgrain boundaries) surface density while, for zone 1, the ratio remained high due to the retention of the ‘bamboo’ structure. It can be concluded that the de-formed strand retains a high level of misorientation compared to other samples. Considering previous electrochemical results (Figs. 1 and 2) and SEM observations (Fig. 3), these results therefore indicate that the surface density of interfaces as well as interface misorientation con-tribute to the greater corrosion susceptibility of the deformed strand.
Fig. 7. Band contrast micrographs with distinction between grain boundaries (black line) and subgrain boundaries (red line) for the transverse and longitudinal sections of (a,b) a rod, (c,d) a deformed strand and (e,f,g,h) an annealed strand (two zones, referred as 1 and 2). TEM micrographs are given for the longitudinal sections. The images were taken in positions indicated inFig. 5by the white square. The number of grains detected in each zone is given. (For interpretation of the references to colour in this figure legend, the reader is referred to the web version of this article.)
This was in agreement with previous works that showed that a high level of misorientation of an interface was characteristic of a disordered structure and correlated with its high energy and corrosion suscept-ibility [19,20,38,39]. Therefore, a ‘level of interface misorientation-corrosion resistance’ relationship should complete the previous ap-proach concerning the influence of the grain size, i.e. the density of interfaces. In this work, the deformed strand was characterised both by a large density of interfaces, independent of their level of misorienta-tion, and a global level of interface misorientation higher than for the rod and the annealed strand.
4. Conclusions
The corrosion behaviour of an AA1370 alloy was studied in chloride-containing sulphate solutions taking into account its me-tallurgical state, i.e. considering a rod, a deformed strand and an an-nealed strand, the last sample being used to manufacture wiring har-nesses.
1 A lower resistance to corrosion was observed for the deformed strand as compared to the other samples.
2 There were no significant differences in the nature, size and dis-tribution of Fe-rich intermetallics. Therefore, the results showed that the differences in corrosion behaviour between the AA1370 rod, deformed strand and annealed strand could not be explained by the level of fragmentation of intermetallic particles.
Fig. 8. Distribution of grain area (a) in transverse section (b) in longitudinal section for a rod, a deformed strand, an annealed strand (two zones, referred as 1 and 2).
Fig. 9. Hardness measurements in transverse and longitudinal sections for a rod, a de-formed strand and an annealed strand.
Table 1
Mechanical properties measured for the rod, the deformed and annealed strands (σ0.2= yield strength; UTS = ultimate tensile strength; ef= elongation to fracture).
Sample σ0.2(MPa) UTS (MPa) ef%
Rod 92 ± 3 111 ± 2 24 ± 2
Deformed strand 217 ± 2 233 ± 7 1.0 ± 0.2 Annealed strand 62 ± 4 80 ± 3 26 ± 1
Fig. 10. Surface density of grain and subgrain boundaries for the (a) transverse and (b) longitudinal sections. Results are given for the rod, a deformed strand and an annealed strand (two zones, referred as 1 and 2).
Fig. 11. Ratio subgrain boundary/grain boundary surface densities in transverse and longitudinal sections. Results are given for the rod, a deformed strand and an annealed strand (two zones, referred as 1 and 2).
3 The deformed sample had a much smaller grain size, larger surface density of grain and subgrain boundaries as well a higher global level of misorientation of the interfaces. All these microstructural parameters reflect a high level of residual deformation which the potentiokinetic polarisation results show to be much more corrosion susceptible.
Acknowledgments
The authors would like to thank Marie-Christine Lafont for the TEM analyses. They are also grateful for the assistance in sample preparation with the cross-section polisher of the CMEBA facility staff (ScanMAT, University of Rennes 1) who received a financial support from the Région Bretagne and European Union (CPER-FEDER 2007–2014). References
[1] C.M. Allen, K.A.Q. O'Reilly, B. Cantor, P.V. Evans, Intermetallic phase selection in 1xxx Al alloys, Prog. Mater. Sci. 43 (1998) 89–170.
[2] B. Sundman, I. Ohnuma, N. Dupin, U.R. Kattner, S.G. Fries, An assessment of the entire Al-Fe system including D03 ordering, Acta Mater. 57 (2009) 2896–2908. [3] R. Rambat, A.J. Davenport, G.M. Scamans, A. Afseth, Effect of iron-containing
in-termetallic particles on the corrosion behaviour of aluminum, Corros. Sci. 48 (2006) 3455–3471.
[4] J.O. Park, C.H. Paik, R.C. Alkire, Scanning Microsensors for measurement of local pH distributions at the microscale, J. Electrochem. Soc. 143 (1996) L174–L176. [5] O. Seri, M. Imaizumi, The dissolution of FeAl3Intermetallic compound and
de-position on aluminum in AlCl3solution, Corros. Sci. 30 (1990) 1121–1133. [6] W.R. Osório, L.C. Peixoto, P.R. Goulart, A. Garcia, Electrochemical corrosion
parameters of as-cast Al-Fe alloys in a NaCl solution, Corros. Sci. 52 (2010) 2979–2993.
[7] M. Cabibbo, E. Evangelista, M. Vedani, Influence of severe plastic deformations on secondary phase precipitation in a 6082 Al-Mg-Si alloy, Metall. Mater. Trans. A 36A (2005) 1353–1364.
[8] M. Murayama, Z. Horita, K. Hono, Microstructure of two-phase Al 1.7 at% Cu alloy deformed by equal channel angular pressing, Acta Mater. 49 (2001) 21–29. [9] B. Adamczyk-Cieslak, J. Mizera, K.J. Kurzydlowski, Microstructures in the 6060
aluminium alloy after various severe plastic deformation treatments, Mater. Charact. 62 (2011) 327–332.
[10] J.G. Brunner, N. Birbilis, K.D. Ralston, S. Virtanen, Impact of ultrafine-grained microstructure on the corrosion of aluminium alloy AA2024, Corros. Sci. 57 (2012) 209–214.
[11] O.V. Mishin, A. Godfrey, D. Juul Jensen, N. Hansen, Recovery and recrystallization in commercial purity aluminum cold rolled to an ultrahigh strain, Acta Mater. 61 (2013) 5354–5364.
[12] G.I. Rosen, D. Juul Jensen, D.A. Hughes, N. Hansen, Microstructure and local crystallography of cold rolled aluminum, Acta Metall. Mater. 43 (1995) 2363–2579. [13] U. Chakkingal, A.B. Suriadi, P.F. Thomson, The development of microstructure and the influence of processing route during equal channel angular drawing of pure aluminium, Mater. Sci. Eng. A 266 (1999) 241–249.
[14] K.D. Ralston, D. Fabijanic, N. Birbilis, Effect of grain size on corrosion of high purity aluminium, Electrochim. Acta 56 (2011) 1729–1736.
[15] K.D. Ralston, N. Birbilis, C.H.J. Davies, Revealing the relationship between grain size and corrosion rate of metals, Scr. Mater. 63 (2010) 1201–1204.
[16] T.S. Mahmoud, Effect of friction stir processing on electrical conductivity and corrosion resistance of AA6063-T6 Al alloy, J. Mech. Eng. Sci. 222 (2008) 1117–1123.
[17]W.R. Osorio, C.M. Freire, A. Garcia, The role of macrostructural morphology and grain size on the corrosion resistance of Zn and Al castings, Mat. Sci. Eng. 402 (2005) 22–32.
[18]K.V. Kutniy, I.I. Papirov, M.A. Tikhonovsky, A.I. Pikalov, S.V. Sivtzov, L.A. Pirozhenko, V.S. Shokurov, V.A. Shkuropatenko, Influence of grain size on mechanical and corrosion properties of magnesium alloy for medical implants, Mat.-wiss. u. Werkstofftech 40 (2009) 242–246.
[19]S.H. Kim, U. Erb, K.T. Aust, Grain Boundary Character distribution and inter-granular corrosion behavior in high purity aluminium, Scr. Mater. 44 (2001) 835–839.
[20]C. Luo, X. Zhou, G.E. Thompson, A.E. Hughes, Observations of intergranular cor-rosion in AA2024-T351: the influence of grain stored energy, Corros. Sci. 61 (2012) 35–44.
[21]M. Winning, A.D. Rollett, Transition between low and high angle grain boundaries, Acta Mater. 53 (2005) 2901–2907.
[22]A. Afseth, J.H. Nordlien, G.M. Scamans, K. Nisancioglu, Effect of heat-treatment on filiform corrosion of aluminum alloy AA3005, Corros. Sci. 43 (2001) 2093–2109. [23]A. Afseth, J.H. Nordlien, G.M. Scamans, K. Nisancioglu, Effect of heat-treament on
electrochemical behaviour of aluminum alloy AA3005, Corros. Sci. 44 (2002) 145–162.
[24]H. Leth-Olsen, J.H. Nordlien, K. Nisancioglu, Filiform corrosion of aluminum sheet III. Microstructure of reactive surfaces, Corros. Sci. 40 (1998) 2051–2063. [25]J. Seong, F. Yang, F. Scheltens, G.S. Frankel, N. Sridharb, Influence of the altered
surface layer on the corrosion of AA5083, J. Electrochem. Soc. 162 (2015) C209–C218.
[26]E.V. Koroleva, G.E. Thompson, G. Hollrigl, M. Bloeck, Surface morphological changes of aluminum alloys in alkaline solution: effect of second phase material, Corros. Sci. 41 (1999) 1475–1495.
[27]T. Yamasaki, H. Miyamoto, T. Mimaki, A. Vinogradov, S. Hashimoto, Stress cor-rosion cracking susceptibility of ultra-fine grain copper produced by equal-channel angular pressing, Mat. Sci. Eng. 318 (2001) 122–128.
[28]I.L. Dillamore, W.T. Roberts, Rolling textures in F.C.C. and B.C.C metals, Acta Metall. 12 (1964) 281–293.
[29]D.N. Lee, Y.H. Chung, M.C. Shin, Preferred orientation in extruded aluminum alloy rod, Scr. Metall. 17 (1983) 339–342.
[30]E.A. El-Danaf, M.S. Solimana, A.A. Almajida, Effect of deformation path change on plastic response and texture evolution for 1050 Al pre-deformed by ECAP and subsequently plane strain compressed, Mat. Sci. Eng. A527 (2010) 2547–2558. [31]J.P. Hou, Q. Wang, H.J. Yang, X.M. Wu, C.H. Li, X.W. Li, Z.F. Zhang, Microstructure
evolution and strengthening mechanisms of cold-drawn commercially pure alu-minum wire, Mat. Sci. Eng. A 639 (2015) 103–106.
[32]E.A. El-Danaf, Mechanical properties, microstructure and texture of single pass equal channel angular pressed 1050, 5083, 6082 and 7010 aluminum alloys with different dies, Mat. Des. 32 (2011) 3828–3853.
[33]N. Hansen, Deformation microstructures, Scr. Metall. Mater. 27 (1992) 1447–1452. [34]P.B. Prangnell, J.S. Hayes, J.R. Bowen, P.J. Apps, P.S. Bate, Continuous
re-crystallisation of lamellar deformation structures produced by severe deformation, Acta Mater. 52 (2004) 3193–3206.
[35]M.A. Abdulstaar, E.A. El-Danaf, N.S. Waluyo, L. Wagner, Severe plastic deformation of commercial purity aluminum by rotary swaging: microstructure evolution and mechanical properties, Mat. Sci. Eng. A565 (2013) 351–358.
[36]Q. Liu, X. Huang, D.J. Lloyd, N. Hansen, Microstructure and strength of commercial purity aluminium, Acta Mater. 50 (2002) 3789–3802.
[37]M.-K. Chung, Y.-S. Choi, J.-G. Kim, Y.-M. Kim, J.-C. Lee, Effect of the number of ECAP pass time on the electrochemical properties of 1050 Al alloys, Mat. Sci. Eng. 366 (2004) 382–391.
[38]B.W. Bennett, H.W. Pickering, Effect of grain boundary structure on sensitization and corrosion of stainless steel, Metall. Trans. A 18 (1987) 1117–1124. [39]S.R. Ortner, V. Randle, A study of the relation between grain boundary type and
sensitisation in partially-sensitised AISI 304 stainless stell using Electron Back-Scattering patterns, Scr. Metall. 23 (1989) 1903–1908.