OATAO is an open access repository that collects the work of Toulouse
researchers and makes it freely available over the web where possible
Any correspondence concerning this service should be sent
to the repository administrator:
[email protected]
This is an author’s version published in:
http://oatao.univ-toulouse.fr/21399
To cite this version:
González-Martínez, Rodolfo and De la Torre, Urko and Lacaze, Jacques
and Sertucha, Jon
Effects of high silicon contents on graphite morphology and
room temperature mechanical properties of as-cast ferritic ductile cast irons.
Part I – Microstructure. (2018) Materials Science and Engineering A, 712.
794-802. ISSN 0921-5093
Effects of high silicon contents on graphite morphology and room
temperature mechanical properties of as-cast ferritic ductile cast irons. Part I
- Microstructure
Rodolfo Gonzâlez-Martinez
a, Urko de la Torre
a, Jacques Lacaze
\
Jon Sertucha
a,*
a Irrvestigaci6n y Desarrollo de Procesos Merolûrgicos, IK4-Azterlan, Aliendalde Auzunea 6, E-48200 Durango, Bizkaia, Spain
b CIRIMA T, Université de Toulouse, BP 44362, F-31030 Toulouse, France
ARTICLE INFO ABSTRACT
Keywords:
High silicon ductile iron Chunky graphite Inoculation Thermal analysis
Studying a series of near eutectic spheroidal graphite cast irons with various amounts of silicon up to 9.12 wt% confirmed that: 1. silicon stabilizes ferrite to such an extent that ferrite is the Fe-rich phase appearing during solidification at the highest silicon contents; 2. silicon triggers graphite degeneracy such as chunky graphite. As well-known, ceriurn and magnesiurn do also increase the risk of chunky graphite formation white antimony counteracts ceriurn. Based on the metallographic observations of the present work, an index is proposed to evaluate the risk of chunky graphite appearance from the silicon, magnesiurn, ceriurn and antimony contents. Above a critical value of this index, the risk for chunky graphite formation increases steadily. Using data from previous studies, it is further demonstrated that the critical value decreases with increase in casting modulus as expected. The evolution of mechanical properties of the prepared cast irons will be presented in a second part of this study.
1. Introduction
Among fully ferritic ductile irons, three new grades EN-GJS-450-18, EN-GJS-500-14 and EN-GJS-600-10 have been recently introduced in the European Standard EN-1563:2012. These cast iron grades have been defined as "solution strengthened ferritic ductile irons" as they are alloyed with silicon contents in the range 3.2- 4.3 wto/o. lt has been reported that such high silicon contents promote high nodule count
[1-3] and thus favor matrices with very high ferrite fractions. Such alloys have much higher strength than standard ferritic cast irons with comparatively low silicon contents though at the expense of lower ductility. On the other hand, the appearance of some graphite degen eration such as chunky graphite has also been related to high silicon contents in ductile irons [4-7]. As for the mechanical properties, an optimum silicon content of 4.3 wto/o has been reported on the basis of a limited number of alloys [8] which called for a more extensive study.
Accordingly, the present work reports results on 30 ductile cast irons with silicon contents ranging in between 2.29 and 6.14 wto/o cast in standard Y2 keel-blocks (EN-1563). For helping to understand some of the features observed in high silicon cast irons, an additional alloy at 9.12 wto/o silicon was also prepared and cast in similar conditions. The work is presented in two parts, this first one dealing with
• Corresponding author.
E-mail address: [email protected] (J. Sertucha).
metallographic investigation and characterization of the alloys, the second part to corne with their mechanical properties at room tem perature. Metallographic observations showed graphite degeneracy in some of the castings which appeared worth of a detailed presentation and discussion in comparison to literature information and previous results.
2. Experimental details
A series of 31 ductile cast iron alloys with varying silicon content were prepared in a medium frequency fumace (250 Hz, 100 kW) 100 kg in capacity. The metallic charges consisted of 20% low alloyed steel scrap and 80% low alloyed pig iron. Once melting process was com pleted, the composition was adjusted according to the required carbon and silicon contents by adding high purity graphite ( > 99.0 wto/o carbon) and a FeSi75 alloy (wto/o, Si
=
74.8, Ca=
0.30, Al=
0.76, C=
0.10 and Fe balance) respectively. A check of the melt composition was subsequently made and the melt temperature was then increased to 1510 - 1520 •c. Magnesium treatment was perforrned following the so called sandwich method by transferring 50 kg of the prepared alloy to a ladle where FeSiMg alloy (grain size 5-25 mm, Si=
46.60, Mg=
6.00, Ca=
0.96, Al=
0.71 and rare earth RE = 0.92, Fe balance, wto/o) hadbeen positioned in an amount of 0.6 kg (1.2 wto/o of the batch weight) and then covered with steel scrap (grain size 5-15 mm). After com pletion of the spheroidizing reaction, the alloys were skimmed and then cast in the moulds. An addition of 2.0- 2.5 g Sb was made in the melting furnace to some of the batches (0.004- 0.005 wto/o of the batch weight) in order to study the effect of this element on graphite de generacy in high silicon cast alloys.
The moulds were standard Y2 keel-blocks (EN-1563) which were manufactured with chemical bonded sand. Each mould contained one cavity in which 14 g (0.20 wto/o of the total weight of the ductile iron alloy poured in the mould) of a commercial inoculant (grain size 0.2-0.5 mm, Si
=
69.9, Al=
0.93, Ca=
1.38, Bi=
0.49, RE=
0.37 and Fe balance, wto/o) was added before pouring the melt. Three par ticular castings were manufactured following a different inoculation procedure: casting #29 was not inoculated, casting #30 was inoculated with a smaller (0.15 wto/o) and casting #31 with a higher (0.30 wto/o) amount of the same inoculant.After removing from the moulds, the keel-blocks were cleaned and test specimens were machined out from the bottom area to avoid the presence of shrinkage porosities and inclusions. Both a cylindrical specimen with 10 mm gauge diameter for tensile testing and several parallelepiped samples were obtained from this area. Pieces of these parallelepiped samples were used to perform DTA experiments, hard ness measurements, X-ray diffraction (XRD) and scanning electron mi croscopy (SEM) characterizations.
After testing, one piece of the tensile specimens was used for che mical analysis of the alloys and to perform metallographic character izations. Carbon and sulfur contents were measured by combustion analysis (LECO CS300) while the rest of analyzed elements were de termined by the ICP-MS technique (Agilent 7500ce) after dissolving a metallic sample in a mixture of acids. The results obtained from these analyses are shown in Table 1 where two different carbon equivalent
Table 1
Chemical composition (wto/o) of the cast alloys prepared in this work.
Alloy C Si CE• CE .. Mn p
s
Cu 1 3.15 3.88 4.25 4.36 0.21 < 0.015 0.012 0.07 2 3.16 4.11 4.32 4.44 0.20 < 0.015 0.011 0.05 3 3.16 4.34 4.38 4.51 0.23 < 0.015 0.011 0.04 4 3.10 4.45 4.36 4.49 0.21 < 0.015 0.012 0.05 5 3.08 4.66 4.39 4.53 0.21 < 0.015 0.011 0.05 6 3.13 3.94 4.24 4.36 0.29 0.020 0.010 0.03 7 3.13 4.25 4.33 4.45 0.25 0.018 0.012 0.03 8 3.10 4.45 4.36 4.49 0.25 0.019 0.013 0.03 9 2.93 4.93 4.32 4.46 0.26 0.020 0.012 0.03 10 2.93 5.11 4.37 4.52 0.26 0.019 0.013 0.03 11 2.95 4.84 4.31 4.46 0.16 0.016 0.009 0.04 12 2.91 5.04 4.33 4.48 0.18 < 0.015 0.010 0.04 13 2.69 5.32 4.19 4.34 0.18 < 0.015 0.010 0.04 14 2.72 5.55 4.28 4.45 0.20 < 0.015 0.010 0.04 15 2.75 5.70 4.36 4.52 0.21 < 0.015 0.010 0.05 16 2.71 5.15 4.17 4.32 0.19 0.019 0.009 0.07 17 2.65 5.42 4.18 4.34 0.19 0.018 0.008 0.04 18 2.75 5.36 4.26 4.42 0.20 0.017 0.010 0.04 19 2.76 5.39 4.28 4.44 0.20 0.017 0.010 0.05 20 2.77 5.56 4.34 4.50 0.20 0.018 0.010 0.04 21 2.64 6.11 4.36 4.54 0.18 < 0.015 0.006 0.03 22 2.71 6.14 4.44 4.62 0.18 < 0.015 0.006 0.03 23 2.96 4.61 4.26 4.39 0.21 < 0.015 0.008 < 0.02 24 2.90 4.60 4.19 4.33 0.22 < 0.015 0.007 < 0.02 25 2.31 5.21 3.78 3.93 0.21 0.018 0.008 0.22 26 3.67 2.29 4.32 4.39 0.18 0.018 0.006 0.04 27 2.26 5.75 3.88 4.05 0.21 0.018 0.006 0.06 28 2.41 9.12 4.97 5.24 0.21 0.018 0.008 0.04 29 2.85 4.63 4.16 4.29 0.21 < 0.015 0.005 0.08 30 2.93 4.74 4.27 4.40 0.19 < 0.015 0.005 0.07 31 2.95 4.87 4.32 4.47 0.19 < 0.015 0.005 0.07CE* = C + 0.28-si + 0.007·Mn + 0.092·Cu + 0.303·P [9].
CE** = C + 0.31 ·Si - 0.027-Mn + 0.076-Cu + 0.33·P + 0.40-S [10].
Table 2
Criteria used for the classification of graphite particles. Class III V VI Circularity 0.00-0.60 0.50-0.77 0.77-1.00
Height-width Feret ratio 2.0-1000
1.0-1.5 1.0-1.5
values were included according to Castro et al. [9] and the ASM handbook [10]. Most of the alloys are near eutectic, apart alloys #25 and #27 which are significantly hypoeutectic and alloy #28 which is strongly hypereutectic.
Metallographic analyses were performed close to the rupture sur face of the tensile specimens. After polishing the samples, three re presentative pictures at 100 x magnification (0.757 mm2 each) per
sample were taken without etching for image analysis of graphite using the ImageJ software. In this step, all graphite particles with an area equal to or higher than 15 µm2 were counted, then assigned to class III,
V or VI according to the ISO 945-1 standard and their area was mea sured. Classification of particles was carried out taking into account their circularity and their height-width Peret ratio [11] values using the criteria shown in Table 2. Those particles that could not be assigned to one of these classes by means of image analysis were then classified by visual analysis.
As it will be stated later, graphite particles classified in class III were considered as chunky graphite (CHG) except in case of the non-in oculated alloy #29 where degenerated graphite particles were identi fied as vermicular ones. The number and area of particles in each class were used for determining the number fractions
Cf!:"//3',
gount and f;f"nt)and area fractions CJtHG'
t:
and f�). The final values reported latercorrespond to the average from the values measured in the three dif ferent fields. The nodule count was also determined from the number
Cr Ni Ti Sn Mg Ce La Sb 0.04 0.07 0.019 < 0.005 0.039 0.0059 0.0033 < 0.0005 0.04 0.06 0.020 < 0.005 0.039 0.0050 0.0026 < 0.0005 0.04 0.08 0.020 < 0.005 0.040 0.0064 0.0040 < 0.0005 0.04 0.05 0.020 < 0.005 0.040 0.0063 0.0034 < 0.0005 0.04 0.07 0.020 < 0.005 0.040 0.0061 0.0033 < 0.0005 0.04 0.06 0.077 < 0.005 0.036 0.0060 0.0035 0.0038 0.04 0.06 0.024 < 0.005 0.040 0.0060 0.0033 < 0.0005 0.04 0.07 0.020 < 0.005 0.039 0.0058 0.0031 0.0037 0.04 0.05 0.020 < 0.005 0.041 0.0061 0.0033 0.0028 0.04 0.05 0.022 < 0.005 0.036 0.0055 0.0030 0.0035 0.03 0.04 0.019 < 0.005 0.033 0.0055 0.0031 0.0040 0.04 0.06 0.019 < 0.005 0.035 0.0057 0.0031 0.0036 0.04 0.06 0.020 < 0.005 0.039 0.0059 0.0033 0.0040 0.04 0.06 0.020 < 0.005 0.033 0.0055 0.0031 0.0044 0.04 0.07 0.020 < 0.005 0.043 0.0062 0.0034 0.0039 0.03 0.09 0.018 < 0.005 0.043 0.0073 0.0044 0.0031 0.03 0.07 0.018 < 0.005 0.038 0.0078 0.0047 0.0031 0.03 0.05 0.019 < 0.005 0.040 0.0075 0.0042 0.0034 0.03 0.04 0.020 < 0.005 0.041 0.0079 0.0044 0.0029 0.04 0.06 0.018 < 0.005 0.034 0.0075 0.0045 0.0025 0.04 0.03 0.013 < 0.005 0.046 0.0063 0.0040 < 0.0005 0.04 0.03 0.012 < 0.005 0.044 0.0066 0.0042 0.0042 0.05 0.02 0.009 < 0.005 0.043 0.0045 0.0026 < 0.0005 0.06 0.02 0.009 < 0.005 0.036 0.0049 0.0029 0.0059 0.04 0.04 0.027 < 0.005 0.040 0.0068 0.0045 < 0.0005 0.04 0.03 0.025 < 0.005 0.035 0.0060 0.0039 < 0.0005 0.04 0.03 0.027 < 0.005 0.037 0.0060 0.0039 < 0.0005 0.04 0.03 0.027 < 0.005 0.032 0.0054 0.0040 < 0.0005 0.03 0.03 0.008 0.005 0.042 0.0048 0.0031 < 0.0005 0.02 0.03 0.008 < 0.005 0.045 0.0054 0.0034 < 0.0005 0.02 0.03 0.008 < 0.005 0.043 0.0053 0.0032 < 0.0005
count of particles in class V and VI, Nv+vi, or only in class VI, Nvi. The metallographic samples were then etched using Nital 5% to check the amount of ferrite and pearlite. This also allowed detecting the presence of minor phases in some of the alloys. Sorne of the metallo graphic samples were deep-etched in order to partially remove the metallic matrix and to analyze the 3D graphite morphology. The deep etching procedure consisted of an etching with a 40% HN03 aqueous
solution for 60-90 s, followed by washing with a 50% HCI aqueous solution for a few seconds, both steps at room temperature. Scanning electron microscopy (SEM) was used to observe differences in graphite shape and distribution on the Nital-etched and the deep-etched sam ples. For this purpose, an Ultra Plus Carl Zeiss SMT apparatus with 0.8 nm resolution at 30 kV was employed. An X-Max 20 Oxford Instruments EDS detector with 120 eV resolution was used for de termining the local chemistry.
Sorne alloys with various Si contents were subjected to Differential Thermal Analysis (OTA) using a SETARAM SETSYS 16/18 instrument. OTA specimens were cylinders 3.9 mm in diameter and 4-5 mm in length except for alloy #28 at 9.12 wto/o Si when the sample was a small piece hammered out from one sample. Aluminium oxide powder was used to fill the reference holder. DTA runs consisted in heating to 1250 •c, holding at that temperature for 10 min and then cooling down to room temperature. The scanning rate upon heating and cooling was l0 °C/min.
X-ray diffraction (XRD) analyses were used to characterize the constituent phases in the different cast iron alloys prepared in the present work. These characterizations were carried out on a Bruker D8 Advance powder diffractometer using Cu-Ka radiation (40 kV, 30 mA) with a Bragg-Brentano geometry with fixed slits and a graphite mono chromator. The scanning range was 5-70° in 20 (step: 0.03°, time per
step: 2 s). The samples were prepared to obtain fiat polished surface for analysis. Phase identification was performed using the DIFFRAC plus Evaluation software together with the PDF2 data base of the International Centre for Diffraction Data (ICDD).
3. Results
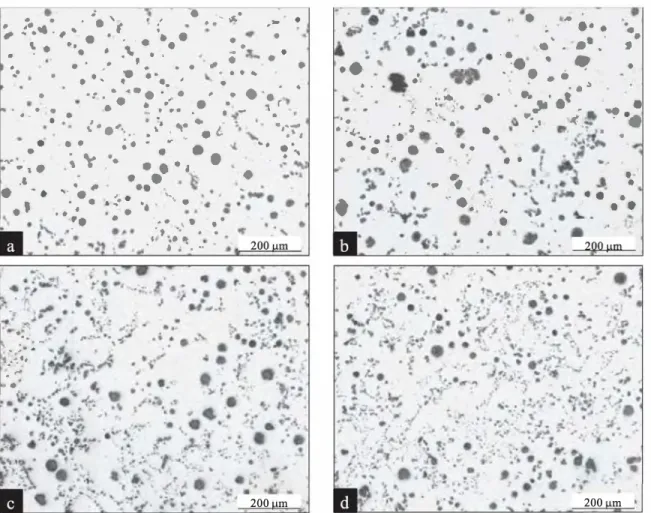
As it has been mentioned in the introduction, some level of de generate graphite could be observed in an important number of the studied alloys. As a matter of fact, 19 of the 31 cast irons prepared in the present work were found to present this defect at various levels. The micrographs in Fig. 1 show examples where graphite degeneracy oc curred at different intensities: low, medium, high and very high.
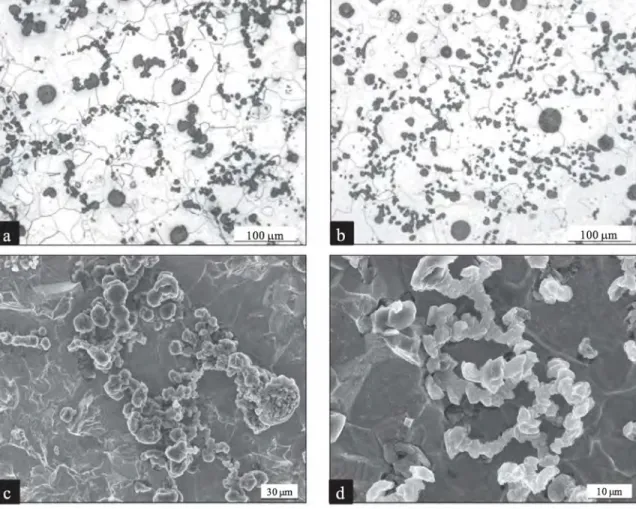
At higher enlargement as seen in Figs. 2a and 2b, degenerate gra phite clearly appears as alignments of small graphite particles sug gesting they are interconnected. This was demonstrated by deep etching of the metallographic sections as illustrated in Figs. 2c and 2d. Further, the characteristic features of these graphite precipitates show this is chunky graphite.
According to the standard nomenclature (EN-ISO 945-1), it can be considered that graphite particles of classes V and VI are counted as nodules. Ail the remaining graphite particles appear in class III and are associated with degenerate graphite which was identified as chunky graphite in al! alloys but alloy #29. In this latter alloy, degenerate graphite was seen to be vermicular with ff;;"ni = 0.12 and f1� = 0.25. In ail other alloys, fm will be denoted as fcHG• In Table 3 are reported the nodule counts and the number and area fractions of graphite in the three classes. Note that, because of the procedure used here, the lowest nodule counts are found in alloys with the highest amount of degen erate graphite.
Ail alloys were fully ferritic but alloy #26 which presented 3-5 surface % of pearlite, probably due to the comparatively low silicon content (2.29 wto/o). The presence of minor phases in the metallic ma trix is also reported in Table 3 by using three different comparative levels. In an important number of alloys, very low level of these minor phases were detected which are reported here as PFesic and PTic (see
later in the text).
As pointed out in the introduction, higher silicon contents increase the risk of chunky graphite formation. This was verified in the present study and is further discussed in the next section. One of the ways to limit this effect of silicon is to add a small amount of antimony if some cerium is also present. This was verified in the present study where alloys with similar silicon content but with and without Sb addition showed lower and higher amount of degenerate graphite, respectively.
Fig. 3 is a plot of the amount of chunky graphite, f<iHG' versus Si content
where alloys with (open squares) and without (solid circles) Sb addition have been differentiated. Four alloys without any Sb addition and which are somehow out of the series are located with crosses: alloy #25 is highly hypoeutectic, alloy #28 is the one with more than 9 wto/o Si and alloys #30 to #31 have received different inoculation treatment than the others. lt is clearly seen that Sb addition decreases the amount of chunky graphite in alloys prone to its formation.
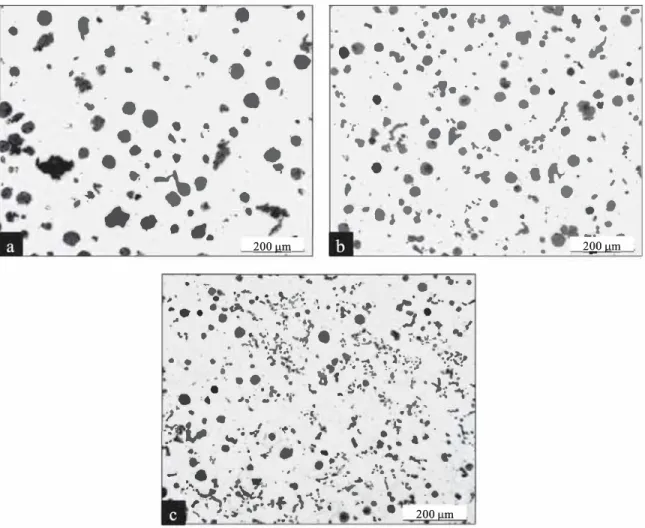
Although addition of inoculant has been reported as promoting chunky graphite formation [6,12,13], this effect still remains con troversial. Thus, alloys #29, #30 and #31 were prepared using dif ferent inoculation additions, namely no addition, 0.15 wto/o and 0.30 wt %, so as to check the effect of inoculation on chunky graphite forma tion. As mentioned above, the non-inoculated alloy #29 contains coarse and irregular vermicular graphite particles and not chunky graphite as illustrated in Fig. 4a. The comparison of results in Table 3 for alloys #30 (Fig. 4b) and #31 (Fig. 4c) reveals that chunky graphite areas increase significantly as inoculation does. This strong tendency could be related to the fact that increased inoculation leads to the increase in silicon and rare earth contents as well as to a lower undercooling during eutectic transformation [6].
A particular interest has been focused on microstructural features of alloy #28 with 9.12 wto/o silicon where graphite particles are surpris ingly quite well-formed nodules in most areas (Fig. Sa) though irregular ones similar to so-called exploded graphite are detected together with nodules in other locations (Fig. Sb). In this alloy also, two different minor phases have been detected, namely small faceted particles (Fig. 6a) and narrow precipitates (Fig. 6b).
EDS microanalysis was performed on these minor phases and compared to the analysis of the surrounding matrix. Compact faceted particles are mainly composed by Ti and C though peaks of Mo are often found, suggesting titanium carbide. They will be designated TiC parti cles. Analysis of the narrow precipitates and the matrix surrounding them showed peaks of Fe, Si and C, with the C peak of the matrix much smaller than for precipitates. It could be inferred this is an iron-silicon carbide such as the Fe8Si2C phase previously selected to describe the
metastable Fe-Si-C phase diagram [14]. This phase will be denoted FeSiC in the following. XRD analysis did not allow recording lines other than those associated with the matrix which was found to be B2-or dered bec in alloy #28 in agreement with its high silicon content [14].
It could be noted that FeSiC precipitates were always located at ferrite grain boundaries which are the solidification grain boundaries as the alloy solidified with precipitation of ferrite from liquid. Moreover, TiC particles were more numerous away from graphite particles, though very seldom at ferrite grain boundaries. Because of the small size of both types of precipitates, it is very difficult to infer if they formed during solidification or by solid-state precipitation. As a matter of fact, thermodynamic calculations performed using the TCFE8 database and the Thermocalc software showed TiC would not form at equilibrium for the Ti level of the present alloys. Its appearance must then relate to microsegregation build-up during solidification. The formation of the FeSiC phase is discussed in the next section.
Systematic SEM observation was performed to look for the presence of TiC and FeSiC precipitates in ail alloys. The results are shown as PTic
and PFeSiC in Table 3 where this presence is classified as no, low,
medium or high. It is noticed that TiC particles could be seen in ail alloys without a clear correlation between Ti content and number of particles. On the contrary, a clear trend was found for FeSiC phase
• .. • . .... '
t. /
, .: ·" - #.. • • • ••
....
---
•--
•
•
�
.
··•
.
.
.
�
·"
.
-
'.
·
...
.
◄•
•
,,
.
•
•
•
.
�·
•
•
.
.
•
..
'
....
...
.
,
... ...
.
.
•:,• -#··
·
. , · -··
■ ••• • • • • • .-.
... .
• •.
- .
, r.
·.
,.
.
..,.
.
•
•
. .. 1. • &.
.
,
-
.
•
.
..
.
-.
..
.
.
...
�
•,
.
..
,..
•
. .
�
..
, .
.
.
.
;
.
. \
.
_.,.
. �
.
•
t.
"'•
•,:ï",
�-""
' '" ..
.
..
,
.
�-
•·.
•
"
••
�-
•
•
•
•
•
•
'
•
.
'-..
.
.
.
�
...
.
...
\
. .
.
,·,��-,
. .
.
, ...
•
200 m.
••·
.. .
..
.
.
.
.
••
• ·,t...
... �
•.
• 1.;
.
.
.
:'•
.
.
..
,
, ..
:
-.
;..
•
•
•'
•
.
••
.
•
••
•
-�
. . .
•• • •• •
.
.
�
•
•
••
•
•. • • . t
J, • .,. •-•
•
·> �
• •
.,
.
•
•
•
••
• •
·-
,
..
..
.
.
:, ..
•
•
••
• •
•
••
200 mFig. 1. Examples of degenerate graphite amount: (a) alloy #22 with f/Ha = 0.11, (b) alloy #1 with tt",IG = 0.19, (c) alloy #2 with ft",w = 0.34 and (d) alloy #4 with f/Ha = 0.39.
which was generally observed at higher level with increased alloy si licon content. The maximum fraction of this phase was anyway quite low with a maximum at about 0.003-0.004 for alloy #28 (9.12 wto/o Si).
Alloys #4 (4.45 wto/o Si), #12 (5.04 wto/o Si), #14 (5.55 wto/o Si), #21 (6.11 wto/o Si) and #28 (9.12 wto/o Si) were subjected to OTA fol lowing the conditions indicated previously. Fig. 7 shows the set of OTA records in the upper temperature range when melting occurs. The main peak corresponds certainly to eutectic melting while the small peak that appears between 1145 •c and 1160 •c depending on the alloy probably relates to the reaction associated with melting of the iron-silicon car bide. In case of alloy #28, the sample was a broken piece and not a well machined cylinder. Accordingly, the OTA signal upon melting was smoother than for the other alloys but the same thermal arrest could definitely be observed when looking at the record with an enlarged scale.
OTA records for solidification showed features characteristic for solidification in the stable system, and in particular with no arrest that could relate to precipitation of FeSiC phase. Observation of the mi crostructure of these remelted alloys gave results much in line with a previous work [15] where the presence of chunky graphite in the ori ginal samples was correlated to the highest magnesium contents in the alloy. These results will be detailed and discussed elsewhere.
Fig. 8 presents the set of OTA records upon cooling in the tem perature range of the eutectoid transformation. The temperature for the start of this transformation increases from about 850
·c
to 970·c
when alloy's silicon content increases from 4 to 6 wto/o, while no eutectoid transformation occurs in alloy #28 (9.12 wto/o Si) because it is fully ferritic from solidification to room temperature. Ail records present a peak in between 600 •c and 725 •c corresponding to the magnetic Curie transition of ferrite, at a temperature that decreases with increasingsilicon content.
The eutectoid transformation has been characterized by the onset temperature and the values read in Fig. 8 are plotted in Fig. 9 with open circles. The peak temperature was used for the Curie transformation and the values are reported with closed circles in Fig. 9. For plotting these experimental values, the silicon content has been multiplied by 1.05 for accounting for graphite precipitation. These experimental va lues may be compared to calculations performed using Thermocalc and the TCFE8 database for alloys containing 0.2 wto/o Mn. The interrupted line is the calculated Curie temperature of ferrite which is seen to agree with experimental values. The solid line represents the lowest tem perature of the austenite-ferrite-graphite three-phase field. This so called Ta temperature is the one at which the eutectoid transformation
is expected to start upon continuous cooling. lt is seen that the eutectoid transformation starts with an undercooling of about 20 •c in quite a good agreement with previously reported data for a cooling rate of 10 °C/min. The dotted line represents the Ta temperature calculated as: T0 CC) = 739 + 18.4·wsi + 2 (wsi)2 - 45-w
Mn [16]. It is seen that this
formula applies up to 4 wto/o Si but would have to be corrected for higher values.
4. Discussion
The discussion of the above results will focus on two a priori dif ferent aspects, i) thermophysical properties of high-silicon cast irons and ii) the formation of degenerate graphite in the form of chunky graphite. Both of these aspects are however closely related to me chanical properties which will be dealt with in the second part of this work.
As a matter of fact, silicon is known to lead to ordering of the bec structure of Fe-Si alloys (see appropriate references in the work by
Fig. 2. High magnification optical micrograph of alloy #1 (a) and alloy #4 (b), and SEM micrograph of deep-etched alloy #2 (c) and alloy #5 (d).
Lacaze and Sundman [14]), and there is no doubt it has the same effect on ferrite in cast irons which contains very little carbon. As mentioned above, ordering could be detected by XRD analysis in alloy #28 at 9.12 wt% Si but it is guessed that partial ordering certainly takes place at lower silicon contents. When the alloy's silicon content is increased, ferrite is stabilized at higher and higher temperature and the eutectoid temperature is raised as illustrated in Fig. 9. According to the assess ment of the Fe-C-Si system [14], alloys with nominal silicon content higher than 7 wt% should solidify with ferrite and graphite and not austenite and graphite. This is indeed what is observed with alloy #28 with a DTA thermal record that does not show any solid-state trans formation (see Fig. 8).
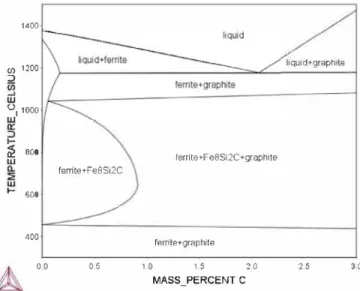
Fig. 10 presents an Fe-C isopleth section of the stable Fe-Si-C system at 9 wt% Si. Under equilibrium, it is seen that solidification should totally proceed giving ferrite and graphite, but also that the Fe8Si2C
silicon-carbide which was considered in the assessment [14] appears at temperature below about 1050 •c. Though the validity of the thermo dynamic assessment in this range of composition may be questioned as very little experimental information is available, Fig. 10 suggests that the narrow precipitates reported in this work could well have formed by solid-state precipitation.
Because chunky graphite has been reported to affect mechanical properties of cast irons, many attempts have been made to correlate its appearance with casting parameters known to favor or to hinder its formation. Casting modulus and inoculation have often been discussed, but the silicon content and the presence of low-level elements appear by far the most important issues. In many cases where the silicon content of the investigated alloys did not change much, the ratio of the amounts of cerium which promotes chunky graphite and of antimony that counteracts its effect has been considered [17,18]. Such a simple ap proach has been extended to account for other elements [19]. Also, a
statistical analysis of more than 60 castings having similar silicon contents but varying amount of Sb, Cu, Sn, Ce, La and P has been achieved with quite a good correlation coefficient [20], though not ail of the predicted cross correlations between these low-level elements could be clarified.
Fig. 3 confirms that silicon promotes chunky graphite formation as already well established [ 4,5]. More specifically, this figure suggests that there is a risk for chunky graphite formation when the silicon content goes beyond some critical level, and it makes clear this level is increased when antimony is added. Antimony counteracts the effect of cerium by combining with it, while it does not tight magnesium which is also known to lead to similar graphite degeneracy than cerium when added in excess. Fig. 3 thus suggested looking for an index that would increase with silicon, cerium and magnesium content and decrease with antimony content. Further, it can be assumed that antimony is added at level such that it is totally tight by cerium. By trial and error, it was found that considering these two elements precipitate as CeSb2 gives
much better results than if this were CeSb. Finally, the following index could be proposed: ( 55 55 ) 55 Os· = Ws· + 800· Wc ·-- - 2·Wsb·-- + 5 0·WM ·--1 1 e 140.1 121.8 g 24.3 (1)
where w; is the content in wt% of element "i", and 55, 140.1, 121.8 and 24.3 are the atomic mass of cast iron, cerium, antimony and magne sium, respectively.
The Q5; index is plotted in Fig. 11 versus the f<iHc values given in
Table 3, with solid circles for alloys without antimony added, open squares for alloys with antimony added and crosses for the same special castings as in Fig. 3. Apart for three of these special castings, it is seen that the results are fairly clustered with a steep increase in f <iHc when
Table 3
Microstructure data obtained from tbe cast irons prepared in tbe present work.
Alloy Nv,(mm-2) 1 302 2 375 3 372 4 465 5 446 6 371 7 407 8 538 9 448 10 493 11 388 12 445 13 349 14 405 15 463 16 329 17 253 18 455 19 428 20 389 21 119 22 377 23 189 24 395 25 113 26 355 27 (a) 41 28 (b) 407 29 (c) 73 30 (d) 225 31 (e) 220
(a) Strongly hypoeutectic alloy. (b) High silicon alloy.
Nv+v1 (mm-2) f/-'Ounl CHG 462 0.13 529 0.31 548 0.33 668 0.33 579 0.35 492 0.00 515 0.24 644 0.02 538 0.15 614 0.01 474 0.00 541 0.02 473 0.15 504 0.03 613 0.11 404 0.03 325 0.14 604 0.09 583 0.16 498 0.25 143 0.87 457 0.08 261 0.50 486 0.00 179 0.02 437 0.00 54 0.96 474 0.08 153 (c) 306 0.10 270 0.62 ft'OUnl 0.29 0.20 0.21 0.20 0.14 0.25 0.16 0.16 0.14 0.19 0.19 0.17 0.22 0.19 0.22 0.18 0.19 0.22 0.22 0.16 0.02 0.16 0.14 0.19 0.36 0.19 0.01 0.12 0.46 0.24 0.07
(c) Non-inoculated alloy witb vermicular graphite Cfi'f'i"n, = 0.12 and ffii = 0.25).
(d) Inoculation at 0.15 wto/o. (e) Inoculation at 0.30 wto/o.
2
0.8 ro�
0.60
C: 0.4 ro�
ro 0.2�
0 2 3•
X 31•
•
• •
,
□
□
Cri
•
□
30x□□
□
25□
4 5•
□
6 • no Sb □ with Sb x special castings x28 7 8 9Alloy silicon content (wt. % )
10 Fig. 3. Amount of chunky graphite, fJw, versus silicon content. Numbers nearby tbe crosses are alloy number of four out-of-series castings (see text).
lt may be stressed that accounting for the lanthanum content did not
improve the result. Other elements that could affect graphite shape are sulfur, which was assumed to be totally tight by manganese, and phosphorus which did not vary enough in this work to allow for any effect to be evaluated. ft:]Unl ftHG 0.58 0.19 0.49 0.34 0.46 0.31 0.47 0.39 0.51 0.34 0.75 0.00 0.60 0.30 0.82 0.04 0.70 0.18 0.79 0.02 0.81 0.01 0.81 0.04 0.63 0.23 0.79 0.03 0.67 0.15 0.79 0.04 0.67 0.21 0.68 0.15 0.62 0.26 0.59 0.33 0.11 0.65 0.76 0.11 0.36 0.43 0.81 0.00 0.61 0.06 0.81 0.00 0.03 0.88 0.79 0.17 0.42 (c) 0.66 0.14 0.31 0.57 ft fJ 0.30 0.50 0.18 0.47 0.23 0.45 0.19 0.42 0.15 0.51 0.34 0.66 0.17 0.53 0.19 0.77 0.13 0.69 0.19 0.79 0.22 0.77 0.19 0.77 0.22 0.56 0.19 0.79 0.21 0.65 0.20 0.76 0.17 0.62 0.24 0.61 0.21 0.54 0.17 0.50 0.06 0.29 0.15 0.74 0.15 0.42 0.21 0.79 0.43 0.51 0.23 0.76 0.03 0.09 0.14 0.70 0.40 0.35 0.22 0.64 0.08 0.35 PFeSiC Pnc Low Low Low Low Medium Medium low Medium Low Low Low Medium Medium Medium Medium Medium Low Low High Low Medium Low Low Low Low Medium Medium Low Low Low Low Medium Low Low High Low Low Low Medium Low Medium Medium High Low Medium Low Medium Low High High Low Low Low
The same approach was then applied to results obtained previously on heavy sections blacks (modulus 5 cm) cast without [21] and with cerium and antimony [18] additions. Ail alloys in these series of cast ings were near eutectic with a silicon content varying between 2.07 and 2.35 wto/o. In these previous works, the extent of chunky graphite was evaluated with two parameters, Vv which indicated how much of the casting was affected by degenerate graphite, and AA that was the area
fraction of chunky graphite at the scale of the microstructure. This is this latter quantity that can be compared to Jf!Hc· The results of these
previous studies are plotted with open symbols in Fig. 12 where they can be compared to the present results with solid symbols. The special castings of the present work have not been represented in this case. There is one point in the previous series that gives a very low index, it relates to a casting to which significant amount of antimony was added while very little cerium was present. As Fig. 11, Fig. 12 shows that the amount of chunky graphite increases when Qs; does. However, it is seen that the critical value is lower for these previous results, in between 4 and 4.5. This is assumed to be due to the larger modulus of the casting (defined as the ratio of the volume over the outer area of the casting) used in these previous studies as suggested with the arrow in Fig. 12.
A last comment concems the fact that chunky graphite was not observed in the alloy at 9.12 wto/o Si. lt is guessed this is due to the fact that it solidifies with ferrite instead of austenite as Fe-rich phase. lt would have been useful to discuss the possibility for coupled growth of chunky graphite and ferrite by considering the mechanical equilibrium between these phases and liquid at the solidification front, as already done for cast irons with lower level of silicon solidifying with austenite as Fe-rich phase [6]. However, the necessary interfacial energies be tween these three phases are not known for ferritic alloys with such a
•
•
'
•
'
,
.
�
..
�
·
•
•
•
-.
••
•
I!•
,
..
'
•
•
•
.
.
;.
•
•
•
•
•
•
"·
•
...
.
·
·,
..
.. .
•
••
f--.1
•
"
"
.
• Il\, ·•• l -••
• - #1•
•
•·
·
•
.
.
•
•
•
...
-
•
•
•
•. .... •_ ..
• •
•
I
-•
•
,I_
•
.,
-"•
•
•
•
•
•
••
• ••••
•
••
�
·
tr
',
.
•F ••
.... �.
·
,.
...
�:.•
•
.
• •
t
_
':I ... . I..
.
�.
•
..
f
•..
·
.,
.
•
•
••
•
•
_
•• J .
..•.
J !-.. .. : • ;'
.
200µm.
.
-
..
�
..
.,
..
.,.-"'
.
.. ..
,
:
.
'
,•
..
,..
�"'�.
.
• ... .,, .. ,.V-.� •·· .. ,._a ...,,,,_ ,_ ... •""'• •
.. • • . .... �,.
•
..,,.
. -
�
·
·
•.• ·t-.
• .
•
•
•
•
1
•
:J. .• .,
\.l • . . • .. ,.;, • � • . ' • ._ .,...\ ._,. �-. • � _:...?.., �� -;"·.:-!:
.J • ,""'i';.; .. • ('· ..,._ • > • � • • ') • . • .,,..,,.;-:\ t l .1,:_:1 -.�? • • .. li, 1., ;1- ... :� •• . • • •.. • l,,. Q �---�. •.t-
•
·,j..-
.
• ,. ., .. • _..,.,.,• A . .: -�°"
"
•t"' • ...�,· ,.·
.
t
.
�
'.
r
v·.
; ;
·
.,.
.
...
. --r,,�• .g.
• . r -�·• I � • Ai � • ...
•.-• ,,.
.
.• 1.
.,.:(..
.
:..
• ....\
..�1-. ...
9 � •• , ... ....,,.
.
-
,.
.
,.
"'.
.
.
,
.
.
.
. .
.��
.
:...
.
�
.
.
.
•
.
\'
.
.
. ...
'-'-' ,- ""'.( f ,.
,:_"-.__•:..i •... '
•"- .Af/1:.
..
l.\
'C. •.
•
,. " ;; .. . . � : �I'' .. ,, :; ' . �· • • -••, · ., 200 m ...
•
•
_t•_•
•
•
2Q.0 µm.
Fig. 4. Graphite morphology in alloy (a) #29 non-inoculated, (b) #30 inoculated with 0.15 wt% and (c) #31 inoculated with 0.30 wt%.
high silicon and carbon content. 5. Conclusion
lncreasing silicon content of as-cast ferritic ductile irons has shown significant effects on the solidification of alloys and on resulting gra phite morphology. A gradual stabilization of ferrite is obtained as si licon content is increased up to promoting the liquid to ferrite-graphite solidification in the alloy with the highest silicon content (9.12 wto/o). Regarding graphite particles, important amounts of degenerated shapes assigned to chunky graphite have been obtained when increasing
•
..
.
.
...
•
·
.
•
..
•
•
• • •
••
••
•
.•
•
•
.. .
•
•
.
•
.
•
. ·
.
.
:;..
.
.
·
,.
.
• #'••
•
.
•
.
•
•
.
.
.
.
.
.
•
.•
.
.
.
.
,.
.
•••
. ...
: .
.:
••
•
• •
•
. .
. ..
'
•
.
•
.
..
.;! •
•
.
.
.
•• •
•:
'! •
•
.
:
.
•
-..
'
•
•
•
•
•
••••
•
••
.
••
•
.
. .
.
..
. .
.
....
.
•.,
•.
•
.
··
.
.
.
...
•
•
•
..
-�
.
.
• ••
.
,,.
•
.,
.
...
..:
..•
..
.
•.
..
Ît•. .
• • •.
• •·
-
·
•
.
.
.
. ..
.
.
...
••
.
•
.
•
.
. ...
...
.
•
•
•
•
.
..
·'
-
·
.
.
. ..
.
•
200µmsilicon levels. In a number of alloys, antimony additions were effective for decreasing the formation of chunky graphite even at silicon contents higher than 6 wto/o.
While not giving an explanation for chunky graphite formation, the present work proposes an index allowing for predicting the risk of such graphite degeneracy. The critical value of this index will be reached with increased amounts of silicon, cerium and magnesium, while ad dition of antimony decreases the risk. The most interesting aspect of the present approach is that it accounts for chemical combination of anti mony and cerium which is expected to be the reason for the beneficial effect of the former. This opens up possibilities for extending to other
.
,,
..
....-.
•
50 mFig. 6. (a) Faceted particles and (b) narrow precipitates at grain boundaties in alloy #28. 50 9.12 0 6.11
-
5.55 :::, -50 5.04.i
4.45 C: -100 Cl,;;
-150 0 -200 -250 -300 1140 1160 1180 1200 1220 Temperature (°C)Fig. 7. DTA records in the range of temperature where melting occurs. Numbers refer to the alloy silicon content.
100 9.12 80 6.11 60 ::i 40 5.55
�
ëii 20 C: 5.04 ëii 0�
-20 0 4.45 -40 -60 600 700 800 900 Temperature (°C) 1000Fig. 8. DTA records upon cooling in the temperature range of the eutectoid transfor mation. Numbers refer to the alloy silicon content.
1100 1000
ü
.. ·
.. ·
Q) 900 o.··· ·· ........ •·
·o..
-·
:::, .... Q) 800 a. Q) --700-
..
...
..
_
.---600 0 2 4 6 8 10Silicon content (mass.%)
Fig. 9. Evolution with silicon content of the onset temperature for the eutectoid trans formation upon cooling (open circles) and of the peak temperature of the Curie transition (solid circles). Lines ate calculated, see text.
1400 !/l 1200 ::::, ... w u, 1000 w � 800 w 1- 600 400 00 ferrite+Fe8St2C 0.5 ferrite+Fe8Si2C+graph1te
ferrite+graphite
1 0 1 5
MASS_PERCENT C
20
liqu1d+graph,te
2.5
Fig. 1 O. Isopleth Fe-C section of the stable Fe-Si-C system at 9 wto/o Si.
:ë C. Cl � C: ::J ..c:
ô
0.8 0.65
0.4 � CO 0.2 � <( 0 0 • no Sb□
Sb added x special castings 5 □ �•
•
X• •
'tJ •.,.
□ri:
X X □ □ X 10 .QSi 15 Fig. 11. Correlation between the index Q5; and the amount of chunky graphite fJw•08 § 0.6 ..c: (.)
ë
C: .!2 Q 04 0.2 0 0•
■ 0 D no Sb, present study Sb added, presenl sludy no Sb. prevlous studles Sb adaed, prevlous stuaies increasing casting modulus D D 5 0 0 0 D 1 1 1 1 1 p 0•
•
. ,,
•
■ ■ ■••
•
• 0 ■ 10 15Fig. 12. Correlation between the index Q5; and the amount of chunky graphite as given by ftna for the present results and by AA for previous results [18,21]. The vertical in terrupted lines show that the critical index value decreases when the casting modulus increases.
low-level elements and could be sustained by the development of a corresponding thermodynamic database.
Acknowledgements
The authors want to thank TQC Technologies for experimental support. This research did not receive any specific grant from funding agencies in the public, commercial or not-for-profit sectors.
References
[1] J. Khalil-Allafi, B. Amin-Ahmadi, Influence of mold preheating and silicon content on microstructure and casting properties of ductile iron in permanent mold, J. Iron Steel Res. 18 (2011) 34-39, http://dx.doi.org/10.1016/S1006-706X(11)60034-4. [2] P. Weiss, J. Brachmann, A. Bührig-Polaczek, S.F. Fischer, Influence of nickel and cobalt on microstructure of silicon strengthened ductile iron, Mater. Sei. Technol. 31 (2015) 1479-1485, http:/ /dx.doi.org/10.1179/1743284714Y.0000000735. [3] U. de la Torre, A. Loizaga, J. Lacaze, J. Sertucha, As cast high silicon ductile irons
with optimised mechanical properties and remarkable fatigue properties, Mater. Sei. Technol. 30 (2014) 1425-1431, http://dx.doi.org/l0.l179/1743284713Y . 0000000483.
[ 4] J. Zhou, W. Schmitz, S. Engler, Untersuchung der gefügebildung von gusseisen mit kugelgraphit bei langsamer erstarrung, Giesserelforschung 39 (1987) 55-70. [5] B. Prinz, K.J. Eschbom, T. Schulze, R. Dôpp, E. Schurmann, Untersuchung von
ursachen von graphitentartungen bei gusseisen mit kugelgraphit in form von chunky-graphit, Giessereiforschung 43 (1991) 107-115.
[6] U. de la Torre, J. Lacaze, J. Sertucha, Chunky graphite formation in ductile cast irons: effect of silicon, carbon and rare earths, !nt. J. Mater. Res. (formely Z. Met.) 107 (2016) 1041-1050, http://dx.doi.org/10.3139/146.111434.
[7] J. Lacaze, L. Magnusson-Âberg, J. Sertucha, Review of microstructural features of chunky graphite in ductile cast irons, in: Proceedings Keith Millis symposium, Nashville, AFS, 2013, pp. 360-368.
[8] W. Stets, H. Lôblich, G. Gassner, P. Schumacher, Solution strengthened ferritic ductile cast iron properties, production and application, !nt. J. MetalcasL 8 (2014) 35-40, http:/ /dx.doi.org/10.1007 /BF03355580.
[9] M. Castro, M. Herrera, M.M. Cisneros, G. Lesoult, J. Lacaze, Simulation of thermal analysis applied to the description of the solidification of hypereutectic SG irons, lot. J. Cast MeL Res. 11 (1999) 369-374, http://dx.doi.org/10.1080/13640461. 1999.11819301.
[10] D. M. Stefanescu, J. Lacaze, Thermodynamics principles as applied to cast iron, in: ASM Handbook, vol lA, Cast Iron Science and Technology, 2017, pp. 31-45 . [11] L.R. Feret, Assoc. Internat. Pour !'Essai des Mat., Zurich, 2 Group D, 1931. [12] Z. Ignaszak, Nodular graphite degeneration in the post-inoculated ductile iron, lot .
J. Cast MeL Res. 16 (2003) 93-97, http://dx.doi.org/10.1080/13640461.2003. 11819565.
[13] 1. Asenjo, P. Larrai\aga, J. Sertucha, R. Suarez, J.M. G6mez, 1. Ferrer, J. Lacaze,
Effect of mould inoculation on formation of chunky graphite in heavy section spheroidal graphite cast iron parts, !nt. J. Cast Met. Res. 20 (2007) 319-324, http:// dx.doi.org/10.1179 /l 36404608X286138.
[14] J. Lacaze, B. Sundman, An assessment of the Fe-C-Si system, Metall. Trans. A 22 (1991) 2211-2223, http://dx.doi.org/10.1007 /BF02664987.
[15] J. Lacaze, I. Asenjo, S. Méndez, J. Sertucha, P. Larrai\aga, R. Suarez, Experimental evidence for metallurgical modification associated to chunky graphite in heavy section ductile iron castings, !nt. J. Metalcast. (2012) 35-42, http:/ /dx.doi.org/10. 1007 /BF03355476.
[16] V. Gerval, J. Lacaze, Critical temperatures of spheroidal graphite cast irons: a re view of literature data, ISU !nt. 40 (2000) 386-392, http:/ /dx.doi.org/10.2355/ isijintemational.52.2036.
[17] O. Tsumura, Y. Ichinomiya, H. Narita, T. Miyamoto, T. Takenouchi, Effects of rare earth elements and antimony on morphology of spheroidal graphite in heavy walled ductile cast iron, !MONO 67 (1995) 540-545.
[18] P. Larrai\aga, I. Asenjo, J. Sertucha, R. Suarez, I. Ferrer, J. Lacaze, Effect of anti mony and cerium on the formation of chunky graphite during solidification of heavy-section castings of near-eutectic spheroidal graphite irons, Metall. Mater. Trans. A 40A (2009) 654-661, http://dx.doi.org/l0.1007/s11661-008-9731-y. [19] W. Stets, U. Petzschmann, R. Hentsch, A. Lôtschert, Entstehung und Vermeidung
von Chunkygraphit in Gusseisen mit Fugelgraphit, Giesserei 101 (2014) 36-47. [20] J. Sertucha, J. Lacaze, S. Armendariz, P. Larrai\aga, Statistical analysis of the in
fluence of some trace elements on chunky graphite formation in heavy section nodular iron castings, Metall. Mater. Trans. A 44A (2013) 1159-1162, http://dx. doi.org/10.1007 /s11661-012-1592-8.
[21] J. Sertucha, R. Suarez, I. Asenjo, P. Larrai\aga, J. Lacaze, I. Ferrer, S. Armendariz, Thermal analysis of the formation of chunky graphite during solidification of heavy section spheroidal graphite iron parts, ISU !nt. 49 (2009) 220-228, http://dx.doi. org/10.2355/isijintemational.49.220.
![Fig. 12. Correlation between the index Q5; and the amount of chunky graphite as given by ftn a for the present results and by A A for previous results [18,21]](https://thumb-eu.123doks.com/thumbv2/123doknet/2992028.83405/10.918.93.423.78.342/correlation-index-chunky-graphite-present-results-previous-results.webp)