Valorization of crude glycerol and eggshell biowaste as media components for hydrogen production: A scale-up study using co-culture system
Vinayak Laxman Pachapura, Ratul Kumar Dasa, Satinder Kaur Brara*, Yann Le Bihanb, Gerardo Buelnab
a
Institut national de la recherche scientifique, Centre - Eau Terre Environnement, 490, Rue de la Couronne, Québec(QC), Canada G1K 9A9
b
Centre de recherche industrielle du Québec (CRIQ), Québec(QC), Canada
*Correspondence
Satinder Kaur Brar, Professor
Telephone: + 418 654 3116; Fax: + 418 654 2600 E-mail: [email protected]
Abstract
The properties of eggshells (EGS) as neutralizing and immobilizing agent were investigated for hydrogen (H2) production using crude glycerol (CG) by co-culture system. Eggshells of different sizes and concentrations were used during batch and repeated-batch fermentation. For batch and repeated-batch fermentation, the maximum H2 production (36.53 ±0.53 and 41.16 ±0.95 mmol/L, respectively) was obtained with the EGS size of 33 μm<x5<75 μm. Hydrogen production increased with the decreasing size of EGS. Eggshells maintained the fermentation pH (6.00-6.30) and provided immobilization support as confirmed by scanning electron microscopy. As media components, the EGS concentration of 0.25% (w/v) was found to be optimum for maximum H2 production (31.66 ±0.55 mmol/L) and the production profile was comparable to H2 production (32.07 ±0.92 mmol/L) obtained with all media components. In scale-up study with semi-continuous bioreactor (7.5 L), almost 1.5-fold increase (in comparison to mono-culture) i.e. 312.12 mmol-H2/L-of medium with 86.65% glycerol utilization was obtained.
Keywords: crude glycerol; co-culture; eggshell; hydrogen; immobilization; neutralization.
Abbreviations: Crude glycerol (CG); Eggshells (EGS); Hydrogen (H2); Gas
Chromatography (GC); Scanning Electron Microscopy (SEM); Thermal Conductivity Detector (TCD); 1,3-propanediol (1,3-PD)
1. Introduction
Biofuel economy comprising biodiesel and biohydrogen are low-carbon and post-petroleum economies in the near future (Boboescu et al., 2016; Sarma et al., 2015b). Biodiesel industry growth in the last decade led to 100% increase in crude glycerol (CG) production globally (Valerio et al., 2015). Biodiesel industry generates large quantities of CG (by-product) at 1:10 during biodiesel production (Len & Luque, 2014). For sustainable growth in the near future, biodiesel industry needs to utilize CG for synthesis of bio-based fuels/chemicals to extend renewable resource utilization (Valerio et al., 2015). Glycerol being polyol with three hydroxyl group and with higher redox potential favors biological conversion into high value-added products such as, hydrogen, 1,3-propanediol, butanol, succinic acid and ethanol (Len & Luque, 2014).
The complexity of CG with the amount of impurities present and glycerin purification is no longer cost-effective and production of value-added products, such as 1,3-propanediol, succinic acid and ethanol require additional expensive recovery steps (Valerio et al., 2015). Bioconversion of CG to hydrogen (H2) is a widely explored approach in comparison to the production of other value-added products (Dounavis et al., 2015; Fountoulakis & Manios, 2009). H2 production can be carried out with renewable and sustainable technologies with combined waste treatment in comparison to chemical methods associated with consumption of fossil fuels (Sivagurunathan et al., 2016).
Dark fermentation can use diverse organic wastes, simple reactor set-up with higher H2 production rate in comparison to photo-fermentation (Sivagurunathan et al., 2016). During dark fermentation, production of organic acids causes a sharp decrease in the medium pH and results in lower H2 production (Zagrodnik & Laniecki, 2015). Thus, to maintain the
Tenca et al., 2011). During fermentation additional media components (Tenca et al., 2011), co-substrate utilization and immobilization techniques are necessary for increased H2 production (Sivagurunathan et al., 2016) accounting for higher production cost.
Dark fermentation of organic wastes for commercialization at large scale requires new routes for decreasing the cost of H2 production (Pachapur et al., 2015b). The recent trends of
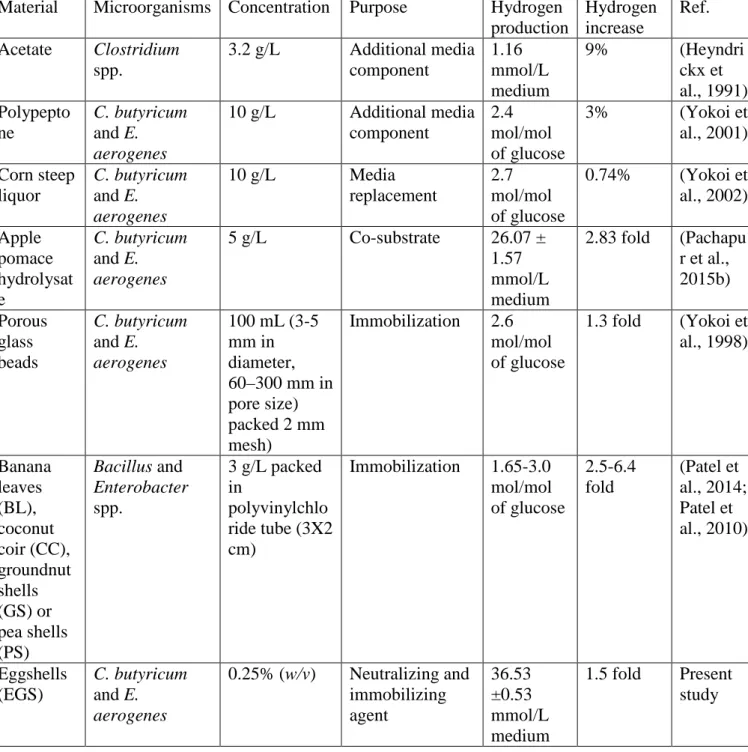
replacing the media components with organic wastes to enhance H2 production at lowered production cost are presented in Table 1. In the presence of additional acetate, Clostridium strains utilized twice the amount of glycerol with 9% increase in H2 production in comparison to without acetate (Heyndrickx et al., 1991). Repeated batch culture with polypeptone
resulted in increased H2 yield from 2 to 2.4 mol/mol of glucose (Yokoi et al., 2001). The expensive polypeptone was replaced with corn steep liquor; a nitrogen-rich organic waste resulted with increase in H2 yield from 2.4 to 2.7 mol/mol of glucose (Yokoi et al., 2002). Likewise, apple pomace hydrolysate was co-fermented with CG resulting in 2.83 fold increase in H2 production (Pachapur et al., 2015b). Fruit- vegetable waste (pH= 4.60 ±0.10) was mixed with swine manure (alkali-rich material; pH = 8.1 ±0.20) resulted in process stability and eliminated exogenous adjustment of pH for H2 production (Tenca et al., 2011). Over the years, the immobilization technique of using porous glass bead (Yokoi et al., 1998), have been replaced with dried ligno-cellulosic materials (such as coconut coir and banana leaves). Bacterial population was retained on these lignocellulosic matrices during continuous culture resulting in 6.4 fold improvement in H2 production (Patel et al., 2014; Patel et al., 2010). The replacement of costly media components, utilization of industrial wastes and use of low-cost immobilizing material resulted in increased substrate availability for effective and economical H2 production.
In 2015, Canada produced around 610 million dozen eggs and with the growth in the demand, the production is anticipated to increase 4% per year (www.eggfarmers.ca). Food
processing and manufacturing plants across worldwide generate EGS (10% of total mass) as solid waste and is commonly disposed in landfills without any pretreatment (Wei et al., 2009). Landfill treatment results in unpleasant odor, with microbial growth affecting nearby community and environment, thus requiring distant landfills at higher cost (Meng & Deng, 2016). Therefore, food processing industry is searching proper management options to transform EGS waste into high-value products (Meng & Deng, 2016). The composition of EGS with 94-97% of CaCO3 acted as a natural neutralizing agent in maintaining fermentation pH (Wei et al., 2009). In trash to treasure approach EGS was used as low-cost catalyst for biodiesel (Chen et al., 2014; Sharma et al., 2010; Wei et al., 2009), as neutralizing agent for fumaric acid production (Das et al., 2015), to regulate the pH inside the reactor for energy storage (Meng & Deng, 2016), and also as sustainable CaO sorbents for enhanced CO2 capture (Sacia et al., 2013).
The added cost of media components, external buffering agents and material cost for immobilization can be eliminated by using a cost-effective and environmental approach of recycling EGS during H2 production. As the literature suggests, utilization of EGS in the production of H2 is yet to be explored. In future, H2 demand is expected to increase while growing need of utilization of CG will be necessary to make biodiesel competitive with petroleum diesel (Kumar et al., 2015; Wei et al., 2009). Therefore, sustainable development of solid waste recycling by using CG and EGS as media replacement will decrease the media cost of H2 production. In this study, along with CG as substrate, the property of EGS as neutralizing agent and also as low-cost immobilizing support was explored for the first time for H2 production.
2. Materials and Methods
The CG used in this study was supplied by Rothsay, Canada who recycle food and animal by-products for biodiesel production. The composition of CG (by w/w) is given as follows: glycerol (23.6%), carbon (35.9%), nitrogen (3.2%), ash (3.06%), moisture (5.75%) and matter organic non-glycerol (67.56%). Chemicals and reagents used in this study were purchased from Fisher Scientific, VWR and Lallemand, Canada (Pachapur et al., 2016b).
2.2. Microorganisms, pre-culture media and inoculum development
The co-culture system of Enterobacter aerogenes NRRL B-407 and Clostridium butyricum NRRL B-41122 considered in this study was purchased from USDA, USA. The basal synthetic medium consisting (w/v) of glucose (1%), casein polypeptone (2.0%), KH2PO4 (0.2%), yeast extract (0.05%) and MgSO4.7H2O (0.05%) maintained anaerobically at pH 6.5 was used for E. aerogenes pre-cultured at 30 ºC. The modified basal medium supplemented with 0.1% L-cysteine-HCl.H2O was used for C. butyricum preculture at 36 ºC (Yokoi et al., 1998). The exact amounts of media components were dissolved in distilled water using magnetic stirrer. The pH of pre-culture media was set to 6.5 using NaOH, degassing by pure N2 gas for 3 min and bottles sealed using pre-inserted septa followed by autoclave (Pachapur et al., 2016c).
For inoculum development, log phase culture broth at 5% (v/v) was used as inoculum throughout the study and cultures were incubated at 36 ºC at 150 rpm in an orbital incubator shaker (INFORS-HT multitron standard) (Pachapur et al., 2016c).
2.3. Hydrogen production using different sized EGS
To study the effect of variation in size of EGS on H2 production, the EGS were first oven dried and then broken into small sizes using a mortar and pestle. The small pieces of EGS were later sieved through metal sifters and EGS of varying sizes from 1.7 mm<x1<3.35 mm, 850 μm<x2<1.7 mm, 300 μm<x3<850 μm, 75 μm<x4<300 μm and 33 μm<x5<75 μm, were
obtained. The EGS of varying sizes was collected separately and stored at 4 ºC before use. Modified basal media containing (w/v): CG (1.75%), casein peptone (2%), yeast extract (0.05%), KH2PO4 (0.2%), MgSO4.7H2O (0.05%) was mixed with EGS (0.25% w/v). All the media components were mixed in distilled water, initial pH was adjusted to 6.5 by NaOH (0.1 M) and final volume of 47.5 mL was transferred to 125 mL serum bottles. The pure N2
sparging, sealing, autoclave and incubation steps are similar to the inoculum development step as explained earlier. CG at 1.75% (w/v) was optimum from authors earlier studies for H2 production (Pachapur et al., 2016c) and EGS at 0.25% (w/v) was used to replace 0.2% (w/v) KH2PO4 and 0.05% (w/v) MgSO4.7H2O. The experimental runs were performed in triplicates and the presented values are the averages of triplicates with standard deviation (±) values as error bars.
2.4. Repeated batch culture for H2 production using different sized EGS
After the completion of batch culture of H2 production using different sized EGS. around 47.5 mL of spent media was drawn out using a syringe filter (0.45 µm) fitted to a peristaltic pump (Yokoi et al., 2002). The filter helped to retain the EGS inside the serum bottle and drawing out only spent media. Later, 47.5 mL of fresh autoclaved medium was added into the same serum bottles containing the different sized left-over EGS. The fresh media along with left-over EGS was degassed using pure N2 to zero down H2 concentration before performing repeated batch culture (Yokoi et al., 2002). The exchange of media in serum bottle was performed easily using peristaltic pump or can be carried out in anaerobic chamber to avoid any air contamination. The spent media of 2.5 mL was used as inoculum for the fresh medium during repeated batch culture fermentation. The steps to draw out spent media, addition of fresh media and creation of anaerobic environment using pure N2 passed through filter (0.45 µm) was carried out in a laminar air flow chamber under sterilized conditions.
2.5. EGS as immobilization support
The immobilizing property of EGS provides necessary compatibility for attachment,
adsorption and growth of microorganisms (Das et al., 2015). To determine the immobilizing potential of EGS in the co-culture system during H2 production, the EGS were collected from the spent media at the end of the fermentation. The EGS collected in eppendorf tubes (1.5 mL) was washed 3 times in phosphate-buffered saline (PBS: 8.475 g NaCl, 1.093 g Na2HPO4, and 0.276 g NaH2PO4 in 1 L distilled water) and later fixed using 4%
paraformaldehyde for 10 min. Soon after fixation, the cells were washed 3 times using PBS and later re-suspended in ultrapure water. Later, 100 µL of bacterial solution was transferred onto glass plate, air-dried and later analysed for SEM analysis. The fixation, washing, dehydrate and drying step was carried out inside the laminar and the air-dried glass slides were stored at 4 ºC (Chao & Zhang, 2011) and analyzed by a scanning electron microscope (Das et al., 2015).
2.6. Hydrogen production at different concentrations of EGS
To determine the exact concentration of EGS of size x5 (33 μm<x5<75 μm) for increased H2 production, the amount of EGS was varied from 0.5, 1, 2 and 4% (w/v). In the presence of modified basal media at 1.75% (w/v) CG with yeast extract, peptone and at increasing concentration of EGS of size x5 from 0.5 to 4% was carried out in triplicates.
2.7. Effect of EGS in presence and absence of media components during H2 production
To study the effect of EGS during H2 production with modified basal media consisting of (w/v): CG (1.75%), EGS of size x5 (0.25%) and in presence and absence of casein peptone (2%), yeast extract (0.05%), KH2PO4 (0.2%), MgSO4.7H2O (0.05%) was carried out. The fermentation media in presence and absence of each component was carried out as explained
above in inoculum development step. A control experiment for synthetic CaCO3 at exact concentration of EGS was carried out for comparative study. In addition, validation experiments in presence and absence of CG were also carried out in triplicates.
2.8. Semi-continuous H2 production using 7.5 L bioreactor
The co-culture system of H2 production using EGS in the absence of media components in a 7.5 L bioreactor (Labfors, IINFORS-HT, Switzerland) was carried out. The semi-continuous approach eliminated substrate inhibition and successfully developed a low-cost
bio-engineering system for H2 production (Sarma et al., 2015a). The initial CG concentration in the bioreactor was 10 g/L with working volume of 3 L. After 8 hours of fermentation, CG concentration at 120 g/L was added drop wise to the reactor and equal amount of fermented medium was drawn through various openings by a peristaltic pump. CG above 20 g/L resulted in substrate inhibition with decrease in H2 production (Pachapur et al., 2016c), thus the target concentration inside the reactor was within 17.5-20 g/L of CG. The drop wise feeding and drawing of fermented medium was maintained at constant speed using peristaltic pump, so that the medium volume of the bioreactor was constant throughout the
fermentation. The real time values of different parameters, such as (pH, rpm, dissolved oxygen, temperature and hydrogen) were monitored and recorded using Iris software (Labfors, IINFORS-HT, Switzerland) operated over a system. To account for hydrogen partial pressure, once the H2 concentration reached 30-35% (v/v) in the headspace of the reactor, pure N2 was sparged. The operating conditions (pH: 6.5, temperature: 36 ºC and rpm: 100) were kept constant during fermentation as described in (Sarma et al., 2015a).
2.9. Analytical Techniques
At the end of each fermentation experiment, the gas samples were collected in vacuumed sample vials using gas tight syringe and later were analyzed by gas chromatography (GC). The technical specifications of the GC instrument were: Model: Varian 3800, USA, fitted with a 3 m PoraPLOT Q® column (Agilent technology, USA) and equipped with a thermal conductivity detector (TCD). The GC set-up with injector, column temperature and detector temperature were set at 100 ºC and carrier gas N2 was used at a flow rate of 3.5 mL/min. Considering the temperature and atmospheric pressure during the experimental runs, the volume of H2 gas produced was calculated and expressed in mmol concentration unit (Pachapur et al., 2015b).
2.9.2. End-Metabolites/by-products analysis by GC-FID
The concentrations of ethanol, butyric acid, acetic acid and 1,3-propanediol (1,3-PD) was analyzed on ZB-WAX plus column fitted with flame ionization detector (FID) detector in a gas chromatography (GC) (7890B GC-Agilent, Santa Clara, CA) set-up. The GC conditions at a flow rate of 1 mL/min using helium carrier gas at a temperature profile of 80 ̶ 240 ºC under 8.4 min method run time was developed (Pachapur et al., 2015b).
2.9.3. Bacterial morphology analysis by Scanning Electron Microscopy (SEM)
The EGS at the end of the repeated batch fermentation were recovered and washed twice in potassium phosphate buffer (50 mM, pH 6.5). The bacterial cells were fixed, washed and dehydrated according to the sample preparation steps mentioned earlier (Chao & Zhang, 2011) and later the fixed cells were analyzed by SEM, Carl Zeiss EVO® 50 (Das et al., 2015).
3. Results and discussion
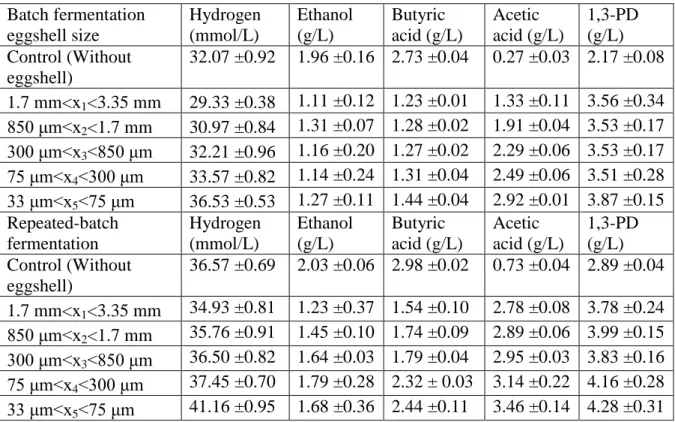
To determine the role of EGS during hydrogen production using CG (1.75% w/v) in presence of modified basal medium, the co-culture studies was carried out in presence of different sizes of EGS. At the end of batch fermentation, the H2 production and end-metabolite production obtained with the different sizes of EGS are presented in Table 2. The highest H2 production (36.53 ±0.53 mmol/L) was obtained for the size x5 and the lower production (29.33 ±0.38 mmol/L) resulted with x1 size. The control set in the absence of EGS produced 32.07 ±0.92 mmol/L of H2. The pH of the spent media at the end of fermentation using EGS was within 6.00 to 6.30 in comparison to ~5.5 in absence of EGS. During fermentation, with the accumulation of different organic acids (acetate and butyrate) along with solvents
(ethanol), the fermentation pH decreased to around ~5.5 from 6.5 causing pathway shift with lower H2 production. Addition of EGS helped to maintain the optimum pH (6.5) required for the growth of E. aerogenes and C. butyricum. The H2 concentration (36.53 ±0.53 mmol/L) obtained with EGS was higher in comparison to 32.1 ±0.92 mmol/L without EGS. In case of size x5, acetic acid was produced at higher concentration (2.92 ±0.01 g/L) which resulted in increased H2 production in comparison to other applied sizes of EGS. The CaCO3 (Hydrogen Bond Acceptor Count=3) present in the EGS acted as indirect H-acceptor and gradually diverting the fermentation from 1,3-PD towards acetate and H2 formation. Similar results were observed during addition of sodium acetate (Hydrogen Bond Acceptor Count=2) as co-substrate acted as indirect H-acceptor favored acetyl CoA/CoA ratio towards acetate with increased H2 production (Heyndrickx et al., 1991). The increased production of acetate can also be due to the decalcification reaction accounted during conversion of calcium carbonate present in EGS into calcium acetate (Nakano et al., 2001). The H2 production increased with increased production of acetic acid, as 3 moles of H2 are released from 1 mole of acetate (Dounavis et al., 2015). The decreased size of EGS resulted in the increased production of H2. The larger size in case of x1 to x4, tend to settle down to form heaps at the bottom of the
serum bottle during the fermentation. However, in case of size x5, there was no settling down of EGS resulting in constant contact with media for sufficient mixing resulting in increased H2 production. The increased size of EGS accentuated the mixing problem with the formation of dead zones resulting insufficient mixing leading to local accumulation of EGS heaps. The dead zone across the fermentation with limited media exposure tends to decrease the
fermentation performance resulting in decreased H2 production. Homogenous mixing with no dead zone formation directly influences the uniform distribution of media components, keeps the microorganisms in suspension to increase the performance of bioreactor (Schäpper et al., 2009).
The EGS addition maintained the media pH within 6.00 to 6.30 in comparison to ~5.5 in the absence of EGS, resulting in enhanced H2 production with decreased size of EGS. In order to determine the reusability of EGS, repeated batch fermentation was carried out.
3.2. Repeated Batch culture of H2 production in presence of different sizes of EGS
In addition to maintaining the pH of the fermentation, EGS also act as immobilizing agent. Hydrogen production at the end of batch fermentation was later supplemented with fresh degassed media and repeated batch fermentation was carried out. The repeated batch cycle determined the ability to reuse EGS and immobilizing property of EGS during H2 production. The H2 and end-metabolites production obtained in the repeated batch fermentation in
presence of different varying sizes of EGS are presented in Table 2. The H2 and metabolite production profile in case of repeated batch was similar to batch fermentation. The highest H2 production was around 41.16 ±0.95 mmol/L for size x5 and the lowest production of 34.93 ±0.81 mmol/L for size x1. The control set in the absence of EGS produced 36.57 ±0.69 mmol/L of H2. For repeated fermentation (1st cycle), the spent media as inoculum attributed to increased cell proliferation and higher adaptation to the CG resulting in enhanced H2
production. The spent media at 5-10% (v/v) inoculum size in case of E. aerogenes resulted in 13.37% increased H2 production (Sarma et al., 2013). The repeated fermentation (2nd cycle) resulted in lower H2and higher production of end-metabolites as compared to the results of batch fermentation (data not shown). The lower production of H2 in the 2nd cycle of fermentation was caused by substrate inhibition and favored the production of
end-metabolite, 1,3-PD. In such a case, withdrawing the fermented medium from the reactor and replacing it with fresh medium will decrease the inhibition with increased H2 production. The reuse property of EGS was determined with increased H2 production across repeated
fermentation and immobilizing property of EGS was analysed by SEM.
3.3. EGS as immobilization support
Immobilization of microbes to a limited extent has been applied to fermentation for
improving H2 production. Immobilization on natural or synthetic matrices has been common and effective approach for enhancing H2 yield. Bacterial cells were adsorbed on the porous glass beads and improved H2 yield from 2 to 2.6 mol/mol of glucose and also helped to decrease retention time from 5 to 0.75 h (Yokoi et al., 1998). However, synthetic support materials are costly and possible replacement by using renewable wastes of biological origin will be more suitable and cost-effective (Das et al., 2015; Patel et al., 2010). Lignocellulosic wastes (coconut coir and banana leaves) as immobilization material were used as effective supports for bacterial growth, which resulted in improved biomass retention in reactor, increased process stability with increased H2 production in comparison to free-cells (Patel et al., 2010). EGS as immobilizing agent displayed higher stability and affinity towards fungus and enzymes (Das et al., 2015). However, EGS application as immobilizing support for H2 production was carried out for the first time in this study, to the best of our knowledge. EGS as bacterial support delivered 36.53 ±0.53 mmol of H2 in comparison to 29.33 ±0.38 using free-cells. In case of immobilized cells, the glycerol utilization was higher ~ 98-99% in
comparison to ~85% obtained for free-cells (data not shown). The increased H2 production using immobilized cells in comparison to free-cells suggested EGS as strong immobilization support for bacterial growth and it was also confirmed from the SEM micrographs. The EGS possesses the property of immobilization compatibility for attachment, adsorption and proliferation of microorganisms. The mono-culture and co-culture (bacterial cells + EGS) was processed through many preparative steps before SEM analysis and it did not cause detachment of the bacterial cells from EGS. The bacterial colonies were confluent on EGS, although, authors are not sure about the exact mechanism of immobilization of bacterial strains on EGS surfaces. Presence of many functional groups (such as ß–galactosidase, amines and amides) in the EGS membrane might have helped in the immobilization steps (Das et al., 2015). SEM micrograph of mono-culture and co-culture system in absence and presence of EGS are represented in the Fig. S1 (as supplementary data). The rod-shaped morphology of E. aerogenes and C. butyricum can be seen in the mono-culture system in the Fig. S1(a and b). The co-culture system of E. aerogenes and C. butyricum in the absence of EGS can be seen in Fig. S1(c). The growth/presence of both the microorganisms during H2 production in the co-culture system can be seen Fig. S1(c). The blunt end of C. butyricum can be easily differentiated from round ended E. aerogenes in the co-culture. The co-culture system was studied in the presence of EGS and bacterial immobilization on the surfaces of EGS can be seen in the Fig. S1(d). The increase in immobilized bacterial biomass suggested the role of EGS as immobilizing surface during co-culture.
The advantages of co-culture over mono-culture were justified with increased H2 production (Pachapur et al., 2016b; Pachapur et al., 2015a), increased co-substrate utilization (Pachapur et al., 2015b), increased glycerol uptake and decreased by-product production (Pachapur et al., 2016c). However, for the first time, the simultaneous growth of E. aerogenes and C. butyricum in the co-culture system was justified at cellular level using SEM in this study. In
the present study, SEM analysis was performed for qualitative assessment of the
immobilization property of EGS. A detailed characterization of the co-cultured bacterial strains in terms of quantification will be a different approach.
3.4. Hydrogen production in presence of increasing concentration of EGS
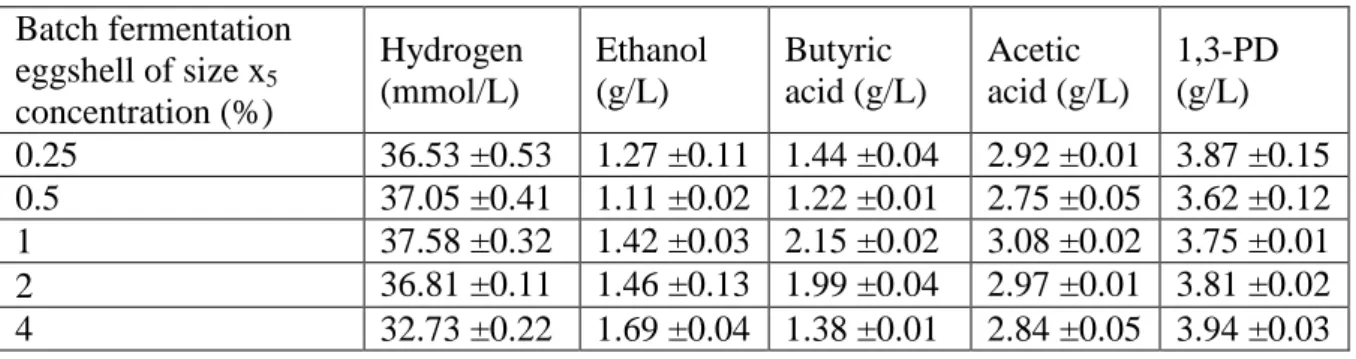
In comparison to the other four applied size ranges (x1, x2, x3, and x4) of EGS, the size range x5 resulted in the highest H2 production in both batch and repeated fermentation conditions. To determine the optimum concentration for maximum H2 production, different concentrations (0.5 to 4%, w/v) x5 of EGS was used. The production profiles of H2 and end-metabolite obtained with different concentrations (%) of x5 are presented in Table 3. The highest H2 production was around 37.58 ±0.32 mmol/L in case of 1% (w/v) of EGS and minimum was around 32.73 ±0.22 mmol/L for 4% of EGS of size x5. The H2 production in case of
increasing concentration of EGS followed both oxidative with production of acetate, butyrate, ethanol along with reductive pathway with production of 1,3-PD as seen from the Table 3. The increase in the production of H2 37.58 ±0.32 mol/L while using 1% (w/v) EGS was marginal in comparison to 36.53 ±0.53 mmol/L using 0.25% (w/v) of EGS as seen in Table 2. The marginal increase of 3% will require additional 0.75% of EGS. However, at large-scale production to minimize the load on the fermentation, 0.25% (w/v) of EGS can be considered to be optimum. The optimum condition of 0.25% (w/v) of EGS matched the total (w/v) of KH2PO4 (0.2%) and MgSO4.7H2O (0.05%) used in the basal media for the inoculum growth.
Increase in the concentration of EGS resulted in the marginal increase in the H2 production and 0.25% (w/v) of EGS of size x5 was the optimum condition. The optimum condition of EGS of size x5 was fixed and used in the later studies.
3.5. Hydrogen production with and without media components
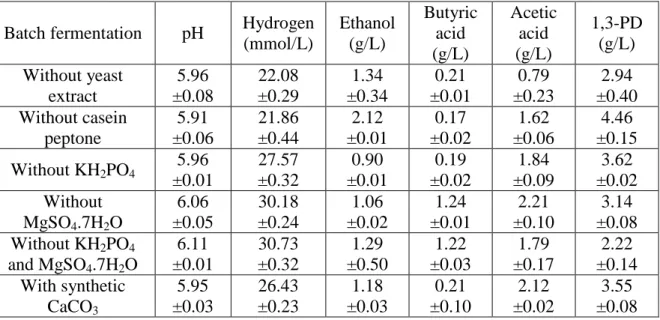
The purpose of EGS as neutralizing and immobilizing agent was successfully tested in previous sections. Further we also evaluated the EGS as possible replacement for costly media components, such as casein peptone and yeast extract. The optimum condition of modified basal media CG (1.75%), and in presence and absence of casein peptone (2%), yeast extract (0.05%), KH2PO4 (0.2%), MgSO4.7H2O (0.05%) was studied at EGS size of x5 with 0.25% w/v concentration. The experimental sets, along with H2 and end-metabolite production with and without media components are presented in Table 4. The decrease in pH towards weakly alkaline range favors methanogenesis, homoacetogensis and direct
consumption of produced H2, requiring addition of external buffering agents (Tenca et al., 2011). The highest H2 production was around 30.73 ±0.32 mmol/L in case of media composition without KH2PO4 and MgSO4.7H2O and minimum was around 21.86 ±0.44 mmol/L for media composition without yeast extract. The EGS has been already used as neutralizing agent during the fumaric acid production as replacement of synthetic CaCO3 (Das et al., 2015). KH2PO4 regulates the pH during fermentation,(Liu & Fang, 2007) and MgSO4.7H2O addition as trace metal supplement is necessary for biomass generation during H2 production (Alshiyab et al., 2008). The composition of EGS with CaCO3 (94%),
magnesium carbonate (1%), calcium phosphate (1%) acts as a natural neutralizing agent for the microorganisms (Wei et al., 2009). The presence of EGS along with KH2PO4 or
MgSO4.7H2O resulted in un-optimized condition with decreased H2 production. The presence of EGS along with KH2PO4 or MgSO4.7H2O resulted in increased concentration of
neutralizing agent to inhibit H2 production. However, in presence of only EGS and by removal of both KH2PO4 and MgSO4.7H2O resulted in optimum condition with increased H2 production. EGS support resulted in higher production (30.73 ±0.32 mmol/L) in comparison to synthetic CaCO3 with only 26.43 ±0.23 mmol/L H2 production. In the absence of nitrogen
source, such as yeast extract and peptone, the co-culture system was able to produce around 22.08 ±0.29 mmol/L of H2. The presence of organic matter (4%) (Wei et al., 2009), in the EGS along with 3% nitrogen content in CG supplemented the nitrogen source during H2 production.
The EGS can help maintain the fermentation pH, act as immobilizing agent along with possible replacement of costly media components and further for H2 production from CG.
3.6. Hydrogen production in comparative studies
In the presence and absence of media components while using the EGS, the co-culture system was able to produce the increased H2 production. In order to determine the role of EGS in complete absence of media components, comparative studies were carried out. The
conditions used across the studies included (w/v) CG at 1.75%, EGS sixe x5 (0.25%) along with media components (casein peptone (2%), yeast extract (0.05%), KH2PO4 (0.2%),
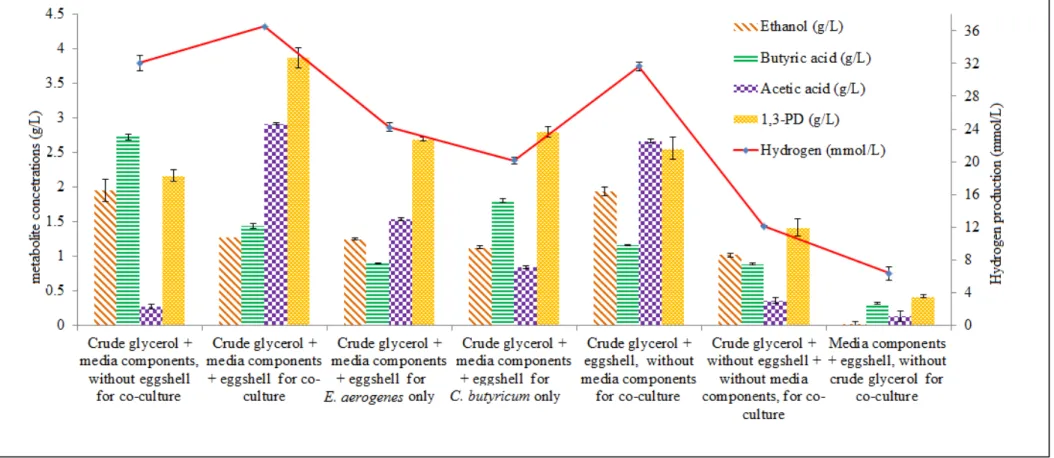
MgSO4.7H2O (0.05%)). The experimental plan along with H2 and end-metabolites production across the comparative studies is presented in the Fig.1. In the absence of EGS using 1.75% (w/v) of CG, the co-culture system was able to produce around 32.07 ±0.92 mmol/L of H2. In this case, the fermentation followed the reductive pathway with butyric acid production (2.73 ±0.04 g/L) and traces of acetic acid (0.27 ±0.03 g/L). Butyric acid theoretical yield from CG is only 2 mole of H2 in comparison to acetic acid production with 3 mole of H2. For EGS, the co-culture system was able to produce higher H2 at around 36.53 ±0.53 mmol/L following the reductive pathway with production of acetic acid (2.92 ±0.01 g/L) along with butyric acid (1.44 ±0.04 g/L). In presence of EGS, the glycerol fermentation favored the acetic acid production along with increased H2 production (as explained in section 3.1). The same condition was studied for the mono-culture system. In case of E. aerogenes, the H2
amount of 1,3-PD production (2.70 ±0.03 g/L). For C. butyricum, only H2 production was around (20.14 ±0.38 mmol/L) with butyric acid (1.81 ±0.03 g/L) and 1,3-PD production (2.80 ±0.08 g/L). The concentration of CG at 1.75% w/v acts as substrate inhibitor during mono-culture studies resulting in increased production of 1,3-PD for both E. aerogenes and C. butyricum. The co-culture system in the presence of CG with EGS and in the absence of media components resulted in 31.66 ±0.55 mmol/L of H2 along with acetic acid (2.67 ±0.03 g/L) and butyric acid (1.16 ±0.01 g/L) production.
The H2 concentration (31.66 ±0.55 mmol/L) obtained without media component was
comparable to without EGS (32.07 ±0.92 mmol/L). In the absence of media components, the limiting conditions, such as neutralizing property and nutrient/organic source were
supplemented by EGS and CG for H2 production. The media components might have masked the available nutrients from both CG and EGS, which resulted in marginal H2 production (32.07 ±0.92 mmol/L). However, with EGS as replacement of media components, the co-culture system was able to produce sufficient H2 (31.66 ±0.55 mmol/L). The absence of CG in presence of EGS and media components resulted in 6.35 ±0.05 mol/L of H2. Presence of only CG and absence of both EGS and media components lowered the pH from 6.5 to 4.2 resulting in decreased H2 production 12.12 ±0.85 mol/L.
The comparative studies at optimized conditions validated the replacement of media components by EGS during H2 production in presence of CG by co-culture system.
3.7. Semi-continuous H2 production using 7.5 L bioreactor
The maximum benefit in terms of substrate inhibition, product inhibition, maintaining pH during generation of metabolites and elimination of media components was achieved with semi-continuous low-cost approach of H2 production (Sarma et al., 2015a). The study was carried out using mono-culture (E. aerogenes) in presence of only CG along with distilled
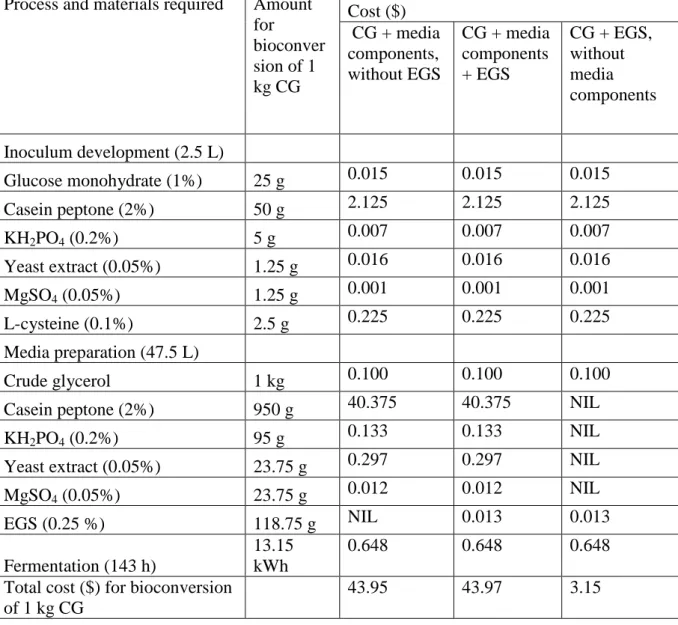
water without media components. The approach was modified with addition of 0.25% (w/v) EGS and carried out using co-culture system (E. aerogenes and C. butyricum). The purpose was to scale-up the results obtained with 125 mL to 7.5 L bioreactor. During the comparative study, the co-culture system produced higher H2 in comparison to mono-culture system. Table 5, presents cost analysis for semi-continuous process considered for each of the comparative studies. The source of media components and their costs at the bulk industrial purchase were referred from www.alibaba.com. Casein peptone was determinant factor in media cost calculation across the comparative studies. Alternative co-substrates, such as corn steep liquor, buffalo slurry and apple pomace hydrolysate have replaced media components and slashed the production cost of H2. In the present study, the total cost for bioconversion of 1 kg of CG by co-culture system using only EGS was estimated to be around $3.15 and this was considerably lower in comparison to $43.95 with all media components.
Semi-continuous approach without synthetic media components can reduce 82% of total cost of H2 production (Sarma et al., 2015a).
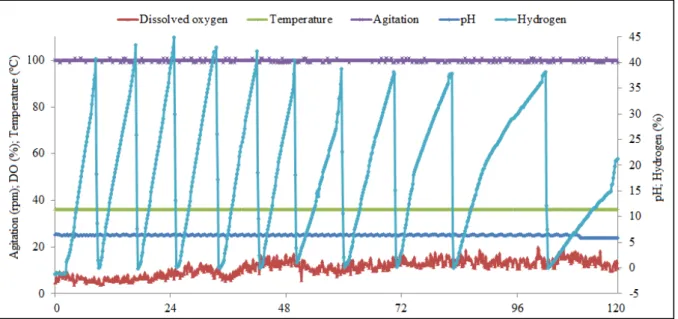
In context of the above results, co-culture system without media components with 0.25% (w/v) EGS using semi-continuous approach of H2 production was carried out. The online monitored data of the parameters (pH, temperature, agitation and hydrogen) during semi-continuous fermentation (7.5 L) using co-culture system for H2 production are represented in the Fig. 2.
Using E. aerogenes with semi-continuous approach produced around 210 mmol or 5.18 L H2/ L of medium with 65% glycerol utilization (Sarma et al., 2015a). In this study, co-culture system using 0.25% (w/v) EGS increased 1.5-fold with 312.12 mmol H2/L of medium at average production rate of 0.89 L H2/L of medium/day with 86.65% glycerol utilization. The co-culture system in absence of EGS resulted in only 1.15-fold increase (data not shown). The results obtained across the serum bottle study with and without EGS
(36.53/32.07=1.14-fold) matched the results obtained using bioreactor (312.12/241.92=1.29-(36.53/32.07=1.14-fold). Different types of bioreactors with varying volumes, with batch, fed-batch and continuous and stirred reactors have been used for H2 production (Vatsala et al., 2008). The semi-continuous bioreactor works with CG diluted only with distilled water along with EGS to reduce substrate inhibition, increase glycerol utilization and decrease media cost. Based on the results, parallel treatment of CG along with EGS can be achieved with sustainable H2 production using semi-continuous bioreactor.
Every year, around ±5700 tons of CG is produced across Quebec region (Pachapur et al., 2016a). With the optimized condition from this study, around 814 tons of EGS are required at ratio of 1:7. Food processing industry spends about $12 per hour to dry one ton on EGS before landfilling or composting with increasing problems of disposal cost, distant landfills with excess field capacity. EU has already banned landfill disposal or composting of EGS waste with moisture content of over 4% ( www.processingmagazine.com/how-to-turn-eggshell-waste-into-income/). However, with the proposed valorization approach of using EGS will save around $ 100,000/year for small and medium sized food processing industry (www.processingmagazine.com/how-to-turn-eggshell-waste-into-income/). In addition, the biodiesel industry will generate revenues from the waste CG with efficient H2 production as a viable alternative energy source.
The method of using the EGS for H2 production from CG by co-culture system is a novel approach. The ability of EGS to neutralize and maintain the pH during the H2 production can replace the cost of the neutralizing agent, which in turn will be a huge boost to the H2
production research. Further using EGS as immobilizing agent will replace the complex steps of immobilization technique as it can be done during fermentation. The addition of EGS as a low cost replacement of cost intensive media component will uplift the H2 production industry. In terms of cost calculation, with elimination of glucose, casein polypeptone,
KH2PO4, yeast extract and MgSO4.7H2O across the media with only utilization of crude glycerol and EGS, the media cost will reduce to 85-95% during H2 production (as seen from table 5). The media chemical cost can be reduced by using EGS, which in turn will benefit the H2 production industry. Even after the end of fermentation, the spent media along with EGS can be used as phosphate solubilizing biofertilizer (Sarma et al., 2015b). The role of EGS during H2 production is limitless ranging from fermentation pH neutralizing agent, immobilizing agent, media supplement and nutrient source with added advantage as biofertilizer.
4. Conclusion
EGS property as neutralizing agent and immobilization support for growth of co-culture was exploited during hydrogen production using crude glycerol. The maximum hydrogen
production resulted with EGS size of x5 at 0.25% (w/v) during batch and repeated-batch fermentation (36.53 ±0.53 and 41.16 ±0.95 mmol/L respectively). EGS played the role of neutralizing agent by maintaining the pH within 6.00 to 6.30, exhibited role of immobilizing agent and reusability during repeated-batch fermentation. EGS also reduced the media cost by 85-90% and using semi-continuous approach can produce 312.12 mmol-H2/L of medium with 86.65% glycerol utilization.
Acknowledgments
Financial support from NSERC (No. 284111, Discovery; No. 476649-14, Collaborative Research and Development Grant) and INRS-ETE has been acknowledged.
References
1. Alshiyab, H., Kalil, M.S., Hamid, A.A., Yusoff, W.M.W. 2008. Trace metal effect on hydrogen production using C. acetobutylicum. OnLine J. Biol. Sci. 8(1), 1–9.
2. Boboescu, I.Z., Gherman, V.D., Lakatos, G., Pap, B., Bíró, T., Maróti, G. 2016. Surpassing the current limitations of biohydrogen production systems: The case for a novel hybrid approach. Bioresour. Technol. 204, 192–201.
3. Chao, Y., Zhang, T. 2011. Optimization of fixation methods for observation of bacterial cell morphology and surface ultrastructures by atomic force microscopy. Appl. Microbiol. Biotechnol. 92(2), 381-392.
4. Chen, G., Shan, R., Shi, J., Yan, B. 2014. Ultrasonic-assisted production of biodiesel from transesterification of palm oil over ostrich eggshell-derived CaO catalysts. Bioresour. Technol. 171, 428–432.
5. Das, R.K., Brar, S.K., Verma, M. 2015. Valorization of Egg shell biowaste and brewery wastewater for the enhanced production of fumaric acid. Waste Biomass Valorization 6(4), 535–546.
6. Dounavis, A.S., Ntaikou, I., Lyberatos, G. 2015. Production of biohydrogen from crude glycerol in an upflow column bioreactor. Bioresour. Technol. 198, 701–708.
7. Fountoulakis, M., Manios, T. 2009. Enhanced methane and hydrogen production from municipal solid waste and agro-industrial by-products co-digested with crude glycerol. Bioresour. Technol. 100(12), 3043–3047.
8. Heyndrickx, M., De Vos, P., Vancanneyt, M., De Ley, J. 1991. The fermentation of glycerol by Clostridium butyricum LMG 1212t2 and 1213t1 and C. pasteurianum LMG 3285. Appl. Microbiol. Biotechnol. 34(5), 637–642.
9. Kumar, G., Bakonyi, P., Periyasamy, S., Kim, S., Nemestóthy, N., Bélafi-Bakó, K. 2015. Lignocellulose biohydrogen: practical challenges and recent progress. Renewable
Sustainable Energy Rev. 44, 728–737.
10. Len, C., Luque, R. 2014. Continuous flow transformations of glycerol to valuable products: an overview. Sust Chem Processes 2(1). DOI: 10.1186/2043-7129-2-1 11. Liu, F., Fang, B. 2007. Optimization of bio‐hydrogen production from biodiesel wastes
by Klebsiella pneumoniae. Biotechnol. J. 2(3), 374–380.
12. Meng, X., Deng, D. 2016. Trash to treasure: Waste eggshells used as reactor and template for synthesis of Co9S8 nanorod arrays on carbon fibers for energy storage. Chem. Mater. 28 (11), 3897–3904.
13. Nakano, T., Ikawa, N., Ozimek, L. 2001. Extraction of glycosaminoglycans from chicken eggshell. Poultr. Sci. 80(5), 681–684.
14. Pachapur, V.L., Sarma, S.J., Brar, S.K., Bihan, Y.L., Buelna, G., Verma, M. 2016a. Energy balance of hydrogen production from wastes of biodiesel production. Biofuels 1-10.DOI:10.1080/17597269.2016.1153361.
15. Pachapur, V.L., Sarma, S.J., Brar, S.K., Bihan, Y.L., Buelna, G., Verma, M. 2016b. Hydrogen production from biodiesel industry waste by using a co-culture of Enterobacter aerogenes and Clostridium butyricum. Biofuels 1–19.
DOI:10.1080/17597269.2015.1122471
16. Pachapur, V.L., Sarma, S.J., Brar, S.K., Le Bihan, Y., Buelna, G., Soccol, C.R. 2015a. Evidence of metabolic shift on hydrogen, ethanol and 1,3-propanediol production from crude glycerol by nitrogen sparging under micro-aerobic conditions using co-culture of Enterobacter aerogenes and Clostridium butyricum. Int. J. Hydrogen Energy 40(28), 8669–8676.
17. Pachapur, V.L., Sarma, S.J., Brar, S.K., Le Bihan, Y., Buelna, G., Verma, M. 2015b. Biohydrogen production by co-fermentation of crude glycerol and apple pomace hydrolysate using co-culture of Enterobacter aerogenes and Clostridium butyricum. Bioresour. Technol. 193, 297–306.
18. Pachapur, V.L., Sarma, S.J., Brar, S.K., Le Bihan, Y., Buelna, G., Verma, M. 2016c. Surfactant mediated enhanced glycerol uptake and hydrogen production from biodiesel waste using co-culture of Enterobacter aerogenes and Clostridium butyricum. Renewable Energy 193, 297–306.
19. Patel, S.K., Kumar, P., Mehariya, S., Purohit, H.J., Lee, J.-K., Kalia, V.C. 2014.
Enhancement in hydrogen production by co-cultures of Bacillus and Enterobacter. Int. J. Hydrogen Energy 39(27), 14663–14668.
20. Patel, S.K., Purohit, H.J., Kalia, V.C. 2010. Dark fermentative hydrogen production by defined mixed microbial cultures immobilized on ligno-cellulosic waste materials. Int. J. Hydrogen Energy 35(19), 10674–10681.
21. Sacia, E.R., Ramkumar, S., Phalak, N., Fan, L.-S. 2013. Synthesis and regeneration of sustainable CaO sorbents from chicken eggshells for enhanced carbon dioxide capture. ACS Sustainable Chem. Eng. 1(8), 903–909.
22. Sarma, S.J., Brar, S.K., Le Bihan, Y., Buelna, G., Soccol, C.R. 2013. Hydrogen production from meat processing and restaurant waste derived crude glycerol by
anaerobic fermentation and utilization of the spent broth. J. Chem. Technol. Biotechnol. 88(12), 2264–2271.
23. Sarma, S.J., Maiti, S., Brar, S.K., Le Bihan, Y., Buelna, G., Verma, M. 2015a. Low cost semi-continuous bioprocess and online monitoring of hydrogen production from crude glycerol. RSC Adv. 5(109), 89809–89816.
24. Sarma, S.J., Pachapur, V., Brar, S.K., Le Bihan, Y., Buelna, G. 2015b. Hydrogen biorefinery: Potential utilization of the liquid waste from fermentative hydrogen production. Renewable Sustainable Energy Rev. 50, 942–951.
25. Schäpper, D., Alam, M.N.H.Z., Szita, N., Lantz, A.E., Gernaey, K.V. 2009. Application of microbioreactors in fermentation process development: a review. Anal. Bioanal.Chem. 395(3), 679–695.
26. Sharma, Y., Singh, B., Korstad, J. 2010. Application of an efficient nonconventional heterogeneous catalyst for biodiesel synthesis from Pongamia pinnata oil. Energy Fuels 24(5), 3223–3231.
27. Sivagurunathan, P., Kumar, G., Bakonyi, P., Kim, S.-H., Kobayashi, T., Xu, K.Q., Lakner, G., Tóth, G., Nemestóthy, N., Bélafi-Bakó, K. 2016. A critical review on issues and overcoming strategies for the enhancement of dark fermentative hydrogen production in continuous systems. Int. J. Hydrogen Energy 41(6), 3820-3836.
28. Tenca, A., Schievano, A., Perazzolo, F., Adani, F., Oberti, R. 2011. Biohydrogen from thermophilic co-fermentation of swine manure with fruit and vegetable waste:
Maximizing stable production without pH control. Bioresour. Technol. 102(18), 8582– 8588.
29. Valerio, O., Horvath, T., Pond, C., Misra, M., Mohanty, A. 2015. Improved utilization of crude glycerol from biodiesel industries: Synthesis and characterization of sustainable biobased polyesters. Ind. Crops Prod. 78, 141–147.
30. Vatsala, T., Raj, S.M., Manimaran, A. 2008. A pilot-scale study of biohydrogen production from distillery effluent using defined bacterial co-culture. Int. J. Hydrogen Energy 33(20), 5404–5415.
31. Wei, Z., Xu, C., Li, B. 2009. Application of waste eggshell as low-cost solid catalyst for biodiesel production. Bioresour. Technol. 100(11), 2883–2885.
32. Yokoi, H., Maki, R., Hirose, J., Hayashi, S. 2002. Microbial production of hydrogen from starch-manufacturing wastes. Biomass Bioenergy 22(5), 389–395.
33. Yokoi, H., Saitsu, A., Uchida, H., Hirose, J., Hayashi, S., Takasaki, Y. 2001. Microbial hydrogen production from sweet potato starch residue. J. Biosci. Bioeng. 91(1), 58–63. 34. Yokoi, H., Tokushige, T., Hirose, J., Hayashi, S., Takasaki, Y. 1998. H2 production from
starch by a mixed culture of Clostridium butyricum and Enterobacter aerogenes. Biotechnol. Lett 20(2), 143–147.
35. Zagrodnik, R., Laniecki, M. 2015. The role of pH control on biohydrogen production by single stage hybrid dark-and photo-fermentation. Bioresour. Technol. 194, 187–195.
Figures
Fig. 1. Hydrogen (mmol/L) and end-metabolite concentration (g/L) for comparative study across mono- and co-culture system at 17.5 g/L of CG with eggshell x5 at 0.25% (w/v) concentration.
Fig. 2. The online monitored data of the parameters (pH, dissolved oxygen, temperature, agitation and hydrogen) during semi-continuous fermentation (7.5 L) using co-culture system for hydrogen production.
Supplementary Data
Fig. S1. Scanning electron micrograph of: (a) mono-culture E. aerogenes without eggshell; (b) mono-culture C. butyricum without eggshell; (c) co-culture of E. aerogenes and C. butyricum without eggshell; (d) co-culture with eggshell.
Table 1 Trends of using additional media components, co-substrate utilization and immobilization techniques for increased H2 production
Material Microorganisms Concentration Purpose Hydrogen production Hydrogen increase Ref. Acetate Clostridium spp. 3.2 g/L Additional media component 1.16 mmol/L medium 9% (Heyndri ckx et al., 1991) Polypepto ne C. butyricum and E. aerogenes 10 g/L Additional media component 2.4 mol/mol of glucose 3% (Yokoi et al., 2001) Corn steep liquor C. butyricum and E. aerogenes 10 g/L Media replacement 2.7 mol/mol of glucose 0.74% (Yokoi et al., 2002) Apple pomace hydrolysat e C. butyricum and E. aerogenes 5 g/L Co-substrate 26.07 ± 1.57 mmol/L medium 2.83 fold (Pachapu r et al., 2015b) Porous glass beads C. butyricum and E. aerogenes 100 mL (3-5 mm in diameter, 60–300 mm in pore size) packed 2 mm mesh) Immobilization 2.6 mol/mol of glucose 1.3 fold (Yokoi et al., 1998) Banana leaves (BL), coconut coir (CC), groundnut shells (GS) or pea shells (PS) Bacillus and Enterobacter spp. 3 g/L packed in polyvinylchlo ride tube (3X2 cm) Immobilization 1.65-3.0 mol/mol of glucose 2.5-6.4 fold (Patel et al., 2014; Patel et al., 2010) Eggshells (EGS) C. butyricum and E. aerogenes 0.25% (w/v) Neutralizing and immobilizing agent 36.53 ±0.53 mmol/L medium 1.5 fold Present study
Table 2 Hydrogen (mmol/L) and end-metabolite concentration (g/L) obtained with varying sizes of eggshells at 0.25% (w/v) concentration during batch and repeated batch fermentation.
Batch fermentation eggshell size Hydrogen (mmol/L) Ethanol (g/L) Butyric acid (g/L) Acetic acid (g/L) 1,3-PD (g/L) Control (Without eggshell) 32.07 ±0.92 1.96 ±0.16 2.73 ±0.04 0.27 ±0.03 2.17 ±0.08 1.7 mm<x1<3.35 mm 29.33 ±0.38 1.11 ±0.12 1.23 ±0.01 1.33 ±0.11 3.56 ±0.34 850 μm<x2<1.7 mm 30.97 ±0.84 1.31 ±0.07 1.28 ±0.02 1.91 ±0.04 3.53 ±0.17 300 μm<x3<850 μm 32.21 ±0.96 1.16 ±0.20 1.27 ±0.02 2.29 ±0.06 3.53 ±0.17 75 μm<x4<300 μm 33.57 ±0.82 1.14 ±0.24 1.31 ±0.04 2.49 ±0.06 3.51 ±0.28 33 μm<x5<75 μm 36.53 ±0.53 1.27 ±0.11 1.44 ±0.04 2.92 ±0.01 3.87 ±0.15 Repeated-batch fermentation Hydrogen (mmol/L) Ethanol (g/L) Butyric acid (g/L) Acetic acid (g/L) 1,3-PD (g/L) Control (Without eggshell) 36.57 ±0.69 2.03 ±0.06 2.98 ±0.02 0.73 ±0.04 2.89 ±0.04 1.7 mm<x1<3.35 mm 34.93 ±0.81 1.23 ±0.37 1.54 ±0.10 2.78 ±0.08 3.78 ±0.24 850 μm<x2<1.7 mm 35.76 ±0.91 1.45 ±0.10 1.74 ±0.09 2.89 ±0.06 3.99 ±0.15 300 μm<x3<850 μm 36.50 ±0.82 1.64 ±0.03 1.79 ±0.04 2.95 ±0.03 3.83 ±0.16 75 μm<x4<300 μm 37.45 ±0.70 1.79 ±0.28 2.32 ± 0.03 3.14 ±0.22 4.16 ±0.28 33 μm<x5<75 μm 41.16 ±0.95 1.68 ±0.36 2.44 ±0.11 3.46 ±0.14 4.28 ±0.31
Table 3 Hydrogen (mmol/L) and end-metabolite concentration (g/L) in presence of increasing concentration (w/v) (%) of eggshells of size x5 (33 μm<x5<75 μm).
Batch fermentation eggshell of size x5 concentration (%) Hydrogen (mmol/L) Ethanol (g/L) Butyric acid (g/L) Acetic acid (g/L) 1,3-PD (g/L) 0.25 36.53 ±0.53 1.27 ±0.11 1.44 ±0.04 2.92 ±0.01 3.87 ±0.15 0.5 37.05 ±0.41 1.11 ±0.02 1.22 ±0.01 2.75 ±0.05 3.62 ±0.12 1 37.58 ±0.32 1.42 ±0.03 2.15 ±0.02 3.08 ±0.02 3.75 ±0.01 2 36.81 ±0.11 1.46 ±0.13 1.99 ±0.04 2.97 ±0.01 3.81 ±0.02 4 32.73 ±0.22 1.69 ±0.04 1.38 ±0.01 2.84 ±0.05 3.94 ±0.03
Table 4 Hydrogen (mmol/L) and end-metabolite concentration (g/L) using co-culture system in presence and absence of media components at 17.5 g/L of CG with eggshell x5 at 0.25% (w/v) concentration.
Batch fermentation pH Hydrogen (mmol/L) Ethanol (g/L) Butyric acid (g/L) Acetic acid (g/L) 1,3-PD (g/L) Without yeast extract 5.96 ±0.08 22.08 ±0.29 1.34 ±0.34 0.21 ±0.01 0.79 ±0.23 2.94 ±0.40 Without casein peptone 5.91 ±0.06 21.86 ±0.44 2.12 ±0.01 0.17 ±0.02 1.62 ±0.06 4.46 ±0.15 Without KH2PO4 5.96 ±0.01 27.57 ±0.32 0.90 ±0.01 0.19 ±0.02 1.84 ±0.09 3.62 ±0.02 Without MgSO4.7H2O 6.06 ±0.05 30.18 ±0.24 1.06 ±0.02 1.24 ±0.01 2.21 ±0.10 3.14 ±0.08 Without KH2PO4 and MgSO4.7H2O 6.11 ±0.01 30.73 ±0.32 1.29 ±0.50 1.22 ±0.03 1.79 ±0.17 2.22 ±0.14 With synthetic CaCO3 5.95 ±0.03 26.43 ±0.23 1.18 ±0.03 0.21 ±0.10 2.12 ±0.02 3.55 ±0.08
Table 5 Cost analysis for bioconversion of 1 kg of crude glycerol into hydrogen for each of the comparative studies using co-culture system.
Process and materials required Amount for bioconver sion of 1 kg CG Cost ($) CG + media components, without EGS CG + media components + EGS CG + EGS, without media components Inoculum development (2.5 L) Glucose monohydrate (1%) 25 g 0.015 0.015 0.015 Casein peptone (2%) 50 g 2.125 2.125 2.125 KH2PO4 (0.2%) 5 g 0.007 0.007 0.007 Yeast extract (0.05%) 1.25 g 0.016 0.016 0.016 MgSO4 (0.05%) 1.25 g 0.001 0.001 0.001 L-cysteine (0.1%) 2.5 g 0.225 0.225 0.225 Media preparation (47.5 L) Crude glycerol 1 kg 0.100 0.100 0.100
Casein peptone (2%) 950 g 40.375 40.375 NIL
KH2PO4 (0.2%) 95 g 0.133 0.133 NIL
Yeast extract (0.05%) 23.75 g 0.297 0.297 NIL
MgSO4 (0.05%) 23.75 g 0.012 0.012 NIL EGS (0.25 %) 118.75 g NIL 0.013 0.013 Fermentation (143 h) 13.15 kWh 0.648 0.648 0.648
Total cost ($) for bioconversion of 1 kg CG
Fig. 1. Hydrogen (mmol/L) and end-metabolite concentration (g/L) for comparative study across mono- and co-culture system at 17.5 g/L of CG with eggshell x5 at 0.25% (w/v) concentration.
Fig. 2. The online monitored data of the parameters (pH, dissolved oxygen, temperature, agitation and hydrogen) during semi-continuous fermentation (7.5 L) using co-culture system for hydrogen production.