OATAO is an open access repository that collects the work of Toulouse
researchers and makes it freely available over the web where possible
Any correspondence concerning this service should be sent
to the repository administrator:
[email protected]
This is an author’s version published in:
https://oatao.univ-toulouse.fr/22239
To cite this version:
Le, Thanh Chi and Carlier, Axel and Maussion, Pascal and Pham,
Quoc-Dzung Measuring rotor-speed with a smartphone camera.
(2017) In: 43rd Annual Conference of the IEEE Industrial
Electronics Society (IECON 2017), 29 October 2017 - 1 November
2017 (Beijing, China).
Open Archive Toulouse Archive Ouverte
Official URL
Measuring rotor speed with a smartphone camera
LE Thanh-ChiPower Electric Department Bach Khoa University Ho Chi Minh City, Vietnam
Axel CARLIER IRIT, Université de Toulouse
France [email protected] Pascal MAUSSION LAPLACE, Université de Toulouse, France [email protected] v-tlse.fr PHAN Quoc-Dzung Power Electric Department
Bach Khoa University Ho Chi Minh City, Vietnam
Abstract— This paper presents a new method to measure a rotor
speed using a smartphone camera. An image processing algorithm is proposed to measure the rotation speed, based on the periodic detection of a mark placed on the rotor. Experiments demonstrate our method can estimate rotor speed with a good precision, provided that the camera frame rate is high enough. The method could be very useful for periodic speed measurement in applications where a sensor is prohibited, for example in pico-hydro-turbine for rural electrification. Since the smartphones are almost everywhere, they contribute to cost and environmental impact reductions in such solutions. The rest of the system is composed of reused components according to the principles of frugal innovation.
Keywords— speed measurement, region of interest, grayscale,
frames per second, exposure time, background subtraction.
I. INTRODUCTION
Many developing countries have high potential of renewable energy resource, but the installed power is generally not high enough to cover the energy needs of the whole country. Beside, about 80% of population in rural areas and 75% of the households live without electricity for example in Cambodia. They survive by using battery, diesel engine, candle, kerosene for lighting, TV, multimedia and some other household appliances. A few of residents in northern part of the country use pico-hydro power units bought from neighbor countries in order to electrify their houses. In these systems, the output voltage and frequency are not really stable while the load under load or speed variations. Consequently, the lifetime of household appliances could be reduced or the items damaged and local repairs are needed. Moreover, millions of poor people cannot access neither benefit from the available energy resources due to two main factors: technology barriers and high investment cost. The research presented in this paper is a part of a whole lot: remove technology barriers by designing systems for rural electrification thanks to pico-hydro and PV generation with fast and simple installation, suitable for local applications with high quality of electrical supply at a low cost and reduced environmental impact. This is the basis of frugal innovation, well-known as “jugaad” [1], which is very useful for the bottom of the social pyramid.
In rural areas where people are facing the lack of electrical supply and they cannot neither improve their living standard nor develop their community. Rich villagers use car batteries, PV and pico-hydro power while poor villagers use candle/kerosene for lighting. Local enterprises can provide
renewable energy solutions but the prices are unaffordable and far from population expectations. Therefore, an original solution is proposed in this work by using wasted electric and electronic equipment (second-life components) to form new power generation systems devoted to remote rural areas.
To reach this goal, local solutions have to be based on local recycled products, such as PC power supplies for PV applications. Indeed, a huge number of electronic products are often discarded even before the end of their useful life. This is particularly the case for pc power supplies, when motherboard or hard disk are out of order. For cheap solutions, reusing electric motor in consumer products has been studied in [2]. The environmental impact of smartphone repurposing as compared to traditional refurbishing using life cycle assessment has been investigated in [Zink14]. An alternative to dismantling and recycling in an optimistic way has been successively studied by the same research team in [3] [4] [5]. The main idea in these works is to transform a part of an ATX power supply, the active PFC front-end stage, into a new converter dedicated to MPPT control for photovoltaic generation but this needs a new PCB. On the contrary, [6] reuses the whole PC power supply with only few modifications on the existing PCB.
For AC supply, the use of reused induction machines has been investigated with Self-Excited Induction Generator (SEIG) in addition with capacitors [7], as single-phase operation of three phase machines with different types of controllers and power converters [8][9] or even with Double-Fed Induction Machine [10]. This last solution as a high cost and a complexity which is not suitable for pico-hydro power in the rural areas of developing countries. As a “juugad” solution, simple low cost solution using a 3-phase induction motor as a single phase generator has been proposed in [11][12] and [13].
Anyway, whatever the electro-mechanic solution, data must be measured on the system, continuously for voltage or frequency regulation, or from time to time for water flow control and operation speed of the electric machine. In this case as well, the measurement system must have the same characteristics as that of the electricity generation system: cheap, robust, efficient, easily and locally available. Smartphones are everywhere, even in remote areas where everybody over 15 has got one (or more) smartphone. Today, digital cameras have been used extensively, they are embedded on almost cell phones. With the price of mobile phones decreasing, there is reason to think about using cell phones for speed measurements instead of professional devices used in the industry, such as encoders.
II. GLOBAL CONTEXT
The application of reuse materials in islanded electric systems for remote areas in developing countries offers many possibilities. This local solution should not only reduce the environmental impacts, but could also be viewed at the same time as simple and favourable for local production or business and ensure production in large amount. The system which is proposed in this paper includes solar PV panels, modified power supply units (PSUs), modified uninterruptable power supply units (UPSs) a three phase induction machine turned into a single phase generator and used car batteries. Cheap microcontrollers with few interface components are added for control purposes. Fig 1. describes the architecture of the whole system.
Fig.1; Architecture of the electrification system Smartphones has already been used for acoustic diagnostic purposes in [14], but in this research a cell phone is used to record videos. Then from this video, the speed of the rotor can be measured after image processing. All we need is an android smartphone with a camera, and a sticker. It’s a low-cost option to measure the speed of the rotor and it can be used with a lot of sizes of rotors. Fig. 2. presents a typical example of a pico-hydropower station in Cambodia.
Fig.2. Example of small hydro-systems in Cambodia
III. RELATED WORK A. Sensor for speed measurement
There are a lot of devices and methods used for speed measurement. A sensor is generally used to sense shaft speed, but may be too expensive in the targeted applications. Typical devices used for this purpose are shaft encoders (rotary pulse generators), proximity sensors, and photoelectric sensors. Each of these devices sends speed data in the form of pulses. Two factors affect the quality of this data:
x Number of pulses per revolution of the shaft (referred to as PPR). Higher PPR values result in better resolution.
x Symmetry of pulses. The symmetry of one pulse to the next play a role in how consistent the RPM readings are. Symmetrical pulses give more accurate data. Shaft encoders are the best solution for the sensing device. They offer high resolution (typically 256 to 5000 PPR) and clearly defined, symmetrical pulses. However, sometimes it is not feasible to mount an encoder to the shaft being monitored. Proximity sensors provide medium- or low-resolution sensing, depending on the number of pulses measured per revolution. The best method of using a proximity sensor is to sense the teeth on a gear. This type of sensing typically has options for 60, 120, or 240 PPR, and the pulses are relatively clearly defined and symmetrical.
External photoelectric sensors usually provide low resolution, due to the low number of pulses measured per revolution. A photoelectric sensor must sense a reflective target on the shaft. If more than one target is used to increase the PPR, then the symmetry from one pulse to the next is likely to be poor.
B. Detecting the mark
There are two methods often used for rpm measurement: the “Frequency” measurement method and the “Period” measurement method. People often use the Frequency measurement method to measure high PPR solutions. When using high PPR sensors, such as shaft encoders or proximity sensors sensing gear teeth, the easiest way to determine RPM is to monitor the pulse frequency from the sensor using a digital input module. Then, the RPM can be calculated using equation (1).
(1) Period measurement method is also used to measure low PPR solutions. Because it can be measured with higher resolution, measuring the pulse period is the best method of measuring RPM when using low PPR sensors such as photoelectric sensors, or proximity sensors sensing a bolt head. Period is the time from the start of one pulse to the start of the next pulse. Equation (2) shows the relationship between rpm and period.
IV. OVERVIEW OF THE METHOD
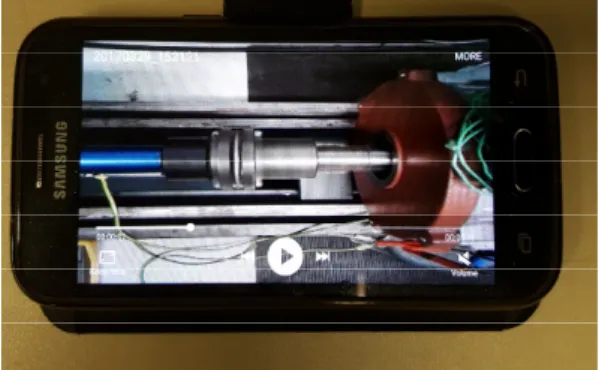
In order to estimate the rotor speed, the number of rounds of the rotor must be counted. In this work, it is decided to place a white sticker as a mark to be counted. Every time the mark passes in front of the camera, we know there was a round. Fig. 3. shows a picture on the smartphone of the rotating shaft on which a sticker has been placed.
Fig. 3. One picture of the rotating shaft from the video on the smartphone
Unfortunately, detecting the mark is not an easy task. The rotor has a reflective surface, which, as can be seen on Fig.4, creates a horizontal bright line around the center of the image. In addition, since a rotor operates at hundreds of rounds per minutes, the mark appears blurry on the image. The mark can be seen on Fig. 4 on the top-left side of the rotor and appears quite wide because of the blur. Finally, the frequent illumination changes make it even more difficult to detect the white mark, which appears over a grey background.
Fig. 4. A frame in a video with a high level of light reflection
For all these reasons, the proposed method is only focused on detecting the presence of the mark on the current image. To do so, we first detect a region of interest, in which the mark search will be performed. Then, we characterize the area of this region of interest inside which the mark is probably present for each frame. Those two steps are explained in the next section.
V. REGION-OF-INTEREST AND MARK DETECTION A. Detecting the region of interest
The first step towards detecting the mark is to restrict the search area on the image, i.e. to detect a region of interest in which the mark has the highest probability to be found. To do so, it is assumed that if the camera does not change its focus, most of the image pixels do not vary in color.
Fig. 5. Image of the standard deviations of the pixels
The pixels that should display the highest color variability are those which change color periodically as the mark passes. These pixels basically switch from grey to white. A simple way to exhibit those pixels is to compute the standard deviation of the pixel colors over Nf frames. In our implementation, Nf = 50 is chosen. Fig. 5 shows a grey-level image of the standard deviation computation: the whitest pixels are those with the highest standard deviation. This image is binarized by keeping the 10% pixels with the highest standard deviation value. The result of this step is displayed in Fig. 6.
Fig. 6. Pixels which have 10% highest standard deviation (for overall)
Finally, since these operations are sensitive to noise (illumination changes, camera motion, etc.), the connected components are computed and only the one with the largest area as a region of interest are kept. The result on our example is shown in Fig. 7. The region of interest to consider for mark detection is the bounding box around this region.
B. Detecting the marks
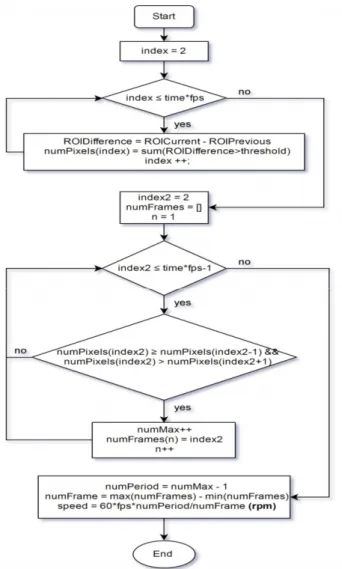
The mark detection is based on computing the difference between consecutive frames. The assumption is that any major change in color in the region of interest is due to the mark passing in front of the camera. As a consequence, our algorithm simply computes, for every frames, the absolute value of the difference between the current frame and the previous frame. Then, only the difference values located inside the region of interest are considered and the number of pixels that are above a threshold are counted. The threshold has been fixed to 50, based on the assumption that the mark is white and the rotor is grey. As explained in the following section, the local maxima of these values across time to obtain the number of periods are detected. It can then infer the speed of the rotor using equation (3) included inside the flowchart from Fig. 8.
Speed = 60*fps*number of periods / number of frames (3)
Fig. 8. Flowchart of the speed measurement algorith
There are some steps in the above algorithm:
- Measure the number of white point in ROI of each frame and store data into numPixels array,
- Find local maximum in numPixels array,
- Count the number of frames between the two consecutive frames which have the maximum white points,
- Calculate the speed of rotor based on this result and frames per second.
VI. LIMITS AND CONSTRAINTS OF THE METHOD A. Waveform analysis in continuous domain and necessary
length of mark
When a video of the rotor with camera is recorded, there are two areas: a visible area and an invisible area as introduced in Fig. 9. By using background subtraction [15], it can easily be
understood that:
- when the mark goes through visible area, the difference will be increased from zero to maximum, then be decreased to zero.
- when the mark goes through invisible areas, the difference will be zero.
Fig. 9. Visible area and invisible areas on the rotor
Assuming that the exposure time is much smaller than the period of rotor and the length of the mark (m) is much smaller than the circumference of the rotor (2ʌr), the difference will be graphed as follows in Fig. 10.
Fig. 10. Differences between two adjacent frames
In order to find the correct result, the time between two successive frames must be as written in (4):
Ti = 1/fps < arccos(r/l)×T/ (4)
frotor < arccos(r/l)×fps/ (5)
This ensures that at least one frame when the mark crosses the visible area could be always recognized. Thus, the frequency of the rotor has an upper limit given by (5). On the other hand, to identify one period with certainty, at least one frame when the mark is in the visible area and one frame when the mark is in the invisible area are needed. Inequation (6) gives the maximum frequency of the rotor which must be:
The problem is to increase the time during which the rotor is in the visible region from arccos(r/l)×T/ to T/2. This problem is solved by increasing the mark length as in Fig.11.
Fig. 11. Find the necessary length of mark
B. Waveform analysis in discrete domain
In the discrete domain, the received waveform will look like in Fig.12. Based on this figure, the necessary length of the mark can be deduced as in eq. (7)
m = ( - 2×arccos(r/l)) × r (7)
Fig. 12. Waveform in discrete domain
A local maximum can be used to find the maximum difference of each period, the time between two maxima is the period of rotor. However, the maximum difference in discrete domain is not the maximum difference in continuous domain. Therefore, there is a difference between the real frequency of rotor and the result achieved from this method. By increasing the number of observed pulses, precision can be increased, simply by increasing the length of the video.
VII.EXPERIMENTAL RESULTS
This section presents the experimental results for the proposed algorithm based on the following parameters:
- Frame per second = 30fps or 118fps - Video time = 5s or 15s
- Synchronous speed of the rotor = 1500 rpm
A. Experimental results for different camera frame rates
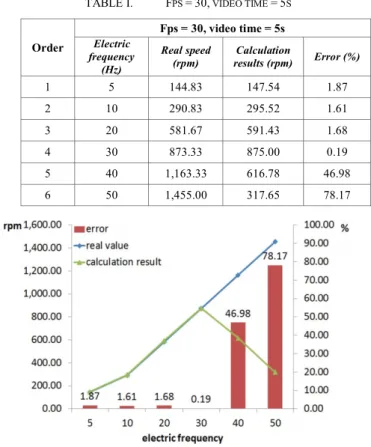
Table I and Fig.14 present the results of the speed calculation for different supply frequencies of the induction motor without any load and in an open loop control mode. It can easily be seen that precision is quite good as soon as speed remains lower than 900rpm. Above this limit, the number of fps is not high enough to achieve correct speed evaluation as equation (6) is not valid.
TABLE I. FPS = 30, VIDEO TIME = 5S
Order Fps = 30, video time = 5s Electric frequency (Hz) Real speed (rpm) Calculation results (rpm) Error (%) 1 5 144.83 147.54 1.87 2 10 290.83 295.52 1.61 3 20 581.67 591.43 1.68 4 30 873.33 875.00 0.19 5 40 1,163.33 616.78 46.98 6 50 1,455.00 317.65 78.17
Fig. 14. Results when fps = 30 and video time = 5s
TABLE II. FPS = 118, VIDEO TIME = 5S
Order Fps = 118, video time = 5s Electric frequency (Hz) Real speed (rpm) Calculation results (rpm) Error (%) 1 5 144.83 148.12 2.27 2 10 290.83 297.25 2.21 3 20 581.67 595.28 2.34 4 30 873.33 894.19 2.39 5 40 1,163.33 1,192.30 2.49 6 50 1,455.00 1,491.80 2.53
In the case of a better smartphone with 118 fps, the precision remains good for the considered speeds as depicted in Table II and Fig.15 because expression (6) is still valid
B. Experimental results for different video lengths
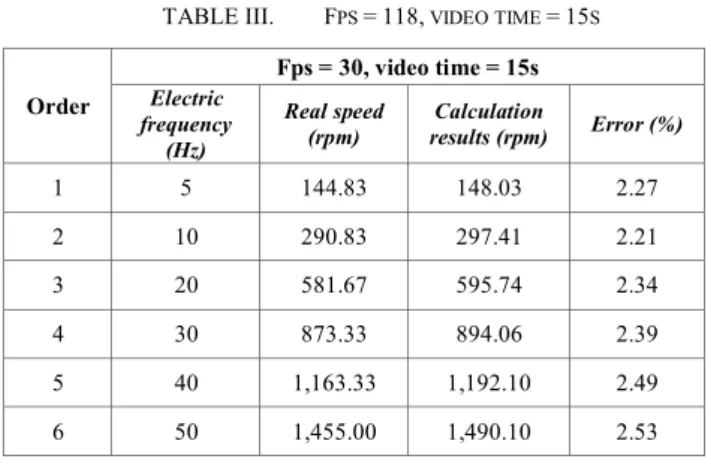
It can be seen in Table III that the results have higher precision but not much increased. Therefore, a compromise has to be found between processing time and accuracy.
TABLE III. FPS = 118, VIDEO TIME = 15S
Order Fps = 30, video time = 15s Electric frequency (Hz) Real speed (rpm) Calculation results (rpm) Error (%) 1 5 144.83 148.03 2.27 2 10 290.83 297.41 2.21 3 20 581.67 595.74 2.34 4 30 873.33 894.06 2.39 5 40 1,163.33 1,192.10 2.49 6 50 1,455.00 1,490.10 2.53
VIII. FUTURE WORK
The final purpose of this project is pico-hydro-turbine speed measurement just with a smartphone, using the camera for videos of course, but also embedded signal processing on the smartphone. Then, Fig. 14 presents an example of a small size turbine made of PVC in our facilities but which could easily be made of wood in other countries. As before, the smartphone allows video captures as shown in Fig 15 with a static image. The development of dedicated applications for low speed high precision measurements with the smartphone only is currently under work.
Fig.14. Examples of small hydro-turbine in our facility
Fig.15. Picture of the video obtained with the small rotating hydro-turbine
IX. CONCLUSION
An image processing algorithm has been proposed to calculate the speed of the rotor through a video, which is just recorded by the camera of a cellphone. The experiments have acceptable results with high precision. This method is a simple and economic solution for sensorless speed measurement of a lot of rotors with the camera of cellphone and a sticker. It is a good candidate for periodic turbine speed measurements in electrification systems in rural areas in developing countries where cost is a key factor.
REFERENCES
[1] N. Radjou, J. Prabhu, S. Ahuja, “Jugaad Innovation”, Random House Publishers India Pvt. Limited, 2012, June
[2] Klausner, M., Grimm, M. and Hendrickson, C. (1998), Reuse of Electric
Motors in Consumer Products. Journal of Industrial Ecology, 2: 89–102
[3] Schofield, D.M.K.; Abuzed, S.; Foster, M.P.; Stone, D.A.; Rogers, D.J.; Green, J.E., “Second life of computer power supplies in PV battery
charging applications”, Power Electronics and Applications (EPE), 2013
15th European Conference on.
[4] Rogers, D.; Green, J.; Foster, M.; Stone, D.; Schofield, D.; Abuzed, S.; Buckley, A., “Repurposing of ATX computer power supplies for PV
applications in developing countries”, Renewable Energy Research and
Applications (ICRERA), 2013 International Conference on.
[5] Rogers, D.; Green, J.E.; Foster, M.P.; Stone, D.A.; Schofield, D.; Buckley, A.; Abuzed, S., “ATX power supply derived MPPT converter for cell
phone charging applications in the developing world”, Power Electronics,
Machines and Drives (PEMD 2014), 7th IET International Conference [6] “Second Life of Power Supply Unit as Charge Controller in PV System
and Environmental Benefit Assessment”, B. Kim, M. Pietrzak-David, B. Dagues, P. Maussion, C. Azzaro-Pantel, L. Bun, IEEE Industrial Electronics CONference, IECON 2016, October, Firenze, Italy
[7] S.S Murthy, "a novel self-excited self-regulated single phase induction generator," IEEE Trans. on Energy Conversion, Vol. 8, No. 3, Sept 1993 [8] T.F. Chan and L.L. Lai, "Single-phase Operation of a Three-phase
Induction Generator Using a Novel Line Current Injection Method, "
IEMDC'03, Machines and Drives Conference, June 2003
[9] S.S. Murthy, U.K. Kalla and G. Bhuvaneswari, "A novel electronic controller implementation for voltage regulation of single phase self-excited induction" IEEE Industry Applications Soc. Annual Meeting, 2010 [10] R. Pena; J.C. Clare, and G.M. Asher, "A doubly fed induction generator using back-to-back PWM converters supplying an isolated load from a variable speed wind turbine," in Proc. IEE, Electric Power Applications, vol. 143, pp 380-387, 1996
[11] U.K. Madawala, T. Geyer, J.B. Bradshaw and D.M. Vilathgamuwa, "Modeling and Analysis of a Novel Variable-Speed Cage Induction Generator," IEEE Industrial Electronics, Trans on. 2012, vol. 59 [12] P. Chrin, P. Maussion, M. Pietrzak-David, B. Dagues, L. Bun, "Modeling
of 3-phase Induction Machine as Single Phase Generator for Electricity Generation from Renewable Energies in Rural Areas", IEMDC'15,
Machines and Drives Conference, 2015, Coeur d’Alene, USA
[13] P. Chrin, M. David, P. Maussion, “Renewable energy production with some wasted second-life components”, IEEE-ISIE 2016, June 2016, International Symposium on Industrial Electronics, Santa Clara, USA, [14] P. Rzeszucinski; M. Orman; Cajetan T. Pinto; A. Tkaczyk; M. Sulowicz,
« A signal processing approach to bearing fault detection with the use of a mobile phone », 2015 IEEE Symposium on Diagnostics for Electrical Machines, Power Electronics and Drive, SDEMPED
[15] M. Piccardi, “Background subtraction techniques: a review”, IEEE International Conference on Systems, Man and Cybernetics. The Hague, vol. 7, 10 – 13 October 2004