HAL Id: hal-01158743
https://hal.archives-ouvertes.fr/hal-01158743
Submitted on 1 Jun 2015HAL is a multi-disciplinary open access archive for the deposit and dissemination of sci-entific research documents, whether they are pub-lished or not. The documents may come from teaching and research institutions in France or abroad, or from public or private research centers.
L’archive ouverte pluridisciplinaire HAL, est destinée au dépôt et à la diffusion de documents scientifiques de niveau recherche, publiés ou non, émanant des établissements d’enseignement et de recherche français ou étrangers, des laboratoires publics ou privés.
An Energy-Saving Algorithm for Energy Expenditure
Estimation with a Smartphone Sensor Based Approach:
a Contribution to the Mobility Measurement in e-Health
Martine Duclos, Gérard Fleury, Romain Guidoux, Philippe Lacomme,
Pierre-Henri Manenq, Ludivine Paris, Raksmey Phan, Libo Ren, Sylvie
Rousset
To cite this version:
Martine Duclos, Gérard Fleury, Romain Guidoux, Philippe Lacomme, Pierre-Henri Manenq, et al.. An Energy-Saving Algorithm for Energy Expenditure Estimation with a Smartphone Sensor Based Approach: a Contribution to the Mobility Measurement in e-Health. [Rapport Technique] auto-saisine. 2015, 4 p. �hal-01158743�
An Energy-Saving Algorithm for Energy Expenditure Estimation with a
Smartphone Sensor Based Approach: a Contribution to the Mobility
Measurement in e-Health
M. Duclos1,2, G. Fleury3, R. Guidoux4, P. Lacomme5, P-H. Manenq6, L. Paris2, R. Phan5, L. Ren5, S. Rousset2
1 Université d’Auvergne, CHU Clermont-Ferrand, 63003 Clermont-Ferrand
2 INRA Unité de Nutrition Humaine UMR 1019, CRNH d’Auvergne 63009 Clermont-Ferrand
3 Laboratoire de Mathématiques, CNRS 6620, Campus des Cézeaux, 63173 Aubière Cedex
4 29bis rue du Sable d'Étampes, 63400 Chamalières
5 LIMOS, UMR6520 CNRS 6158, Campus des Cézeaux, 63173 Aubière Cedex
6 CRCGM, EA3849, 63000 Clermont-Ferrand
7
ALMERYS, 46 rue du Ressort 63967 Clermont-Ferrand Cedex Corresponding author: phan@isima.fr
Abstract. This paper introduces a predictive function for total energy expenditure (TEE)
estimation of the current life using the embedded smartphone accelerometer sensor. Our research encompasses definition of an energy-saving function without any hypothesis on its initial relative position. Six 25-year-old highly graduate participants wore a smartphone in a front pants pocket and a valid Armband device for a day of a desk job. The performance of the proposed function is estimated by using our smartphone application and evaluated by comparing TEE given by the function with TEE of Armband device. The mean gap of TEE between our function and Armband was less than 15%. This work is a preliminary step forward definition of a new predictive function well tuned for representative French population. Our work is now directed on validation on a larger population sample.
Keywords accelerometers, smartphone, energy expenditure estimation, e-health.
1.
Introduction
Chronic diseases such as obesity and diabetes have become emergent epidemics in industrialized countries. One of the main reasons is the imbalance between energy intake and energy expenditureprobably resulting from poor dietary habits and lack of physical activity. As stressed by Pande et al. [1], moderate and vigorous physical activities can lead to health promotion and disease prevention especially through restoring the energy balance. Therefore, the accurately measure of the total energy expenditure (TEE) allows adapting diet and preventing chronic diseases.
Un algorithme économe en énergie pour l'estimation de la dépense énergétique à partir des
accéléromètres d'un smartphone : une contribution à la e-santé.
Résumé en Français : Cet article présente une nouvelle fonction de prédiction de la dépense énergétique totale (DET)
à partir de données collectées par les accéléromètres des smartphones. Notre ambition est de proposer une solution économe en batterie et indépendante de la position initiale du smartphone. Six volontaires âgés de 25 ans en moyenne, hautement diplômés, ont porté un smartphone dans une poche avant du pantalon et un brassard Armband pendant une journée de travail au bureau. La qualité de la fonction a été évaluée en comparant les écarts de dépense énergétique totale entre la fonction et le Armband. En conditions habituelles de vie, l'écart moyen est inférieur à 15%. Le travail réalisé ici est une première étape dans la définition d'une fonction de prédiction qui soit adaptée à l'ensemble de la population Française. Nos travaux portent actuellement sur la généralisation de nos propositions à un échantillon plus large de la population.
In the literature, there are two reference methods to measure the TEE: indirect calorimetry based on gas exchange (IC) and doubly-labeled water (DLW). However, both methods involve costly medical material and qualified staff. So, these methods are not adapted to free-living conditions. Many wearable sensors-based approaches have been developed offering an alternative solution to measure TEE under free-living conditions. Most of those approaches incorporate the use of accelerometers. This is the case of the SenseWear Pro3 Armband, which combines body temperature, heat flux, impedance and accelerometry.
After becoming a daily object, the smartphone is becoming a research sensor for personal health monitoring in clinical and fitness trials (see Duclos et al. [2]). Comparing to wearable sensors, smartphone is one of the most convenient devices for TEE because people who has a smartphone don’t need to purchase and carry another devices. Therefore, the design of an accurate and online TEE function using smartphone accelerometers is a difficult task, which involves the dual challenge of accuracy measure and low battery consummation. As stressed by Khan et al. [3], only a small number of previous researches can be classified as online system, i.e. the whole process including data-collecting, TEE estimation is performed on the device.
This paper aims to introduce an online predictive function for TEE estimation using smartphone’s accelerometers without any hypothesis on its initial position in the axes X, Y and Z framework. Information on the initial smartphone position is the major disadvantages of the several previous works in this topic. The accuracy of this function is assessed by comparing the TEE estimated by the smartphone to the TEE provides by a reference sensor, the Armband. This first step was achieved with 6 participants under controlled and free living conditions. The results showed that the TEE is estimated with an error of around 15% with the Armband. Preserving the battery has received a considerable interest because functions requiring heavy computation or high frequency are usually high energy consuming (see [1]). The proposed online function allows an estimation with battery saving and data collect by accelerometers with a relative low frequency.
This work confirms the Mellone's judgment in [4] who claims that a mass-market accelerometer embedded in a smartphone could provide high quality measurement as regards as a commercial dedicated unit. Our contribution is:
the definition of a new energy expenditure function adapted to a way of life composed of moderate activities based only on accelerometers and participant data without any information on the initial smartphone position;
datasets of accelerometry are available for free download at
http://www.isima.fr/~lacomme/donnees_acc
which must favor future research works in this topic; the development of an application (in the long term) on Android market should confirms the efficiency of our algorithm.
The rest of this paper is organized as follows: Section 2 presents an overview of related works in this topic. Section 3 describes the schematic representation of the used workflow. The experimental results are detailed in Section 4, before concluding remarks.
2.
Smartphone based approach in health and previous research approach
As stressed by Klasnja et al. [5], smartphones are attractive for delivering health information since: (1) the widespread adoption of phones with increasingly powerful capacities, (2) people have inclination to carry their phones everywhere, (3) people's attachment to their phones, and (4) context awareness features enabled through sensing and phone-based personal information. Medical research based on smartphone technologies over the last 5 years hold into 4 main classes: education applications, new feedback mechanisms, new complement in measures and preventive healthcare system.
Burki [6] stated that the smartphone applications could offer considerable benefits since they are cheap and speedy. They can improve diagnosis for those in remote regions and could assist therapists. Authors highlight that there are not only benefits for patients but also potential risks including late diagnosis due to deficient classification of melanoma by the application.
The recent publication of Jenny [7] is the first one that intends to corroborate that, even if sensor of smartphone cannot be as precise as a dedicated specific sensor, the precision is sufficient to the specific field of knee flexion. Datta et al. [8] investigated a new research area in defining the first smartphone based
system dedicated to a global surveillance of the Illinois population gathering data using school nurse. The smartphone is not only a way to gather data but provide also user friendly interface providing report visualization. Authors stated that the system contributed to democratization of health data management since mobile technology has the potential to revolutionize telemedicine, and to make patient-centric medical computing a reality. There are more than 491 million smartphones in 2012 Guido et al. [9] against the 139 million units in 2008. Smartphones offer a convenient alternative to the standard data gathering system, and promote new approaches which contribute to redefine medical education and information distribution which is remarkable in the variety of medical domain cover by publications over the last 5 years.
3.
Methodology
a. General framework
Figure 1 provides a schematic representation of the used workflow during this study and for which the key features are stressed during the problem analysis and encompass the following.
Part 1. Initialization: bibliography, assignment of MET values to each activity and design of a smartphone prototype to record accelerometry data.
Part 2. Recruitment of participants, collection of accelerometry data
t (xt,yt,zt) on the three axes at instant t by the smartphone and recording of TEE by Armband. Part 3. Energy expenditure function definition in free living condition based on a specific statistical analysis of data gathering in free-living conditions.
Part 4. Testing consists in validation of the function using a set of 𝑃 participants and to estimate the deviation between the dedicated Armband device and the function.
Part 5. Evaluation of function performance.
Problem analysis Data collection Requirements Creation of categories Categories in UR (Unit of Reference) Average performance Categories in METs Test
Prototype testing Results
Data collection Real life conditions
Energy expenditure function Personalized categories in UR (Unit of Reference) Data collection
Figure 1. The five steps methodology used
The process starts with a state of the art in the energy expenditure estimation and the classification of activities into 4 categories depending on their intensity: immobile (standing/sitting), light-, moderate- and vigorous- intensity activities (Table 1). The intensity of an activity is expressed in MET (Metabolic Equivalent Tasks) which is the ratio of the work metabolic rate to a standard resting metabolic rate (RMR). One MET is the energy cost of a person at rest and is approximately 3.5 ml of consumed O2.kg-1 of body weight.min-1 or 1 kcal.kg-1 of body weight.hour-1.
Categories Minimal value in MET Maximal value in MET
C1 : standing or sitting activities 0.90 2
C2 : light-intensity activities 2 3.5
C3 : moderate-intensity activities 3.5 6
C4 : vigorous-intensity activities 6 9.00
b. Adaptation of general MET values to individual characteristics
Table 1 gives the general METs values for several activities according to Ainsworth et al. [10]. For example, general MET value for walking is 3.5, brisk walking is 4.3, running is 6 and sitting is 1.4.
However the energy cost at rest
is specific to each and is not necessarily equal to 3.5 mLO
2.kg
-1.min
-1.
In order to get more accurate results, we customize general MET from individual characteristics as
follows:
S S C MET RMR kg ml MET A W H MET 1 1 min 5 . 3 ) , , ((1)
where METS is the general value of METS, and RMR is the resting metabolic rate estimated using the Harris and Benedict's equations (Table 2) [11]. is the corrective weighting that must be applied to the METS and
which was supposed to reflect the difference between the biological characteristics of participants.
Male (kcal.day-1) Female (kcal.day-1) Equation 66.473 + 5.0033H +13.7516W – 6.755A 655.0955 + 1.8496H + 9.5634W – 4.6756A
Table 2. Estimation of the resting metabolic rate (W: weight in kg; H: height in cm; A: age in year)
c. Characteristics of participants
The population sample is composed of three male and female participants. They are 25-year-old on average and their body mass index (BMI) is around 23.8 kg.m-2.
Using equation of Table 2, the classification into categories can be updated taking into consideration, the participants' characteristics including age, gender, weight and height. Table 3 provides the definition of categories tuned for each participant. First, we can note a significant difference between categories depending on participants. For example, the category 1 varies in the range [0.82; 1.83[ for participant 1 but [0.96; 2.14[ for participant 3.
Participants Category 1 Category 2 Category 3 Category 4 1 0.91 [0.82; 1.83[ [1.83; 3.20[ [3.20; 5.49[ [5.49; 8.23] 2 1.02 [0.91; 2.03[ [2.03; 3.55[ [3.55; 6.09[ [6.09; 9.14] 3 1.07 [0.96; 2.14[ [2.14; 3.74[ [3.74; 6.41[ [6.41; 9.61] 4 0.99 [0.89; 1.98[ [1.98; 3.46[ [3.46; 5.93[ [5.93; 8.90] 5 1.08 [0.95; 2.11[ [2.11; 3.69[ [3.69; 6.32[ [6.32; 9.48] 6 1.05 [0.95; 2.10[ [2.10; 3.68[ [3.68; 6.31[ [6.31; 9.47]
Table 3. Personalized categories in MET for each participants
d. Energy Expenditure Estimation
As stressed by Guidoux et al. [12] a predictive function can be described by
f
(
,
d
)
g
(
,
d
)
where
g
(
,
d
)
is a recognition trend function of activities for TEE estimation, and
is a stationary correction term. The proposed function uses the same structure whereg
(
,
d
)
r
(
)
p
(
d
)
and
1
: r is a supervised function in controlled condition (which gives an estimation of the energy necessitated by accelerations (the dataset collected at 5 Hz by the accelerometer and t(xt,yt,zt) the values on the three axes at instant t );
p is an unsupervised function which depends on the total duration of the experiment
d
and encompassed the free living conditions.In this paper, the supervised function r is defined as the variance of acceleration: 2 1
)
81
.
9
(
1
)
(
n t tn
r
, where t xt2yt2 zt2 and 9.81 is an approximation of Earth surface gravity. The following will explain how this function could be efficient to estimate Energy Expenditure.
To begin we remind the Newton's second law [13] which states that the net force applied on an object is
proportional to the derivative of its linear momentum in an inertial reference. It is noted
dt v m d dt p d F ( )
where p is the linear momentum vector, v the speed vector and
m
the mass of the object. Sincem
is constant we have
ma
F (1). This equality can be summarized as follows: "the sum of forces vectors F on
an object is equal to the product of acceleration vector
aof the object and its mass
m
". From (1), we deduce that 9.81 9.81 a m F a m F a m
F . Then for a series of finite sequences of
acceleration vector ai
the following equality holds
n i i n i i a n m F n 1 2 2 1 81 . 9 1 81 . 9 1 (2)A small value of variance indicates that the data points tend to be very close to the mean (expected value) and hence to each other, while a high variance indicates that the data points are very spread out around the mean and from each other. The variance is typically designated as
n i i x x n X Var 1 2 1 ) ( (3)where xi is a finite sequences of values of X and x its mean value. From (2) and (3), for
x
9
.
81
, we have
2 1 1 2 81 . 9 1 81 . 9 1 ) (
n i i n i i m F n a n X Var (4)With the equality (4) we prove that studying variation of acceleration values could let us to determine the intensity of forces apply on the object. We can estimate the TEE from the force intensities.
MET values were calculated from TEE estimated by the function or Armband, and from RMR estimated by Harris & Benedict equations: 𝑀𝐸𝑇 =0.9∗𝑇𝐸𝐸𝑅𝑀𝑅 .
For participant 1, if 0.82 < MET < 1.83 his activity is ranked in category 1.
4.
Numerical experiments in free living conditions
a. Data collection
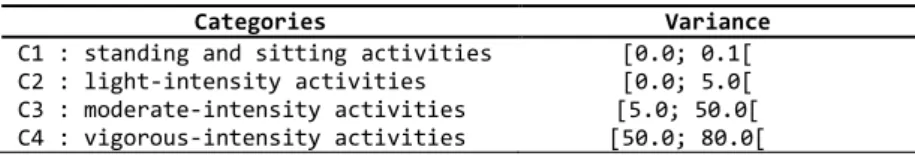
Participants wore a smartphone (Android OS) in the left front pants pocket, and a SenseWear Pro3 Armband (Bodymedia version 6.0) monitor on the right arm (triceps). A set of data files were collected using smartphone divided into two groups. The first group based on 6 participants, has been carried using a set of activity scenario. A 20-minute scenario is composed of an ordered set of 4 activities including standing-sitting, slow-walking, walking and running. By a clustering approach this group has permitted to determine the minimal and maximal variance values of t in each category. Table 4 gives these values.
Categories Variance
C1 : standing and sitting activities [0.0; 0.1[ C2 : light-intensity activities [0.0; 5.0[ C3 : moderate-intensity activities [5.0; 50.0[ C4 : vigorous-intensity activities [50.0; 80.0[
The second group is also composed of 6 participants in free-living conditions on a working day. These categories are tuned with
2 the corrective weighting fully defining the personalized category of participants introduced in Table 5.Participants
² Category 1 Category 2 Category 3 Category 4 1 0.83 [0; 0.08[ [0.08; 4.18[ [4.18; 41.82[ [41.82; 66.92] 2 1.04 [0; 0.10[ [0.10; 5.16[ [5.16; 51.58[ [51.58; 82.52] 3 1.14 [0; 0.11[ [0.11; 5.70[ [5.70; 57.03[ [57.03; 91.25] 4 0.98 [0; 0.10[ [0.10; 4.89[ [4.89; 48.87[ [48.87; 78.20] 5 1.17 [0; 0.11[ [0.11; 5.55[ [5.55; 55.47[ [55.47; 88.75] 6 1.10 [0; 0.11[ [0.11; 5.53[ [5.53; 55.34[ [55.34; 88.54]Table 5. Personalized variance categories for each participant
b. Performance of the method in the classification problem
Table 6 below shows time estimated in each activity category from MET values. The evaluations of time spent in each category by the function and Armband were compared.
f
(Armband
)
is the percentage of time that has been classified into the current category by the Armband andf
the percentage of time classified by the proposed algorithm.Category 1 Category 2 Category 3 Category 4 Participan
ts f(Armband) f f(Armband) f f(Armband) f f(Armband) f
1 75 % 75 % 17 % 19 % 8 % 6 % 0 % 0 % 2 80 % 81 % 16 % 13 % 6 % 6 % 0 % 0 % 3 86 % 84 % 10 % 12 % 4 % 3 % 0 % 0 % 4 54 % 57 % 41 % 39 % 5 % 3 % 0 % 0 % 5 86 % 81 % 10 % 12 % 4 % 7 % 0 % 0 % 6 92 % 90 % 8 % 8 % 0 % 1 % 0 % 0 %
Table 6. Comparative study of categories duration estimation
Category 1 Category 2 Category 3 Category 4 Participan
ts
f Armband f
e ( ) eff(Armband) eff(Armband) eff(Armband)
1 0 % 2 % 2 % 0 % 2 1 % 3 % 0 % 0 % 3 2 % 2 % 1 % 0 % 4 3 % 2 % 2 % 0 % 5 5 % 2 % 3 % 0 % 6 2 % 0 % 1 % 0 % Average: 2.17 % 1.83 % 1.50 % 0 %
Table 7. Deviation in classification
As stressed in Table 7, the difference of classification remains low especially for category 1 and category 4. eff(Armband) denotes the error in classification between the Armband sensor and the proposed algorithm. For example, the participant 2 spent 80% of time in category 1 according to the Armband and 81% of time according to the proposed algorithm. The worst deviations are expected for categories 1 and 3. The average deviation is about 2% for category 1, category 2 and category 3. Because more about 80% of time is spent in category 1, the average deviation of 2% is quite reasonable: the minimal deviation is expected for the most representative category.
c. Performance of the method in energy expenditure estimation
Table 8 gives the comparative study of TEE estimation in free-living conditions limited to working days. The results of the proposed approach are compared to the Armband estimation. The proposed approach taking into account only accelerometer values and with no information on the initial smartphone position, provides a global absolute deviation about 15% of the Armband..
As stressed in previous published articles, Armband performance in free-living conditions cannot be easily evaluated except with doubly-labeled water technique which is expensive and limited to long term evaluation (10-14 days). In these conditions, accuracy of the Armband has been evaluated about 8.6% in a previous study [14] which push us into considering that the deviation of 15% between the Armband estimation and f is an high quality result.
Participants Duration (minutes) f(Armband) (kCal.min-1) f (kCal.min-1) f Armband f e ( ) 1 610 1.79 1.52 15 % 2 611 1.87 1.61 14 % 3 360 1.89 1.60 15 % 4 380 1.22 1.39 14 % 5 720 1.48 1.69 14 % 6 540 1.24 1.49 19 %
Absolute average gap : 15.17 %
Table 8. Comparative study of EE estimation
d. Feedback mechanism
Cognitive process analysis pushes into considering that, monitoring behavior, receiving feedback, and reviewing relevant goals after obtaining feedback are central to self-management and behavioral control.
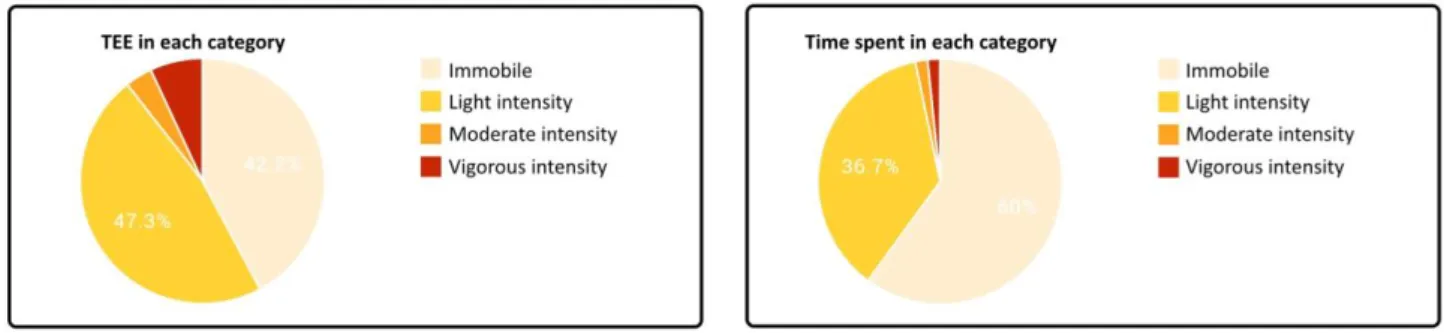
The TEE estimation by the smartphone we introduce, integrates these theoretical approaches providing user friendly interface representing goal and current state. Two main sights have been developed to represent TEE (in kcal) and time (%) spend in each activity category (C1, C2, C3 and C4) (Figure 2). The classification into activities was achieved on the smartphone according to the accelerometer values and variance.
Figure 2. Pie graphs: TEE and time spent in each activity category 5.
Concluding remarks
To evaluate the activities in free-living conditions, a dedicated smartphone based application was introduced. This application takes advantages of discrete techniques applied to low-energy mobile human activities recognition and provided a strongly high quality estimation of TEE. It provided estimation about 15% of the costly dedicated sensors Armband. Numerous studies utilize after-the-fact or generalized self-reports following engagement in light physical activities, or are limited to controlled experiments (i.e. where the natural environment and physical activity types are controlled in short-term studies) rather than everyday situations. The actual in-situ experience during real-life experiments and the truly personal service mechanism is clearly defined to in fine generated health benefits. This new function was first tested with a small well-defined population sample focusing on participants with high professional positions with office work and with an average of 25 years old. Our researcher is now directed on larger population to study the influence of age, BMI, physical activity level and new socio-economic categories.
Acknowledgements
Special thanks to the LIMOS researchers providing constant support and help specially for data collection.
References
[1] Pande A., Y. Zeng, A. K. Das, P. Mohapatra, S. Miyamoto, E. Seto, E. K. Henricson, and J. J. Han. Energy expenditure estimation with smartphone body sensors, in Proceedings of the 8th International Conference on Body Area Networks. ICST (Institute for Computer Sciences, Social-Informatics and Telecommunications Engineering), pp. 8-14. 2013.
[2] Duclos M., G. Fleury, R. Guidoux, P. Lacomme, N. Lamaudière, P.H. Manenq, L. Paris, L. Ren and S. Rousset. Use of Smartphone Accelerometers and Signal Energy for Estimating Energy Expenditure in Daily-Living Conditions, Current Biotechnology, Vol. 4. 2015.
[3] Khan A.M., Siddiqi M.H., Lee S.-W. Exploratory Data Analysis of Acceleration Signals to Select Light-Weight and Accurate Features for Real-Time Activity Recognition on Smartphones. Sensors, 13(10): 13099-13122, 2013. [4] Mellone S., Tacconi C., Lorenzo C. Validity of a Smartphone-based instrumented Timed Up and Go. Gait &
Posture. Vol. 36, pp 163–165. 2012.
[5] Klasnja P., Pratt W. Healthcare in the pocket: Mapping the space of mobile-phone health interventions. Journal of Biomedical Informatics. Vol. 45, pp. 184-198. 2012.
[6] Burki T. K. Diagnostic accuracy of smartphone applications. The Lancet Oncology. Vol. 14 (3), pp. e90. March. 2013.
[7] Jenny J-Y. Measurement of the knee flexion angle with a smartphone-application is precise and accurate. The Journal of Arthroplasty.Vol. 28, pp. 784-787. 2013.
[8] Datta A.K., Sumargo A., Jackson V., Dey P.P. CHOIS: An Application of Mobile Technology for Childhood Obesity Surveillance. Procedia Computer Science. Vol. 5. pp. 653–660. 2011.
[9] Guido G., Vitale A, Astarita V., Saccomanno F., Giofré V.P., Gallelli V. Estimation of safety performance measures from smartphone sensors. Procedia - Social and Behavioral Sciences. Vol. 54, pp. 1095 – 1103. 2012.
[10] Ainsworth BE, Haskell WL, Herrmann SD, Meckes N, Bassett DR Jr, Tudor-Locke C, Greer JL, Vezina J, Whitt-Glover MC and Leon AS: 2011 Compendium of Physical Activities: a second update of codes and MET values. Med Sci Sports Exerc 2011, Vol. 43(8), pp. 1575-81. 2011.
[11] Harris J.A., Benedict F.G. A biometric study of basal metabolism in man. In Carnegie Institute of Washington (http://archive.org/download/biometricstudyof00harruoft/biometricstudyof00harruoft.pdf). 1919.
[12] Guidoux R., Duclos M., Fleury G., Lacomme P., Lamaudière N., Manenq P-H., Paris L., Ren L., Rousset S. . A smartphone-driven methodology for estimating physical activities and energy expenditure in free living conditions. Journal of Biomedical Informatics.Vol. 52, pp.271-278. DOI: 10.1016/j.jbi.2014.07.009. 2014.
[13] Newton I.: Philosophiae Naturalis Principia Mathematica (First Ed.). Imprimatur Samuel Pepys, Regalis Societas praeses. London. 1687.
[14] Rousset S., Fardet A., Lacomme P. et al. Comparison of total energy expenditure assessed by two devices in
controlled and free-living conditions. European Journal of Sport Science. 2014.