THÈSE
Pour l'obtention du grade de
DOCTEUR DE L'UNIVERSITÉ DE POITIERS UFR des sciences fondamentales et appliquées
XLIM-SIC
(Diplôme National - Arrêté du 7 août 2006)
École doctorale : Sciences et ingénierie pour l'information, mathématiques - S2IM (Poitiers) Secteur de recherche : Traitemement du signal et des images
Présentée par :
Iana Iatsun
Understanding binocular perception for the estimation of visual fatigue, visual attention and quality of experience for
stereoscopic content
Directeur(s) de Thèse :
Christine Fernandez-Maloigne, Mohamed-Chaker Larabi Soutenue le 27 novembre 2014 devant le jury
Jury :
Président Fabrice Mériaudeau Professeur, Le2i-Lab, Université de Bourgogne, Dijon Rapporteur Fabrice Mériaudeau Professeur, Le2i-Lab, Université de Bourgogne, Dijon Rapporteur Faouzi Alaya Cheikh Professor, Gjøvik University College, Norway
Membre Christine Fernandez-Maloigne Professeur, XLIM, Université de Poitiers
Membre Mohamed-Chaker Larabi Maître de conférences, XLIM, Université de Poitiers Membre Patricia Ladret Maître de conférences, Polytech', Université de Grenoble Membre Jérôme Fournier Ingénieur de recherche, Orange-Lab, Cesson-Sévigné
Pour citer cette thèse :
Iana Iatsun. Understanding binocular perception for the estimation of visual fatigue, visual attention and quality of
experience for stereoscopic content [En ligne]. Thèse Traitemement du signal et des images. Poitiers : Université
Pour l’obtention du grade de
DOCTEUR DE L’UNIVERSITE DE POITIERS
Faculté des Sciences Fondamentales et Appliquées Diplôme National - Arrêté du 7 août 2006
ÉCOLE DOCTORALE SCIENCES POUR L’INGENIEUR
DOMAINE DE RECHERCHE : TRAITEMENT DU SIGNAL ET DES IMAGES Présentée par
Iana IATSUN
Understanding binocular perception for the estimation
of visual fatigue, visual attention and quality of
experience for S3D.
Directeurs de thèse : Mohamed-Chaker LARABI
Christine FERNANDEZ-MALOIGNE
Soutenue le 27 Novembre 2014 Devant la Commission d’Examen
JURY
Fabrice MERIAUDEAU Professeur, Le2i-Lab Rapporteur Faouzi Alaya CHEIKH Professeur, Gjøvik University College Rapporteur Jérôme FOURNIER Ingénieur de recherche, Orange-Lab Examinateur Patricia LADRET Maître de conférences, GIPSA-Lab Examinateur Mohamed-Chaker LARABI Maître de conférences, XLIM-SIC Directeur de thèse Christine FERNANDEZ-MALOIGNE Professeur, XLIM-SIC Directeur de thèse
The research work presented in this thesis could not have been done without the support and inspiration of several people.
First and foremost, I am very grateful to my supervisor Chaker Larabi, who guided me continuously through three years of my PhD studies. I highly appreciated his inspiration, enthusiasm, time and care. He has often been more than only a supervisor. I would like also to thank Christine Fernandez, who taught me to be stronger.
I would like to thank the reviewers of this thesis: Prof. Fabrice Meriaudeau from the University of Bourgogne, Prof. Faouzi Alaya Cheikh from Gjøvik University College, Jérôme Fournier from Orange Labs and Patricia Ladret from the Grenoble Institute of Technology. I highly appreciated their time and valuable feedback, provided for this thesis.
Last but not least, I would like to thank my parents from the bottom of my heart for their devotion to my success and confidence in me. Moreover, I would like to thank my husband, who has been a source of motivation and support for me during this time. Without my family, I could have never accomplished what I have done today.
List of Figures ix
List of Tables xv
General Introduction 1
1 Context and Objectives . . . 1
2 Contributions . . . 2
3 Organization of this thesis . . . 3
I Basic Aspects of Human Interaction with 3D Technology 5 1 Biological Organisation of Human Visual System . . . 5
1.1 The eye structure . . . 6
1.2 The retina . . . 7
1.3 The optic nerve: from the retina to visual cortex . . . 8
1.4 The visual cortex . . . 9
2 Basics of visual attention . . . 11
2.1 Visual attention theories . . . 11
2.2 Eye-movements and visual attention . . . 13
3 Computational visual attention models . . . 14
3.1 Koch and Ulman model . . . 15
3.2 Itti’s model . . . 17
3.3 Le Meur’s model . . . 19
Contents
3.5 PINS (Prediction of INterest points Saliency) . . . 22
3.6 S3D Saliency models . . . 22
4 Basic concepts of depth perception . . . 27
4.1 Pictorial depth cues . . . 28
4.2 Dynamic depth cues . . . 29
4.3 Ocular depth cues . . . 30
4.4 Stereoscopic cues . . . 31
4.5 Combination and integration of depth sources . . . 33
5 Principles of 3D imaging . . . 36
5.1 3D content production . . . 36
5.2 3D video representation . . . 40
5.3 3D visualization technologies . . . 44
6 Conclusion . . . 48
II On the estimation of disparity effect for color discrimination of S3D stimuli 51 1 Introduction to color discrimination with 3D . . . 51
2 Experiment design . . . 55 2.1 Experiment procedure . . . 55 2.2 Stimuli . . . 56 2.3 Subjects . . . 57 2.4 Apparatus . . . 57 2.5 Statistical tools . . . 60
3 Results analysis and discussion . . . 62
3.1 MANCOVA Analysis . . . 62
3.2 Effect of stereo-acuity on color discrimination . . . 63
3.3 Effect of disparity on color discrimination . . . 64
3.4 Color discrimination evaluation by color channel . . . 65
3.5 Effect of intensity on color discrimination . . . 65
4 Conclusion . . . 68
III Evaluation and modeling of visual fatigue induced by watching S3D 71 1 State-of-the-art: human factors and 3D content . . . 71
1.1 Causes of visual discomfort/fatigue caused by watching 3D . . . 71
1.1.1 Excessive Screen Disparity . . . 72
1.1.3 Zone of comfortable viewing . . . 74
1.1.4 Stereoscopic impairments . . . 74
1.1.5 Other causes of visual fatigue . . . 75
1.1.6 Discussions . . . 76
1.2 Review of measurement methodologies for visual fatigue . . . 76
1.2.1 Questionnaires . . . 77
1.2.2 Accommodation response . . . 77
1.2.3 Fusional amplitude . . . 78
1.2.4 Eye-blinking . . . 79
1.2.5 Eye - movement analysis . . . 79
1.2.6 Brain activity . . . 80
1.3 Discussions . . . 81
2 Our work on visual fatigue estimation . . . 82
2.1 Experimental set-up . . . 83 2.1.1 Design . . . 83 2.1.2 Stimuli . . . 83 2.1.3 Apparatus . . . 83 2.1.4 Participants . . . 84 2.1.5 Procedure . . . 85 2.1.6 Assessment method . . . 86 2.2 Experimental results . . . 86
2.2.1 Results of self-evaluation of visual fatigue . . . 86
2.2.2 Results of pupil diameter analysis . . . 90
2.2.3 Results of eye-movement analysis . . . 90
2.2.4 Changes of blinking . . . 93
2.3 Comparison of 2D and S3D watching . . . 95
3 Modeling of visual fatigue accumulation process caused by watching 3D . . . 96
3.1 Influence of motion on S3D visual perception . . . 97
3.2 Semantic impact on visual fatigue accumulation . . . 100
3.3 Depth effect on visual fatigue . . . 101
3.3.1 The frame correlation . . . 102
3.3.2 Disparity range . . . 102
3.3.3 Disparity changes . . . 102
3.4 Visual Fatigue Prediction Model . . . 104
Contents
IV Visual attention modeling for Stereoscopic 3D content 109
1 Proposed spatio-temporal modeling of visual attention for S3D . . . 110
1.1 Spatial features . . . 112
1.2 Temporal features . . . 114
1.3 Depth features . . . 116
1.3.1 Overview of monocular depth estimation algorithms . . . 116
1.3.2 Salient depth features . . . 119
1.4 Fusion strategies . . . 123
2 Investigation of visual attention for stereoscopic content by psycho-visual exper-iments . . . 126
2.1 Subjective experiment for stereoscopic images . . . 128
2.2 Psycho-visual experiment for stereoscopic video sequences . . . 128
2.3 Processing of the eye-tracking results . . . 130
2.4 Qualitative evaluation metrics . . . 133
3 Visual attention prediction for stereoscopic images . . . 136
3.1 Performance evaluation of saliency prediction for stereoscopic images . . 136
3.2 Feature analysis . . . 138
3.2.1 Monocular V S binocular depth cues for still images . . . . 140
3.2.2 Added value of depth information . . . 143
4 Visual attention prediction for stereoscopic video sequences . . . 143
4.1 Performance of visual attention prediction for dynamic content . . . 143
4.2 Robustness of the proposed visual attention prediction . . . 151
4.3 Comparison between monocular and binocular sources of depth . . . 155
5 Conclusion . . . 156
V Stereoscopic 3D quality assessment 159 1 Introduction to objective image quality assessment . . . 160
1.1 Performance evaluation of objective quality metrics . . . 162
2 Quality assessment for stereoscopic images . . . 164
2.1 3D quality metrics based on 2D quality algorithms . . . 164
2.2 Stereoscopic metrics . . . 165
2.3 Discussion . . . 170
3 Proposed quality assessment metric for stereoscopic images . . . 171
3.1 Algorithm of the proposed quality metric . . . 173
4 Conclusion . . . 178
General conclusion and perspectives 181
List of Authors’s Publications 185
I.1 Neuro-optical model. . . 6
I.2 Anatomy of the eye [1]. . . 6
I.3 Organization of the retina; a - structure of the neural levels, b - distribution of rodes and cones. . . 7
I.4 From the retina to visual cortex [1]. . . 9
I.5 Organisation of the visual cortex and its areas: a - Position of the areas of the visual cortex in the brain [2]; b - Flowchart of connections between visual areas. 10
I.6 Example of stimulus for target search of the FIT theory. (a) - target is a horizontal bar among the vertical, it is an example of feature search; (b) -target is a horizontal blue bar, but the bar is the same orientation as yellow bars and same color as vertical bars, it is an example of conjunction search. . 12
I.7 Example of feature maps for color, orientation and size, and their integration into saliency map according to Guided Search model [3]. . . 13
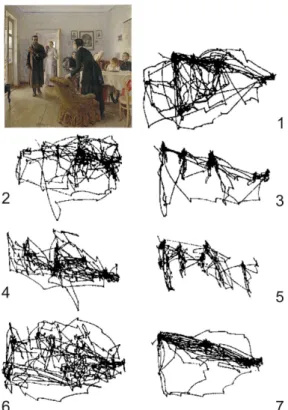
I.8 Influence of task on eye-movement. The experiment has been conducted on the painting "Unexpected Return" of Ilya Repin. The trajectory of eye move-ments is depending on the task: 1) free examination; 2) estimate the financial situation of the family; 3) give the ages of the people; 4) suggest what family has been doing before the arrival of unexpected visitor; 5) name the clothes of the people; 6) remember the position of people and objects in the room; 7) estimate how long visitor has been away from family [4]. . . 15
I.9 Flowchart of the model proposed by Koch and Ullman [5]. . . 16
Contents
I.11 Flowchart of the model proposed by Le Meur et al. [7]. . . 19
I.12 Flowchart of the model proposed by Achanta et al.[8] . . . 21
I.13 Flowchart of the model PINS [9]. . . 22
I.14 Frames with overlaid heat-maps from video-sequences used in subjective test, 2D is on the left, 3D - on the right [10]. . . 23
I.15 Flowchart of the saliency prediction proposed by Maki et al. [11]. . . 24
I.16 Flowchart of the saliency prediction proposed by Ouerhani et al. [12]. . . 24
I.17 Flowchart of the saliency prediction proposed by Zhang et al. [13]. . . 25
I.18 Flowchart of the computational saliency model for images proposed by Wang et al [14]. . . 26
I.19 Procedure of saliency energy measurement proposed by Kim et al. [15]. . . 26
I.20 Classification of depth information sources. . . 27
I.21 Schematic example of pictorial sources of depth (perspective, occlusion, blur, relative size, familiar size, texture gradient) . . . 28
I.22 Photographs illustrating monocular depth cues in a real image. . . 30
I.23 Example of motion depth cues (picture from the train window); motion vectors are represented by red arrow; close objects move faster, than far away ones. . 31
I.24 Accommodation and vergence processes at near and far distance. When eyes fix on the far point after near one, eyes move outward, and vice versa. . . 32
I.25 Binocular visual field. . . 33
I.26 Horopter and Panum’s Fusional zone [16]. . . 33
I.27 Illustration of binocular disparity perception. F is a fixation point on the horopter, D is the point with crossed disparity and C is the point of uncrossed disparity. . . 34
I.28 Sensitivity (depth contrast) as a function of the logarithm of the distance from observer, from 0.5 to 10 000 m, for nine different depth cues [17]. . . 34
I.29 Example of configuration for stereoscopic capture: left - parallel, right - con-verged (toed-in) camera. . . 38
I.30 Configuration of the ZCam camera [18]. . . 39
I.31 Example of camera system for multi-view capture, top - schema of multi-view configuration, bottom - 100-cameras multi-view capturing system [19]. . . 40
I.32 Spatial interleaving for 3D stereo formats . . . 41
I.33 Frame of the video sequence and associated depth map. . . 42
I.34 Illustration of the multi-view video format [20]. . . 42
I.36 Illustration of depth enhanced stereo format [22]. . . 44
II.1 Example of stimulus used by Anstis et al. [23]. . . 52
II.2 Stimulus used to investigate the effect of stereo disparity on color constancy. Left and right views of the stereo-pair with disparity [24]. . . 52
II.3 Stimulus scene from the experiment of Bei Xiao et al. [25]. . . 53
II.4 Stimulus scene from the experiment of Werner [26]. . . 53
II.5 Illustration of stimulus from the experiment of Ling and Hurlbert [27]. . . 54
II.6 Illustration of the used stimuli (Grey with 3D out in this case; Anaglyph is used only for illustration purpose). . . 57
II.7 a - Schematic presentation of screen parallax, b - Schematic presentation of angular parallax. . . 58
II.8 Geometry for visual angle calculation. . . 60
II.9 Illustration of the used questionnaire. . . 61
II.10 Stereo acuity measurement tools in both sites a Randottest in Poitiers; b -Capture-generated application in Milan. . . 63
II.11 Correct evaluation of depth direction: 3D-OUT, 2D, 3D-IN. −12 corresponds to disparity value −12 ≈ −9.1 arc min, +12 ≈ 9.1 arc min, −6 ≈ −4.5 arc min, +6 ≈ 4.5 arc min, 0 - 2D. . . . 66
II.12 Ratio of not discriminated stimuli in 2D with a zero-disparity. . . 67
II.13 Ratio of not discriminated stimuli in 3D with a negative disparity of ≈ −9.1 arc min. . . 67
II.14 Ratio of not discriminated stimuli in 3D with a positive disparity of ≈ +9.1 arc min. . . 68
II.15 Average perception of intensity change of stimuli. . . 69
III.1 Illustration of natural and stereoscopic perception [28]. . . 72
III.2 Vergence and accommodation process on 3D and 2D displays, a - positive disparity, b - negative disparity, c - 2D display or natural object, R - interocular distance [28]. . . 73
III.3 a - Example of EEG procedure. b - Brain topography of electroencephalogram activity [29]. The red color stands for high activity and the blue color - low activity; last row depicts the difference between pre- and post-values. The considerable differences are marked by the red-shaded areas; no significant differences - by blue-shaded areas. . . 80
Contents
III.5 Apparatus of the experimental setup. . . 85
III.6 Procedure of the experiment, Q: questionnaire, Video: test sequence. . . 85
III.7 Results of questionnaires for evaluation of visual fatigue from 2D and S3D watching. . . 87
III.8 Self-evaluation results of visual fatigue symptoms after watching 2D and S3D ( a - eye strain, b - eye irritation, c - general discomfort, d - difficulty to concentrate, e - fullness of head, f - difficulty to focus). . . . 88
III.9 Change of pupil diameter and average luminance (red dots - normalized be-havior of pupil diameter, blue line - normalized value of average luminance)
(a, b) - right and left eyes for sequence "Clash of the Titans"; (c, d) - right
and left eyes for sequence "Chronicles of Narnia". . . . 91
III.10 Characteristics of fixation for all participants dependent on time for S3D (a,
c) and 2D (b, d), averaged by median filter. Top - fixation duration, bottom
- fixation number, dash-line - maximum value, point-line - minimum value. . . 92
III.11 Characteristics of saccades for all participants dependent on time for S3D (a,
c) and 2D (b, d), averaged by median filter. Top - saccade duration, bottom
- saccade number, dash-line - maximum value, point-line - minimum value. . . 93
III.12 Behavior of blinking rate during watching test-sequences for all participants dependent on time for 2D (b, d) and S3D (a, c), averaged by median filter. Top - blink duration, bottom - blink number, dash-line - maximum value, point-line - minimum value. . . 95
III.13 Example of disparity change for Video 1 (a) and Video 2 (b) from frame 5000 to frame 6000 (arbitrary chosen). . . 105
III.14 Visual fatigue prediction, red line - visual fatigue prediction depending only on time (equation III.1), blue dots - visual fatigue prediction based on video characteristics and initial fatigue (equation III.6). . . 107
IV.1 Flowchart of the proposed saliency model for stereoscopic 3D content. . . 111
IV.2 Examples of obtained spatial saliency maps: (top) - stereo-pair presented using the anaglyph method; (bottom) - spatial saliency map overlaid stereo-pair in anaglyph. Images were polarized side-by-side, anaglyph is used here only for illustration. . . 113
IV.3 Examples of motion compensation algorithm results for video sequence ”Sport”.
IV.4 Examples of obtained temporal saliency maps. 1st and 3rd rows - stereo-pairs
presented with anaglyph, 2nd and 4th rows - temporal saliency map overlaid
stereo-pair in anaglyph. Images were polarized side-by-side, anaglyph is used
just for illustration. . . 116
IV.5 Example of ground truth depth annotation from BSDS500 database: (top) -original images, (bottom) - ground truth depth contours. . . 117
IV.6 a - Schematic illustration of T-junction, b - Red circles represent T-junction points that should be evaluated when measuring the similarity between S1 and S2 [30]. . . 121
IV.7 Examples of depth map obtained using occlusion cues. . . 122
IV.8 Architecture of a standard back-propagation artificial neural network. . . 125
IV.9 Environment during the subjective test. . . 127
IV.10 a - Installation of eye-tracker Tobii TX-120, b - Example of calibration grid. . 127
IV.11 Representative frames from video sequences with scene-cuts. . . 129
IV.12 Visual field of the fovea. . . 131
IV.13 Geometry of the visual angle. . . 131
IV.14 Example of ground truth attention maps for still images: (top) - original images presented in anaglyph method (the images were side-by-side polarized, anaglyph is only used for illustration here), (bottom) - ground truth saliency maps. . . 132
IV.15 Example of frames and correspondent ground truth saliency maps for the frames of video sequences. First row - the frames from video sequence ”Children”, third row - the frames from sequence ”Aliens” (the clips were stereo, anaglyph is only used for illustration here). . . 133
IV.16 Illustration of AUC computation. . . . 136
IV.17 Visual results of saliency evaluation for various methods. The results are given for the stereo pair "Dolls". . . . 139
IV.18 Example of disparity map obtained according to algorithm [31]. (a) - stereo-pair, (b) - disparity map. . . . 140
IV.19 Visual results of saliency prediction model with binocular depth information. The depth conspicuity map got from ground truth disparity map; and the depth conspicuity map got with help of the algorithm [31]. The visual results are given for the stereo pair "Moebius". . . . 142
IV.20 Contribution of depth information on 2D models. The results are given for the stereo pair "Art". . . . 144
Contents
IV.21 Visual results of saliency model detection by various methods. The results are
given for the 16th stereo frame from video sequence"Ballons". . . . 149
IV.22 Visual results of saliency model detection by various methods. The results are given for the 186th stereo frame from video sequence"Poznan Hall". . . . 150
IV.23 Frames and experimental fixation maps around a scene cut. Scene cut happens after 2nd image. It is noticeable, that directly after scene cut viewers tend to maintain their gaze on the same position as before the change. Interval is 5 frames. . . 152
IV.24 Visual results of saliency model detection by various methods for HD video sequence with scene cuts. The results are given for the 144th stereo frame of the video sequence"Alice". . . . 153
IV.25 Visual results of saliency model detection by various methods for HD video sequence with scene cuts. The results are given for the 139th stereo frame of the video sequence"Hunting". . . . 154
IV.26 Visual results of the proposed saliency model for video content. First row -the depth information is obtained from monocular cues, -the second row - -the depth is got by the binocular cues with using the calculated disparity map by algorithm [31]. . . 155
V.1 Perceived quality estimation based on two stereoscopic images. . . 164
V.2 3D "Visual experience" model proposed by Seuntiens [32]. . . 171
V.3 Flowchart of the proposed quality metric for 3D images. . . 173
V.4 Explanation of the saliency map projection. Only few interest points are de-tected for visibility. . . 174
V.5 Example of created mask for stereo-pair . . . 175
I.1 Sorting the sources of depth information depending on the area under their curve. Number corresponds to its rank in perception, ∗ means sharing position
[17]. . . 35
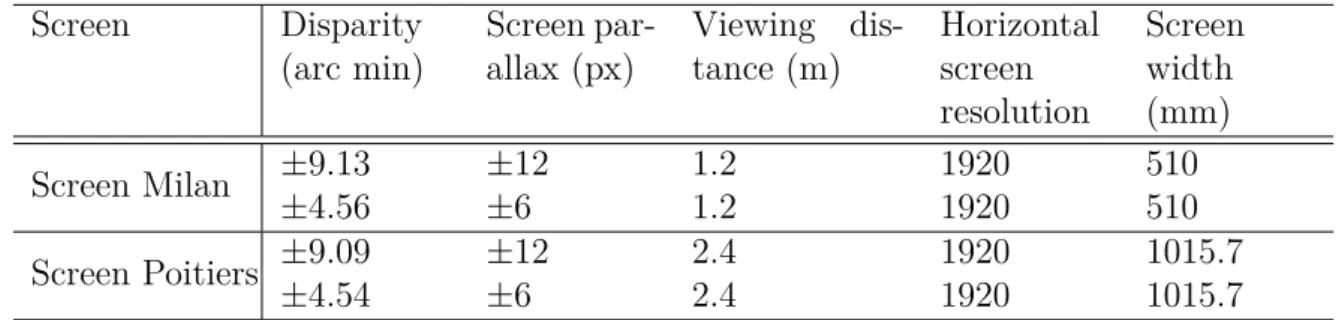
II.1 Setup parameters of Milan and Poitiers experiments. . . 59
II.2 Size of stimuli in visual angle . . . 60
II.3 MANCOVA results for depth magnitude evaluation. . . 62
II.4 MANCOVA results for patch discrimination. . . 62
II.5 ANOVA results of stereo-acuity versus patch discrimination and depth mag-nitude. . . 64
III.1 Results of Pearson correlation analysis between visual fatigue and its symptoms. 89 III.2 Results of statistical analysis of eye-movement for content and for time . . . . 94
III.3 Correlation between visual characteristics for watching 2D and S3D content. . 96
III.4 Quantization thresholds of the standard deviation of motion vectors. . . 98
III.5 ANOVA results of motion activity with regarding to selected data from psy-chophysical experiment . . . 99
III.6 Average motion activity for tested video sequences. . . 99
III.7 ANOVA results of semantic load with regarding to selected data from psy-chophysical experiment. . . 101
III.8 ANOVA results of disparity range with regarding to selected data from psy-chophysical experiment. . . 103
Contents
III.9 ANOVA results of disparity changes with regarding to selected data from psy-chophysical experiment . . . 104
III.10 General trends of disparity changes for tested video-sequences. . . 105
IV.1 Performance evaluation of proposed saliency model on the experimental image dataset. (Perfect prediction case: KLD→0, AUC →1, CC → ±1). . . . 138
IV.2 Performance evaluation of saliency model using different sources of depth in-formation. (Perfect prediction case: KLD→0, AUC →1, CC →±1). . . . 141
IV.3 Evaluation of added value of depth information. The fusion of monocular depth saliency map with state-of-the-art 2D saliency models. (Perfect predic-tion case: KLD→0, AUC →1, CC →±1). . . . 145
IV.4 Performance evaluation of proposed saliency model on experimental video dataset without the scene-cuts. ∗ stands for the results, obtained from 30% of frames, since other 70% were used for training. (Perfect prediction case:
KLD→0, AUC →1, CC → ±1). . . . 146
IV.5 Evaluation of the proposed saliency model for a set of sequences without scene cuts. (Perfect prediction: KLD → 0, AUC → 1, CC → ± 1) . . . . 147
IV.6 Evaluation of the proposed saliency model for a set of sequences with a scene cuts. (Perfect prediction: KLD → 0, AUC → 1, CC → ± 1) . . . . 148
IV.7 Performance evaluation of saliency model using different sources of depth in-formation. (Perfect prediction case: KLD→0, AUC →1, CC →±1). . . . 155
V.1 Performance of 3D IQA algorithms overall on the database 3D LIVE IIphase 176
V.2 Performance of 3D IQA algorithms on on images with the JPEG distortion . . 177
V.3 Performance of 3D IQA algorithms on images with the JPEG2000 distortion . 177
V.4 Performance of 3D IQA algorithms on images with the white noise distortion 178
V.5 Performance of 3D IQA algorithms on images with the blur distortion . . . . 178
1 Context and Objectives
Human visual system accomplishes complex tasks of visual perception and understanding the surrounding environment. It performs the dissociation of the foreground from the background, objects recognition and spatial information processing. The binocular vision is one of its key features. It is ensured by the coordinated work of both eyes. Due to the interocular distance (≈ 6.5 cm ), each eye perceives the world from a slightly different perspective. These differences, called disparity, are used by the brain to reconstruct depth, and evaluate the distance to objects. Numerous trials have been made to reproduce the stereoscopic effect. One of the first attempts has been done by Euclid in the early 280 B.C., who described depth reconstruction from two similar images of the same object. However, the principal progress in stereoscopy happened with the advent of photography. In 1838, Charles Wheatstone designed a stereoscope, that separates the left and right views by a mirror system. This idea continues to be the principle of some modern systems. The next important step was the first 3D movie in anaglyph made by Porter and Waddell in 1915. Later, first polarizing sheets have been invented by Land in 1932, that started the period of the polarization separation approach. Nevertheless, the technical problems with the presentation of early 3D movies and viewer’s visual discomfort decreased their popularity in 1950’s.
The recent progress of digital electronics promoted a new interest to 3D imaging. The numeric evolution contributes to each stage of the 3D film industry, developing new acquisition systems, editing approach, projection methods and distribution. The most considerable push is noted in movie production, where more and more 3D films are presented to public each year. The example is the outstanding success of the ”AV AT AR” movie in 2009, directed by James
General introduction
Cameron. The next expected step is the 3D television (3D-TV). Although, this transition to 3D-TV is possible, ensuring high quality content and user’s visual comfort is still an open issue. The entertainment industry is proposing more and more attractions, like 3D cinema or 3D reality video games. Besides, 3D also occupies progressively an important place in industry for purpose like, simulation for driver/pilot learning, vehicle guiding, surgery conducting, simula-tion processes, etc. Thereby, the number of people who have access to 3D content increases significantly. However, many questions about human 3D perception have not been answered yet.
This thesis aims at the investigation of binocular perception of 3D content. The process of visual fatigue accumulation during watching stereoscopic 3D (S3D) is explored in comparison to viewing conventional 2D videos. Our work is focused on cases with long duration watching in order to be as close as possible to real-life conditions. An important part of the thesis is dedicated to the study of visual attention for 3D content. The extraction of image saliency is a significant step toward the improvement of 3D image processing algorithms like compression, quality metrics and so on. Our proposal relies on monocular cues in order to extract salient areas from the stereo-pair. Finally, our findings help in the development of a quality metric for stereoscopic 3D images, considering features of binocular perception. Altogether, in this thesis we aim at mimicking the binocular perception regarding various aspects of S3D watching.
2 Contributions
In this thesis, the investigation of the human binocular perception has been done from several perspectives. The examination of visual discomfort appearing during watching 3D content starts from psycho-visual experiments using an eye-tracker. Conducted subjective experiments allowed to examine the changes of visual characteristics during a long period. The obtained information permits to establish the link between visual fatigue and eye functions. At the next step, we demonstrated the relations existing between video features and human perception. Our first contribution concerns the prediction of visual fatigue accumulation by using image features such as motion, disparity, ... linked to the used content.
As known, one of the main advantages of binocular vision is a depth perception, where disparity is accepted to be a primary stimulus. With the aim to understand the role of disparity in color perception, we run in collaboration with the university of Milan an exploratory study. In the context of this specific study, the observed results demonstrated a minor role of disparity
in color discrimination of a simple stimulus, highlighting the importance of a monocular cues in depth perception.
Since a huge stream of visual information enters human’s eyes every second, the brain operates a clever mechanism to process this data in real time. This selective approach defines that the image is not perceived uniformly, some regions are seen in details, while others are ignored. This locus of interest is called visual attention. In this thesis, we propose and design an algorithm to predict saliency for 3D still and moving images. The created visual attention model benefits from the similarity between interest points and gaze points, and depth information is supplied by the monocular sources. Thus, the salient area can be predicted using only one view of stereo-pair. This important particularity of our model is of a big interest for asymmetric processing especially for the purposes of transmission and compression.
Image quality assessment is a mandatory stage for any image-based algorithm. The last part of our work tackles this problem by proposing a quality metric for stereoscopic images relying on our previous findings in addition to properties of binocular perception such as binocular fusion/rivalry.
3 Organization of this thesis
This dissertation is organized in five chapters and presents the modeling of binocular perception from several points of view.
– The first chapter introduces the main aspects of the human interaction with 3D technolo-gies. We briefly present the essential information, important for further understanding of research topics presented in this thesis. Therefore, we give an introduction to the human visual system (HVS), and its main features related to visual attention and depth per-ception. It gives the state-of-the-art in visual attention modeling, highlighting only few existing models for 3D content. It finishes with describing the main technologies for 3D creation and visualization.
– The second chapter reports the exploratory investigation about the impact of disparity on color perception. It reviews the existing exploratory studies for color discrimination in 3D. Next, we introduce the conducted experiment and applied statistical analysis. This chapter concludes by a demonstration the role of monocular and binocular indices in color discrimination.
General introduction
– The third chapter is related to the process of visual fatigue/discomfort caused by watching 3D content. Firstly, we indicate the principal causes of visual discomfort and existing assessment trials. In order to solve the drawbacks of present approaches, we propose to conduct a long-time watching psycho-visual experiment by using eye-tracking technology. Obtained results allow to establish links between visual characteristics and visual fatigue. In order to formalize the accumulation of visual fatigue, the next part explores some selected video features and their changes. This information is used to propose a model for visual fatigue accumulation process from watching stereo content.
– The fourth chapter focuses on spatio-temporal modeling of visual attention for stereo-scopic content. The feature maps for three perceptual dimensions are considered to be the pillars of the model. The main particularity of the proposed model lies in using monocular depth cues for the detection of depth saliency features. In this chapter, we present in details the extraction of visual salient features for spatial, temporal and depth dimensions. Next, we describe several fusion approaches in order to achieve the best combination of feature maps. We present the conducted eye-tracking experiments and procedure of constructing the ground-truth information necessary for the evaluation of the proposed model. Further in this chapter, we give the performance of the proposed model in comparison to gaze maps.
– The fifth chapter is dedicated to 3D image quality assessment. It provides a brief state-of-the-art of the field of 3D image quality assessment. In this chapter, we propose to validate our saliency model by using it for the development of a new 3D quality assessment metric relying on the principle of binocular fusion. This chapter explains the algorithm of 3D quality metric, based on the assessment of the quality difference between left and right views and fusion/rivalry mechanism. Next, we present metric’s performance, that is close to subjective judgments.
– This dissertation finishes with general conclusions over conducted work and gives some openings and perspectives for future work.
Basic Aspects of Human Interaction with 3D
Technology
Human visual system (HV S) is a complex mechanism that involves coordinated work of numer-ous components of the brain, nerves and eyes. This complicated structure ensures the ability of the organism to process the visual details. Following the goal of the present work, in this chapter we present the basic concepts of human vision, with a stress on binocular color vision. Since mimicking visual perception has been already tackled in literature, we introduce here already existing principles and approaches of visual attention modeling. We present the most known and accepted works on 2D saliency detection and an overview of existing models for 3D content. So far, only few algorithms for 3D visual attention have been designed. Thereby, the comprehension of HVS features help to identify the challenges and problems of 3D technology, that we briefly present at the end of this chapter.
1 Biological Organisation of Human Visual System
The nervous system is able to accomplish tasks of processing visual details thanks to its orga-nization, i.e. eyes, nervous path and brain. The function of the eyes is mainly based on the capture of images on the light-sensitive layer, the retina. The information falling on the retina is transformed into electrical impulses. These signals are transmitted by the neural path to the visual cortex to be processed. The aim of this part is to explain briefly the process of human vision. Since the structure of the HVS has been described in numerous biological and neuro-physiological studies [33, 34], only the main optical concepts, necessary for the comprehension of the development of the thesis, are discussed here. Our description will be given following the neuro-optical model, presented in the FigureI.1
Chapter I. Basic Aspects of Human Interaction with 3D Technology
Figure I.1 – Neuro-optical model.
1.1 The eye structure
Figure I.2 –Anatomy of the eye [1].
The optical components of the human eye are presented on Figure I.2. Visual perception begins when the eye focuses on certain locus in the space and light enters into it. The light starts its way through the conjunctiva. It is a thin transparent film that covers the front of the eye. After, light arrives to the following optical components: the cornea, the aqueous humour, the pupil, the lens, and, lastly, the vitreous humour. The cornea and lens help for the focus. The cornea is the transparent, slightly convex outer surface at the center of the eye. The cornea does not have any blood vessels, so it feeds from the fluid behind and in front of it. The liquid behind the cornea is the aqueous humour. The cornea is linked with the sclera, which forms the solid side of the eyeball. Sclera is attached to the ocular muscles, that give the opportunity to the eyeball to move. The choroid lies between the sclera and the retina, a richly vascularized layer that delivers nutrients to the iris and the retina. It contains many dark pigments. The iris controls the amount of light entering the eye. The aqueous and the vitreous humour project the direction of entering light into the correct place on the retina [1].
(a) (b)
Figure I.3 – Organization of the retina; a - structure of the neural levels, b - distribution of rodes and
cones.
1.2 The retina
The retina is a thin neural layer, that is located along the back of the eye. The transduction of the light energy into neural takes place in the retina thanks to the different photoreceptors. The retina is essentially transparent and its thickness is only 250 microns. It has five layers of neurons: photoreceptors, horizontal cells, bipolar cells, amacrine cells and ganglion cells as shown on Figure I.3a. The rays of the light pass through all five layers, before being treated by the photoreceptors [35].
The photoreceptors convert the light into electrochemical signals. They are divided into
two types, rods and cones, named for their shape. Rod cells are responsible for night vision, and respond well to dim light. Rods are found mostly in the peripheral regions of the retina. Cone cells are concentrated in a central region of the retina called the fovea; they are responsible for high acuity tasks and color vision.
The bipolar cells are connected to photoreceptors and one ganglion cell. They receive one
synaptic connection with a photoreceptor at the center of fovea and thousands at the peripheral part of retina. The signals are transmitted to the bipolar cells as potentials, that can have either depolarized or hyperpolarized state. There are two types of bipolar cells, depending on how they react to light on the center of their receptive fields: ON-center or OFF-center. If light fallen to the center of a receptive field has an excitatory effect on that cell, making it depolarized, it is an ON-center cell. A ray of light that goes on the surround, will have the opposite effect on
Chapter I. Basic Aspects of Human Interaction with 3D Technology
such cell, hyperpolarizing it.
The horizontal cells are linked to many cones, rods, and bipolar cells. Their main role
is to inhibit the activity of neighboring cells. The activation of horizontal cells is lateral, and characterized by the selective suppression of nerve signals. This principle helps to improve the acuity of sensory signals. The horizontal cells guarantee that only signals from well-lit photoreceptors arrive to the ganglion cells, so improving the contrast and precision of the visual stimulus.
The amacrine cells connect the ganglion cells and bipolar cells by providing alternative
path between them. Amacrine cells seem to have many functions, although a lot of them are not enough investigated.
The ganglion cells send out the neural signals as the action potentials. These potentials
are generated spontaneously; and their discharged frequency is increased or decreased by the appearance of light on their receptive fields. The ganglion cells axons form the optic nerve and thereby transmit information from the retina to the visual cortex. Most ganglion cells have either ON-center and OFF-surround receptive fields or the reverse. Three types of ganglion cells can be distinguished: small parvocellular ganglion cells (P-type), large magnocellular
(M-type) and koniocellular (K-(M-type). M-type ganglion cells have large receptive fields, propagate
fast action potentials in the optic nerve, and are more sensitive to low-contrast stimuli in comparison to P-type. The positive answer of M -cell to a light consists of a brief fire of action potentials. According to some studies [36, 37], M -cells are particularly involved in movement detection in a stimulus. P-type cells are sensitive to differences in the wavelengths of light. They are mostly "single color opponent cells", it means that the reaction to a given wavelength at the center of their receptive fields is inhibited by the response to another wavelength in the surround. The response of P-cells is tonic and lasts as long as the stimulus is active. P-cells, with their small receptive fields, are sensitive to shapes and details of the stimulus. K-type cells are not well explored, although it is known that they are responsible for the transmission of the chromatic color information [38].
1.3 The optic nerve: from the retina to visual cortex
The information from the left and right eyes passes via the ganglion cells, arrives to the lateral geniculate nucleus (LGN) and after to the visual cortex. Other part of the information goes to the superior coliculus.
The left and right LGNs are organized into six cell layers. The distribution of the LGN’s neurons suggests the possibility that part of the information from retina can be treated
sep-Figure I.4 – From the retina to visual cortex [1].
arately. It is assumed that LGN separates retinal inputs into parallel streams. One contains color and fine structure, and the other has motion and contrast. As it is observed from Figure
I.4, the left LGN processes visual signals from the right visual field and vice versa. It gets axons from the right hemi-field of the left and right retinas. Thus, as it is shown on Figure I.4
there is a cross-over of information at the optic chiasm.
Similarly to ganglion cells, two ventral layers have the name of magnocellular (M ) layers, and the four others are called parvocellular (P). It was shown experimentally, that 1st and 2nd LGN’s layers contain larger neurones than the dorsal layers. The small neurons that form the koniocellular layers on the ventral side of LGN layers receive connections from K-type ganglion cells in the retina. Interestingly to note that a big part (around 80%) of excitatory impulses come to LGN from the visual cortex and not from retina. This shows that LGN has a more significant role in visual perception, instead of just transmitting information from the retina to visual cortex.
1.4 The visual cortex
Nowadays, more than 30 different cortical areas participating to visual perception have been discovered. The primary (V1 ) and secondary (V2 ) areas are surrounded by multiple associative visual areas (V3, V4, V5 ) as shown on Figure I.5.
Chapter I. Basic Aspects of Human Interaction with 3D Technology
a b
Figure I.5–Organisation of the visual cortex and its areas: a - Position of the areas of the visual cortex
in the brain [2]; b - Flowchart of connections between visual areas.
visual cortex, located at the back of the brain. The organisation of cells in V1 allows the visual system to evaluate the position of objects. V1 cells reference point-to-point to the retina cells. For instance, the central locus in the retina corresponds to the central area in the cortex. Such organisation allows to project objects into two dimensions, similarly to visual world, vertically and horizontally. Depth, the third dimension, is obtained by comparing the information from both eyes. The signals are treated by special cells called ocular dominance columns. It is similar to a checkerboard pattern of connections alternating between the left and right eyes. The distance between eyes (interocular distance), creates the possibility to see the object from slightly different positions. This displacement is used to calculate object’s position in depth. It is important to note that this columnar organization of V1 is vague at the birth and well-defined columns are appearing with visual experience. V1 is also ordered by the orientation, cells in these stacks let V1 to detect borders of objects.
The ability of visual recognition starts at the primary visual cortex. The cells of V2 are responsible for color interpretation and constancy. V2 compares an object and its associated am-bient illumination, and can extract the illumination color. However, this process may strongly depend on viewer’s expectation. Moreover, vision as a high-order process is strongly influenced by what the viewer expects to see based on previous experiences. This property concerns color and form perception in V3 and V4, spatial and motion information in the parietal lobe, object and face recognition in the inferior temporal lobe. This learning process allows human to see and react fast in the real world [39].
2 Basics of visual attention
Over more than a century, scientists used the definition of W.James to speak about attention:
"Everyone knows what attention is. It is the taking possession by the mind in clear and vivid form, of one out of what seem several simultaneously possible objects or trains of thought. It implies withdrawal from some things in order to deal effectively with others." [40]. More
technically speaking, attention is a notion of overall organisation of selective mechanisms. Rich stream of visual information is entering the eye (108 - 109bits per sec) [41], but
pos-sibility to treat this data is limited. Therefore, the human visual system masters selective algorithms, that allow to reduce the amount of information while saving the most important. As it was presented before, the most part of incoming information processing occurs on the retina and the brain. Accurate vision is not ensured on the overall retinal layer, but on the fovea. If the object is presented as a point of interest to a viewer, the latter moves his eyes in order to perceive it clearly. This type of attention is referred to as overt orienting. The alternative attention process of mental focusing is called covert attention.
2.1 Visual attention theories
The concept of visual attention cues was firstly introduced by Neisser in [42]. It was followed by the Feature Integration Theory of Treisman and Gelade, that was later changed by Wolfe under the name of Guided search model. These theories focus on the decomposition of the scene into simple elements, but highlighting the significance of their combination. Their goal was not to predict eye-movements, but explain the processing of the different visual indices.
Feature Integration Theory (FIT) promoted the idea that perception is started by a
"preattentive" phase. It means that visual features are recorded and memorized effortlessly before really watching. This stage is a vision without limit, when all details of the visual field can be processed in parallel. This process is unconscious and happens early in perception. The "preattentive" features are color, orientation, curvature, size, shape and motion, etc. The next step of the process is the combination of features in order to perceive the whole scene. This stage is a selective mechanism where the cognitive process helps to associate and distinguish the object. The location of specific feature is selected, and a separated attribute map is created for each feature (orientation, shape, color). Afterwards, these maps are summarized in the final
master saliency map, that represents conspicuous areas caused by attribute maps. Attention
will follow the regions of the highest saliency [43].
Chapter I. Basic Aspects of Human Interaction with 3D Technology
Figure I.6 – Example of stimulus for target search of the FIT theory. (a) - target is a horizontal bar
among the vertical, it is an example of feature search; (b) - target is a horizontal blue bar, but the bar is the same orientation as yellow bars and same color as vertical bars, it is an example of conjunction search.
[43].
Feature search is a preattentive process, that can ensure fast detection of one "pop out"
feature, like color or orientation. Example of this search is given on Figure I.6a, where one bar is horizontal among the vertical bars. Thus, this type of search has a similar idea as the
Bottom-up selective process, when information is chosen without any a priori knowledge [44]. Visual attention is involuntary and follows the signal features, that makes it "Stimuli-driven".
Conjunction search is the selection of a target that has combined visual features, as the
colored oriented bar on Figure I.6b. It requires efforts and takes more time to be processed. Reaction time increases significantly and depends on the number of distractors. Since this selection is consistent and requires voluntary attention, it shares similar features with
Top-down selection [44]. This method is targeting to find the aim of the search and complete the
task. It is referred to as "Task-driven".
Further research found out that more than one feature can guide the conjunction search [45,46]. Continuing with this idea, Wolfe suggested the Guided search model [3]. According to his theory, attention is following the target by a preattentive process. It guides attention in both bottom-up and top-down approaches, run in parallel and allowing to separate stimuli into potential goals and distractors. Information, obtained by both methods, is analysed and sorted according to its priority. Consequently, some conjunction searches are more efficient than predicted by FIT. Following the example on FigureI.7, where the target is black vertical bar. It can be described as vertical for orientation and black for color. So, this bar can be
Figure I.7 –Example of feature maps for color, orientation and size, and their integration into saliency map according to Guided Search model [3].
searched either as vertical between black stimuli, or as black among vertical ones. This type of search is significantly faster in comparison to the random successive one.
Moreover, Wolfe described and classified most of the "preattentive" features according to their capacity to attract attention [47]. The principal attributes for visual attention are color, orientation, size, motion, curvature, depth cues and shape aspects.
2.2 Eye-movements and visual attention
There are three principal movements of eyes: fixations, saccades and pursuit movements.
Fixation is the "stationary" state of eyes. In this position, the fovea is exploring the target
scene. Even though fixation is a stable mode, micro-movements occur during this period. When a viewer fixates his eyes on a given area, the latter is considered as the locus of interest. The duration of fixation varies between 200-300ms, although it can be longer.
Saccade is a rapid abrupt movement of both eyes, and usually voluntary controlled.
Gen-erally, this movement allows to change the observed area and place a new zone of interest on the fovea. Thus, saccades are a principal tool of visual attention. When a saccade happens, vision is considerably reduced and human do not perceive really. Saccadic movement can have
Chapter I. Basic Aspects of Human Interaction with 3D Technology
a straight or curved trajectory. The speed of saccade movement is not controlled voluntary and can reach even 900◦
/s. Saccadic movement can be precise and displace the eye gaze directly to
the target. It can also be corrective saccade. The successive saccade movements are limited by the required refractory time of 150ms.
Pursuits are slow movements of both eyes happening during tracking object. The goal of
pursuit movements is to maintain the moving target on the fovea. Keeping the interest point in this position lets the visual system extracts maximum information about the target. This type of movement appears only in presence of motion. Similarly to pursuit, slow-speed eye movement (smooth) can appear even in the absence of a moving stimulus. Compensatory movements occur in order to correct the position of interest object on the retina after a body movement.
Vergence movement is a motion of eyes in opposite horizontal directions. It ensures the
correction of the binocular vision and it is part of the oculomotor triad reaction. If the target is approaching the viewer, eyes move inward, placing the fixation point closer. If the interest point is going away, movement is outward and the focus is moving further. Micro-eye movements, such as drifts, flicks, microsaccades, high frequency tremors and irregular movements, happen at the same time as fixations. They aim at placing and displacing the point of interest on the fovea in order to stimulate it constantly.
It has been shown in the literature, that eye-movements are directly linked to visual at-tention. The pioneering work of Yarbus demonstrated that eye-movements guide the visual attention and search [4]. In his experiments, the gaze of observers were dependent on the given task, that is demonstrated on Figure I.8. Since the eye-movements participate into visual per-ception, we propose to investigate their behavior deeper. Further in this thesis, we examine the changes of saccades and fixations regarding visual attention and visual fatigue.
3 Computational visual attention models
The succeeding step of Feature Integration Theory was the mathematical models attempting to reproduce the behavior of visual cells. Their aim is to imitate the results obtained by psycho-visual experiments using psycho-visual features of the image. We start this section by presenting several approaches for 2D saliency prediction. Methods range between biologically plausible with complex calculation, and simple algorithms with competitive results. The first type of models mostly use the low-level features (intensity, color, motion), where each attribute creates its own conspicuity map, that are pooled at the end. This merging creates a saliency map,
Figure I.8 – Influence of task on eye-movement. The experiment has been conducted on the painting "Unexpected Return" of Ilya Repin. The trajectory of eye movements is depending on the task: 1) free examination; 2) estimate the financial situation of the family; 3) give the ages of the people; 4) suggest what family has been doing before the arrival of unexpected visitor; 5) name the clothes of the people; 6) remember the position of people and objects in the room; 7) estimate how long visitor has been away from family [4].
highlighting some regions of the scene that stand out relatively to the neighboring parts. Models of the second type propose simple and efficient calculation, using Gaussian blur and interest points. We limited the number of presented saliency models to the ones, that will be used further or appear to be a reference in saliency modeling. More detailed description of the literature of human attention simulation can be found in [48], where authors introduced most of the existing models and databases.
Secondly, in this section we describe existing models for visual attention prediction dedicated to 3D content. Most of the existing approaches are based on saliency detection for 2D. However the perception of 2D and 3D content is different, as new cues such as disparity are introduced.
3.1 Koch and Ulman model
Koch and Ullman proposed the first visual attention model by considering the biological
Chapter I. Basic Aspects of Human Interaction with 3D Technology
the stimulus to predict salient areas. The model of Koch and Ullman consists of three principal stages, as depicted on Figure I.9.
Figure I.9 –Flowchart of the model proposed by Koch and Ullman [5].
– The elementary features (color, orientation, motion, etc.) are extracted from the image in parallel. Each of these attributes creates the early representation, so called "topographical map". This stage corresponds to the processing in the visual cortex. The topographical maps are created thanks to the mechanism of lateral inhibition. It simulates the reaction of the cortical cells and distinguishes the pop-out areas of the visual field for each feature. Afterwards, these maps are merged into one saliency map.
– The neural network WTA (Winner-Take-All) processes the fused saliency map, selecting the most salient region (Focus of Attention "FOA"). The idea of using WTA in modeling visual attention and its implementation [49] is one of the most significant contribution of
Koch and Ullman.
– The selection of the most salient region is guided by the central presentation. The WTA ensures the shift to the next most conspicuous area by inhibiting the previous FOA region. This way, WTA selects a new FOA area at each iteration among the remaining salient parts of the scene.
The visual system treats a visual scene in a sequential and automatic manner by a selective examination of the location of salient information. The model of Koch and Ullman has been the basis for other models proposed later.
3.2 Itti’s model
The first full implementation and verification of the work of Koch and Ullman was the model proposed by Itti et al. [50]. This model is one of the most well-known and most cited. Moreover, it is often used as a reference for the new proposed saliency algorithms. It is a bottom-up model, that employs the principles proposed by Koch and Ullman. The simultaneous parallel calculation of conspicuity maps, network WTA and return inhibition are adopted from work [5]. The schematic representation of this model is given on Figure I.10.
Figure I.10 –Flowchart of the model proposed by Itti et al. [6].
The maps are extracted from an image for the low-level features: intensity, color and ori-entation.
– The intensity image is obtained according to equation I.1, where r, g, b represent red, green and blue component respectively.
I = (r + g + b)/3 (I.1)
– Four broadly-tuned color channels are created for an image as described by equation I.2. Each channel gets the maximum response for the maximum saturated hue to which it is set up.
Chapter I. Basic Aspects of Human Interaction with 3D Technology
R = r − (g + b)/2
G= g − (r + b)/2 B = b − (r + g)/2
Y = r + g − 2(|r − g| + b) (I.2)
– Local orientation is extracted from the intensity image I by using oriented Gabor pyramids
O(σ, θ ), where σ ∈ [0, 8] stands for the pyramid scale, and θ ∈ {0◦
,45◦
,90◦
,135◦
} represent the orientation direction.
Eventually, 42 feature maps are obtained for an image: 6 - for intensity, 12 - for color, 24 - for orientation. During the second stage, feature maps are combined into three conspicuity maps. Following the bottom-up approach, the normalization operator N(.) is proposed. It applies on the maps of the same characteristic in order to produce one conspicuity map per feature. Its principle lies in the promotion of the feature maps with small number of strong peaks, and neglecting maps with numerous similar responses.
N = (M − m)2. (I.3) Its mathematical presentation is given in equation I.3, where M is a global maximum and
m stands for the average of the other local maxima. Hence, the values of the map, normalized
in range [0, M], are globally multiplied by (M − ¯m)2. Then, feature maps are merged into three
conspicuity maps (I - the intensity map, C - the color map and O - the orientation map) by the across-scale addition. The final saliency map is obtained by normalization and sum-up the conspicuity maps (equation I.4)
S = 1
3
h
N(I) + N(C) + N(O)i. (I.4) The selection of salient areas from the obtained map is ensured by the neural network WTA (look at section3.1), that works according to the principle of "return inhibition". It provides the changing of focus of attention (FOA) by selecting the most salient regions and the elimination of others.
Later, the motion component was added to the algorithm, giving the possibility to analyze dynamic scenes [51]. The motion conspicuity map was obtained by the spatial difference of Gabor pyramids between previous and current frame. The advantage of the pyramidal
repre-sentation is the possibility to consider broad range of velocities.
Even though this model is accepted as a reference, several issues have been raised in the literature. Firstly, some values were chosen arbitrary without justification, like the parameters for the difference of Gaussian. The second issue is related to the application of the triple normalization procedure.
3.3 Le Meur’s model
The model proposed by Le Meur et al. takes its roots from the Feature Integration Theory and suggests to resolve some issues of Itti’s model. This biologically inspired bottom-up prediction model was firstly proposed in [52], then motion was added in [7]. The last version will be presented in this part, its flowchart is given on Figure I.11. Similarly to Itti, several feature maps are created and grouped into two main categories: spatial and temporal.
Figure I.11 – Flowchart of the model proposed by Le Meur et al. [7].
The creation of the spatial map starts from the projection of the RGB image into Krauskopf’s color space (A - achromatic component or luminance; Cr1 - red and green antagonist
compo-nent; Cr2- blue and yellow antagonist component). These three channels simulate the pathways
of the brain to interpret the visual information. Then, the contrast sensitivity function (CSF) is applied on each channel in order to obtain the values in the same visibility unit. The CSF in-dicates changes of sensitivity with varying spatial frequency and orientation. At the next step, the hierarchical decomposition separates the 2D spatial frequency domain into orientations
Chapter I. Basic Aspects of Human Interaction with 3D Technology
and radial frequency for each perceptual component. This results into sub-band decomposi-tion considered as the neural image corresponding to particular cortical cells. The redundant information is suppressed using a centersurround filter. Afterwards, three feature maps (1 -achromatic and 2 - chromatic ) are obtained. They are coherently normalized according to the possible theoretical maximum. This maximum was calculated in a heuristic way by conducting psychovisual experiments.
The temporal saliency map follows the idea that the motion contrast is one of the strongest visual attractions. Hence, the temporal salient map presents the relative motion occurring on the retina. This relative motion can be expressed as the difference between local and global (dominant) motion, as given in equation I.5. The local motion −→V local is obtained for each
point of image by applying a hierarchical block matching through several levels. The dominant motion −→V dominant is given by a 2D parametric model, obtained using a parametric technique
described in [53]. The motion saliency strongly depends on the average amount of relative displacement. For instance, a target moving faster than background is detected more rapidly, than a target moving slower that distractors.
− → V relative= − → V dominant− − → V local (I.5)
Obtained temporal S1 and spatial S2 conspicuity maps are fused into one global saliency
map. Global fusion is based on inter- and intra- competition as described by equation I.6.
S = F(Si) = IntraMap + InterMap, IntraM ap=X SiN N earest(W T A(Nc(Si))) , InterM ap=Y SiN N earest(W T A(Nc(Si))) . (I.6)
Nearest in equationI.6is the nearest local maximum found by WTA relatively to the current
position of pixel in map Si (i ∈ [1, 2]). Moreover, local maximum is selected only if its gradient
of saliency is higher than a fixed threshold. F(Si) states for the fusion procedure.
S(s) = F(ST, F(SA, F(SCr1, SCr2))) (I.7)
The overall fusion is a hierarchical process of merging. Chromatic maps are combined into one color map and fused with the achromatic map creating thus one static saliency map. Secondly, the static saliency is fused with the temporal map.
Although, the model of Le Meur et al. is following the bio-plausible approach, its application remains limited. The computational complexity is not fully justified relatively to the obtained improvement.
3.4 Achanta’s model
A solution solving the issues of complexity of bio-plausible models was proposed by Achanta et
al. [8]. Their model was developed following several requirements: 1) select the largest salient
region and highlight it uniformly, 2) well-define the edges of salient object and 3) ignore high frequencies from texture. The model produces the saliency map with a resolution of the input image. The framework of this saliency model is given on FigureI.12
Figure I.12– Flowchart of the model proposed by Achanta et al.[8]
This model uses the properties of color and lightness. According to Achanta’s algorithm, the RGB input is converted into CIELab color space. Next, the difference (Euclidean distance) is calculated between the blurred and original image. Saliency map S(x,y) is defined according to equation I.8.
S(x, y) = ||Iµ− Iωhc|| (I.8)
where Iµ - the arithmetic average image feature vector, Iωhc is an input image blurred by
Gaussian filter with 5 × 5 binomial kernel, and (x, y) represent the pixel coordinates. Despite the mathematical simplicity, the model shows competitive results in comparison to bio-plausible models.
Chapter I. Basic Aspects of Human Interaction with 3D Technology
3.5 PINS (Prediction of INterest points Saliency)
With the aim to find a trade off between complexity and bio-plausibility, Nauge et al. proposed a model based on interest points. Similarities have been noticed between detectors (Harris,
SIFT, SURF) and saliency, like multi-level image decomposition and the use of the Gabor
filters. Inspired by this idea, they conducted statistical comparison between interest points and gaze points [54]. In this work, they found the parameters of detectors that correspond to the best correlation between interest and gaze points. Obtained results promoted the creation of a saliency model, described on FigureI.13.
Figure I.13 –Flowchart of the model PINS [9].
The principle of saliency map generation is similar to the creation of heat map. Firstly, the interest points are found by one detector (Harris, SIFT, SURF) with the best tuned parameters. Secondly, for each detected interest point, as for gaze point, a kernel of Gaussian (σ=35, as defined for heat map) is applied. A Gaussian filter is weighted by the parameters of the detected interest point (response R for Harris, size for SIFT, and hessian factor for SURF). Afterwards, a normalization process is introduced to have values of saliency map between [0,1] and do not depend on the type of the used detector. The central bias is implemented as Gaussian kernel, and reflects the property of human attention on still images.
It is important to emphasize the low complexity and performance results of PINS model. Eventually, saliency computation can be easily added to numerous applications using already interest points.
3.6 S3D Saliency models
Before to start the description of algorithms for 3D saliency detection, we would like to highlight that 2D and 3D perception are quite different. Thereby, the selection mechanism of visual attention is different for 2D and 3D content. Several works focused on studying the variation
Figure I.14–Frames with overlaid heat-maps from video-sequences used in subjective test, 2D is on the left, 3D - on the right [10].
of attention behavior occurring between 2D and 3D content. For instance, a free-watching experiment with both 2D and 3D images was conducted by Jansen et al. [55] where a time-dependent effect on eye-movement was found for 2D and 3D. Analogously, Huynh-Thu et al. [10] run experiments on 2D and 3D video and came to similar conclusions. Their results are given on FigureI.14. The conclusion of the latter studies is that viewers’ fixation are essentially on first-plan objects of the scenes even in 2D using monocular cues. They also observed some similarities between 2D and 3D attention maps, that gave the push towards the development of 3D saliency models using 2D salient features in addition to depth cues.
One of the pioneering saliency models for stereo content has been created by Maki et al. [11]. The proposed algorithm is depicted on FigureI.15. Its architecture is based on the simultaneous detection of pre-attentive cues (image flow, stereo disparity and motion), followed by a stage of cues integration. The closeness and motion are the main fusion criteria. The procedure of cue integration can occur into two modes: pursuit way corresponds to the situation of object tracking and saccade method handles the attention shift. The simplicity is a strong advantage of the algorithm. However, the model detects only the closest moving object, not necessarily representing the area of interest.
Several studies tried to extend existing 2D models by the introduction of depth information.
Ouerhani et al. proposed a 3D visual saliency model for still images using depth information
jointly with a 2D saliency computational model [12]. The flowchart of their model is presented on Figure I.16. The proposed approach is based on the linear combination of low-level and

![Figure I.9 – Flowchart of the model proposed by Koch and Ullman [5].](https://thumb-eu.123doks.com/thumbv2/123doknet/7916919.265112/37.892.225.579.278.579/figure-i-flowchart-model-proposed-koch-ullman.webp)
![Figure I.10 – Flowchart of the model proposed by Itti et al. [6].](https://thumb-eu.123doks.com/thumbv2/123doknet/7916919.265112/38.892.144.683.413.816/figure-i-flowchart-model-proposed-itti-et-al.webp)
![Figure I.11 – Flowchart of the model proposed by Le Meur et al. [7].](https://thumb-eu.123doks.com/thumbv2/123doknet/7916919.265112/40.892.281.551.558.896/figure-i-flowchart-model-proposed-le-meur-et.webp)
![Figure I.12 – Flowchart of the model proposed by Achanta et al.[8]](https://thumb-eu.123doks.com/thumbv2/123doknet/7916919.265112/42.892.128.697.552.776/figure-i-flowchart-model-proposed-achanta-et-al.webp)
![Figure I.14 – Frames with overlaid heat-maps from video-sequences used in subjective test, 2D is on the left, 3D - on the right [10].](https://thumb-eu.123doks.com/thumbv2/123doknet/7916919.265112/44.892.184.712.195.501/figure-frames-overlaid-heat-video-sequences-subjective-right.webp)