UNIVERSITÉ DE MONTRÉAL
LEFT VENTRICULAR VIABILITY MAPS:
FUSION OF MULTIMODAL IMAGES OF CORONARY
MORPHOLOGY AND FUNCTIONAL INFORMATION
PASCALE BÉLIVEAU
INSTITUT DE GÉNIE BIOMÉDICAL ÉCOLE POLYTECHNIQUE DE MONTRÉAL
MÉMOIRE PRÉSENTÉ EN VUE DE L‟OBTENTION DU DIPLÔME DE MAÎTRISE ÈS SCIENCES APPLIQUÉES
(GÉNIE BIOMÉDICAL) DÉCEMBRE 2009
UNIVERSITÉ DE MONTRÉAL
ÉCOLE POLYTECHNIQUE DE MONTRÉAL
Ce mémoire intitulé:
LEFT VENTRICULAR VIABILITY MAPS: FUSION OF MULTIMODAL IMAGES OF CORONARY MORPHOLOGY AND FUNCTIONAL INFORMATION
présenté par: BÉLIVEAU Pascale
en vue de l‟obtention du diplôme de : Maîtrise ès Sciences Appliquées a été dûment accepté par le jury d‟examen constitué de :
M. MARTEL Sylvain, Ph. D., président
Mme CHERIET Farida, Ph. D., membre et directrice de recherche M. O‟DONNELL Tom, Ph. D., membre et codirecteur de recherche M. DUONG Luc, Ph. D., membre
DÉDICACE
À mon mari Samuel
ACKNOWLEDGEMENTS
I would first like to thank my supervisors Farida Cheriet and Tom O‟Donnell who guided me throughout this project. Their patience, help and support was much appreciated and I greatly enjoyed working with both of them. They have shared their knowledge in cardiology and medical imaging and I learned a great deal from these topics from both of them. I would also like to thank Gareth Funka-Lea and Frank Sauer for the opportunity that was given to me to complete my work in association with Siemens Corporate Research and spend two internships with them in Princeton, New Jersey. My stay was greatly appreciated and I cherished the contact I had with renowned researchers. Thanks to Drs. Setser and White for their interest and work in this project. Their ideas and interpretation were extremely valuable. Thanks to the members of the jury, Luc Duong and Sylvain Martel for accepting and reviewing the present masters‟ thesis.
I enjoyed working in the LIV4D laboratory at École Polytechnique de Montréal. Thanks to Philippe Debanné, associate researcher in the lab. I appreciated the acquaintances I made: Rola Harmouche, Lama Seoud, Fouzi Benboujja, Olivier Dionne, Fantin Girard, Jérémie Thériault, Hervé Lombaert, Pascal Fallavollita, Rafik Bourezak, Thomas Hurtut, Kinda Anna Saddi and everyone else who participated in creating a good work environment where the exchange of knowledge was enjoyable. Thanks to Aris Sotiras from École Centrale de Paris for his advice and for discussing my work.
Finally I would like to thank Samuel, my husband, who supported me and gave me valuable scientific advice. Special thanks also go to my mother Solange who always believed in me, for her support and encouragement. Both of them have stood by me through many hours of work. Thanks also to my family, my uncle and aunt and cousins.
RÉSUMÉ
Les maladies coronariennes demeurent encore la première cause de décès aux Etats-Unis étant donné que le taux de mortalité lié à ces maladies enregistré en 2005 est d‟une personne sur cinq. Les sténoses (obstructions des artères coronaires) se manifestent par un rétrécissement du diamètre des coronaires, produisant une ischémie soit une réduction du flot sanguin vers le myocarde (le muscle cardiaque). Dans les cas les plus graves, les cellules qui composent le myocarde meurent définitivement et perdent leur fonction contractile. En présence de cette maladie les cliniciens ont recours à l‟imagerie médicale pour étudier l‟état du myocarde afin de déterminer si les cellules qui le composent sont mortes ou non ainsi que pour diagnostiquer les sténoses dans les coronaires. Actuellement, le clinicien utilise l‟imagerie nucléaire pour étudier la perfusion du myocarde afin de déterminer son état. Une projection de cette information sur un modèle segmenté du myocarde, soit le modèle à 17-segments, établie le lien entre les zones atteintes et les coronaires qui sont les plus responsables de leur irrigation. Ce n‟est que par la suite, lors d‟une angiographie, que le clinicien pourra identifier les sténoses et possiblement intervenir par revascularisation. Une autre méthode de visualisation de la structure coronarienne et de la présence de sténoses est la méthode Green Lane. Le clinicien reproduit la structure des coronaires sur une carte circulaire en se basant sur l‟angiographie. L‟objectif de notre projet de recherche est de créer un modèle spécifique au patient où il serait possible de voir les territoires coronariens sur la surface du myocarde fusionnés avec la viabilité myocardique. Ce modèle s‟adapterait au patient et permettrait l‟étude d‟autres groupes de coronaires, ce qui n‟est pas possible avec le modèle à 17-segments qui est fixe et ne présente que les trois groupes principaux de coronaires (coronaire droite, gauche et circonflexe). De plus, ce modèle divise la surface de l‟épicarde en segments à partir de données statistiques qui sont limitées par la nature et la représentativité de l‟échantillon de la population considérée et ne permet pas de visualiser la distribution de perte de viabilité sur la surface épicardique.
D‟autre part, la disponibilité de volumes d‟angiographie par tomodensitométrie (ATDM) permet de visualiser les structures coronariennes en 3D et d‟en déduire les territoires associés sur la surface épicardique. En effet cette modalité permet d‟obtenir ces structures grâce à un agent de contraste qui rehausse leur visibilité. Les territoires coronariens peuvent alors être déterminés à l‟aide d‟un algorithme de Dijkstra appliqué sur la surface de l‟épicarde en 3D, avec comme point de départ les points surfaciques les plus proches des coronaires. À chaque point est assignée une couleur correspondant à la coronaire qui se trouve la plus proche. Par la suite, nous utilisons des volumes par imagerie par résonance magnétique à rehaussement tardif (IRM-RT). Cette modalité a déjà fait ses preuves en terme de fiabilité lors de l‟évaluation de la viabilité du myocarde. Un agent de contraste est administré et persiste dans les zones de perte de viabilité, un phénomène expliqué par l‟éjection plus rapide de l‟agent de contraste par les cellules saines. La viabilité intra-murale est étudiée entre les deux surfaces du myocarde. Les deux volumes sont obtenus de la Cleveland Clinic aux États-Unis. Avant de projeter les informations sur un modèle circulaire similaire au modèle à 17-segments il faut d‟abord établir la correspondance de structures dans les deux modalités. Une méthode de recalage utilise l‟ICP (“iterative closest point”) pour aligner les modèles de manière rigide dans le sens du grand axe et complète l‟alignement de manière manuelle dans le sens du petit axe où un manque de caractéristiques empêche un recalage complet basé seulement sur les modèles surfaciques disponibles. Disposant à la fois des modèles surfaciques du myocarde dans les deux modalités, il est possible d‟effectuer un recalage par correspondance de primitives afin de fusionner les informations structurelles et fonctionnelles. Nous avons choisi l‟analyse par composante principale pour aligner les modèles surfaciques afin de déterminer la direction de distribution maximale des points dans l‟espace 3D. Ce recalage s‟est avéré performant pour l‟alignement dans le sens du grand axe du cœur par contre le manque de primitives correspondantes dans le sens du
petit axe limite la méthode. Il s‟agit de plus d‟un recalage rigide alors que le cœur est constamment en mouvement et engendre des déformations non rigides. Les splines d‟approximation par plaques minces sont donc utilisées afin d‟effectuer un recalage élastique des modèles. De plus, la disponibilité des deux volumes d‟intensité permet de compléter le recalage multimodal en se basant sur l‟information mutuelle calculée à partir des deux volumes. Une fois le recalage complété en 3D, il est possible de projeter l‟information de 3D vers 2D sur une carte et obtenir un modèle complet de territoires coronariens augmenté par la viabilité myocardique. Le clinicien peut donc observer les zones de perte de viabilitié et les associer à un groupe de coronaires responsables de leur irrigation. Notre méthode est comparée à un modèle Green Lane afin d‟évaluer les différentes étapes de l‟approche proposée. Dans cette méthode le clinicien se réfère à une angiographie pour déterminer la position des coronaires en 3D et reporte cette structure sur une carte circulaire 2D. Afin de faciliter la comparaison, le clinicien a manuellement tracé ce qu‟il considère être la bordure des territoires.
Notre évaluation clinique a été effectuée sur des données de 6 patients au total, 4 pour lesquels il était possible de calculer les territoires coronariens, 4 autres pour lesquels la viabilité pouvait être étudiée dans les volumes IRM-RT et 2 pour lesquels les informations structurelles et fonctionnelles étaient disponibles. L‟évaluation de l‟algorithme de calcul des territoires coronariens s‟effectue en comparant les surfaces de territoires obtenus par notre méthode et les surfaces obtenues par la méthode Green Lane. L‟aire des surfaces correspondantes est divisée par la surface totale puis multipliée par 100%. La validation de la méthode de recalage se fait de manière qualitative.
Nous avons ainsi réussi à créer une carte continue et spécifique au patient où la perfusion coronarienne du myocarde (et donc les territoires coronariens) est visible et fusionnée avec l‟information de viabilité du myocarde. Par défaut de disponibilité de données nous
n‟avons pas pu représenter la carte complète pour tous les patients. Par contre, l‟évaluation de l‟établissement des territoires coronariens a démontré une correspondance moyenne de surface de 87% (évalué sur tous les patients), soit une valeur supérieure au résultat obtenu avec le modèle à 17-segments (78.8%), tous les deux étant comparés à la méthode Green Lane. De plus, la carte finale que nous avons générée permet bien d‟associer les zones de perte de viabilité myocardique aux coronaires responsables.
Nous avons réussi à créer un modèle augmenté qui montre à la fois la viabilité et les territoires coronariens sur une même carte continue et spécifique au patient. Cette représentation comporte des limites. Il est possible d‟observer de la distorsion sur les anneaux extérieurs de notre modèle. De plus les cliniciens qui ont évalué notre modèle comprennent l‟image globale mais éprouvent des difficultés à interpréter la viabilité. Le recalage que nous avons utilisé est de plus limité. Premièrement il est difficile d‟assurer une capture des deux volumes au même moment du cycle cardiaque, même lorsque contrôlé avec un électrocardiogramme. La présence d‟agent de contraste dans le myocarde d‟images IRM-RT et son absence dans les images ATDM (dans cette modalité l‟agent n‟est présent que dans les coronaires, rend le recalage par information mutuelle plus difficile. De plus le modèle de déformation élastique que nous utilisons est déduit à partir de la surface du myocarde et donc ne tient pas compte des voxels avoisinants. Les résultats qualitatifs que nous obtenons indiquent un recalage optimal mais les différences entre les solutions de déformations possibles sont souvent non significatives, ce qui nous pousse à croire que nous détectons un recalage maximal sans pouvoir obtenir un niveau de précision satisfaisant. La méthode d‟identification des artères coronaires reste à raffiner puisque la segmentation de ces structures est effectuée manuellement par un expert.
ABSTRACT
Coronary heart disease (CHD) can be attributed to the build up of plaque in the coronary arteries (atherosclerosis) which leads to ischemia, an insufficient supply of blood to the heart wall, which results in myocardial dysfunction. When ischemia remains untreated an infarction may appear (areas of necrosis in cardiac tissues) and consequently the heart‟s contractility is affected, which may lead to death. This disease is the basis of one of every five deaths in the United States during 2005, elevating this disease to the largest cause of death in United States. In standard clinical practice, perfusion and viability studies allow clinicians to examine the extent and the severity of CHD over the myocardium. Then, by consulting a population-based coronary territory model, such as the 17-segment model, the clinician mentally integrates affected areas of myocardium, found in nuclear or magnetic resonance imaging, to coronaries that typically irrigate this region with blood. However, population-based models do not fit every patient. There are individuals whose coronary tree structure deviates from that of the majority of the population. In addition, the 17-segment model limits the number of coronary groups to three: left coronary artery (LAD), right coronary artery (RCA) and left circumflex (LCX). Moreover this map is not continuous; it divides the myocardial surface in segments.
Our objective is therefore to create a patient-specific map explicitly combining coronary territories and myocardial viability. This continuous model would adapt to the patient and allow the study of groups of coronary unavailable with standard models. After having identified loss of viability, the clinician would use this model to infer the most likely obstructed coronary artery responsible for myocardial damage. Visualization of the loss of viability along with coronary structure would replace the physician‟s task of mentally integrating information from various sources.
Anatomic (or structural) information of the heart is available with Computer Tomography Angiography (CTA). A contrast agent is administered through the arm and spreads until it reaches the coronaries. A CT scan is performed at that moment and coronaries appear bright on the resulting images. The surfaces of the myocardium (epicardium and endocardium) are identifiable and coronary anatomy of individual patients can be determined by experienced physicians. Once the coronary arteries and LV surface is recovered, coronary territories can be computed over the epicardial surface using the Dijkstra algorithm. This method finds the shortest path from a source point, a point on a coronary projected onto the LV surface, to all other point of the surface. Each point on the surface is then assigned a label corresponding to the closest coronary.
Cardiac function may be inferred from Delayed Enhancement Magnetic Resonance (DEMR) images. In this protocol, a contrast agent is administered to the patient and image acquisition is done after a known delay corresponding to the wash out rate of healthy myocardial cells. After that delay, any cells still retaining the contrast agent are considered dead. This phenomenon is hypothesized to be caused by the slow wash out rate of dead cells. Thus, bright areas of the myocardium indicate a possible site of scar.
Fusion of both modalities (CTA and DEMR) is needed in order to guarantee the correspondence of structure and function in the final map. We chose to accomplish an initialization of registration by Principal Component Analysis (PCA) which determines and aligns the directions of maximal variance of two clouds of points (the surface points of the LV in both modalities). As a result, the LV in both DEMR and CTA images are roughly lined up in 3D.
This rough estimation of the registration suffers from two drawbacks. First, it is a rigid registration and the heart deforms non-rigidly. Second, the LV is rotationally symmetric in the short axis plane so this aspect of the alignment may not be correct. Once the DEMR and CTA images have been roughly aligned by PCA, we can proceed to a
more precise registration and exploit the intensity information contained in each available volume with mutual information. Thin plate spline (TPS) fitting consists of finding a deformation according to given source and target landmarks. We apply it to obtain an elastic registration of myocardial surfaces. Once a 3D registration has been completed, a projection can be performed from 3D to 2D. Thus, a complete model is obtained where coronary territories are overlaid with viability information for a specific patient.
Clinical evaluation was done over 6 patients. Coronary territories could be computed for four of them and viability information was available for four others. Both structural and functional information was available for two patients. Validation for our computed coronary territories was done by a comparison with the Green Lane method. In this method, given a coronary angiogram of the patient, the coronary arteries and branch vessels are transcribed onto a standard diagram by an expert cardiovascular imager and resulting coronary territories are drawn by an expert. By employing the Green Lane method to create ground truth we were able to quantify the correctness of both our territory map as well as the 17-segment model. Overall, the average percent correlation between our CTA-derived maps and the ground truth was 87%. The 17-segment model comparison resulted in a correlation of 79%. Registration was evaluated qualitatively.
We achieved our goal of creating a patient-specific coronary territory map fused with a viability map which presents the functional as well as structural information of interest to the clinician for the diagnosis of CHD. While the presented results are an improvement over the 17-segment model, some criticism can be formulated for each step of our method and there is place for improvement at different levels. First, distortion is seen from the projection of texture from 3D to 2D. The texture is therefore altered and the physician has to be made aware of this fact. Second, since both images are from different modalities and acquired at differing times, it is hard to guarantee that the images
represent the exact same time in the cardiac cycle even if ECG gaiting is performed. Third, the presence of contrast agent in the myocardium in DEMR images and the absence of this agent in the myocardium (though not the coronaries) in CTA make it harder to have a registration method that is intensity-based. Finally, the registration is directly dependant on the quality of the segmentation in both modalities and our deformation model applies only to surface points.
In conclusion, our fused model showing myocardial viability and coronary structure should allow the clinician to establish a correspondence between a loss of viability and a specific coronary. Moreover our method allows the clinician to associate a territory with any branch vessel. Although there are some improvements to bring to the model, we have advanced with regards to the previous methods. Further development of the method could lead to a diagnosis tool usable in clinical practice in the presence of CHD.
CONDENSÉ
Introduction
Les maladies du cœur peuvent être causées par l‟accumulation de plaque à l‟intérieur des artères coronaires (on parle d‟athérosclérose) [1]. On nomme sténose le rétrécissement causé par cette accumulation. Cet état peut mener à une ischémie : une insuffisance du volume de sang acheminé vers le muscle cardiaque (le myocarde). Non traité, il peut mener à une nécrose du myocarde (la mort des cellules du muscle) et la contraction du muscle cardiaque peut s‟en trouver affectée. Puisque le cœur pompe le sang vers le reste du corps, une dysfonction du myocarde peut mener à la mort du patient. Les maladies coronariennes ont causé la mort d‟une personne sur 5 durant l‟année 2005, la plaçant au premier rang des causes de décès au Etats-Unis [2]. La revascularisation est une procédure qui tente de rétablir le flot sanguin vers le muscle cardiaque dans le but de retrouver les contractions cardiaques normales du cœur.
En présence de maladie coronarienne, l‟imagerie médicale peut assister le clinicien lors du diagnostique. Il cherche à connaître l‟état du myocarde et plus spécifiquement l‟état du ventricule gauche (VG) afin de déterminer si les cellules qui le composent sont viables ou non. En effet, la revascularisation est une procédure qui ne sera bénéfique que pour les patients dont les cellules cardiaques sont encore viables et qui peuvent donc récupérer leur fonction de contraction. La revascularisation n‟est considérée que dans les cas ou une récupération du myocarde est possible. Les connaissances sur la viabilité du myocarde peuvent donc aider au niveau préopératoire afin de planifier la procédure d‟intervention ou dans le but de tenter de prédire les résultats de l‟intervention.
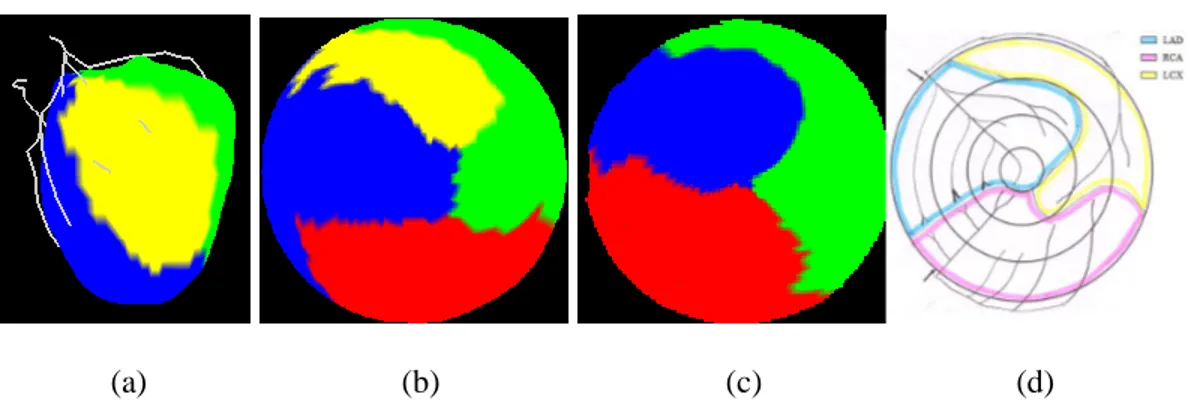
Le clinicien a alors recours à de l‟imagerie fonctionnelle tel l‟imagerie nucléaire ou par résonance magnétique pour étudier l‟état du myocarde. Le clinicien cherche ensuite à localiser les sténoses qui peuvent être la cause des dommages au muscle cardiaque. Afin de faire ce lien les cliniciens utilisent couramment un modèle, le modèle à 17-segments [34], qui établie une association entre la surface du myocarde et un groupe d‟artères coronnariennes. Ce modèle est basé sur un modèle probabiliste de la distribution des coronaires sur le myocarde en se basant sur la population en générale. Suite à ceci le clinicien a souvent recours à une angiographie afin de déterminer la structure coronarienne du patient et localiser les sténoses dans les coronaires. Cette modalité d‟image permet d‟observer l‟agent de contraste se propageant dans les artères, en visualisant la distribution et le diamètre. Un rétrécissement ou même l‟arrêt de propagation de l‟agent se produit en présence d‟athérosclérose. La structure des coronaires peut être étudiée avec la méthode Green Lane. En observant une angiographie le clinicien dessine la structure coronarienne sur un diagramme circulaire et peut aussi y tracer des territoires coronariens (voir Figure 1). Au cours de l‟angiographie le clinicien peut aussi effectuer la revascularisation.
Figure 1 : Diagramme résultant de la méthode Green Lane. Le tracé bleu indique les bordures du territoire associé au groupe de coronaires gauches, le jaune à la coronaire
circonflexe et le rose à la coronaire droite.
Notre objectif de recherche est de créer un modèle d‟assistance au clinicien lors du diagnostique afin de lui permettre d‟étudier la perfusion du myocarde par les coronaires, et donc de connaître la forme de l‟arbre coronarien d‟un patient tout en visualisant l‟étendue de la perte de viabilité du myocarde. Ce modèle serait un modèle spécifique au patient, un avantage par rapport au modèle à 17-segments utilisé présentement et qui est basé sur une moyenne de la distribution des coronaires dans la population. Ce modèle ne tient pas compte des variations qu‟il est possible d‟observer dans la structure coronarienne d‟un patient à l‟autre [38]. Il suppose par exemple une structure coronarienne à dominance droite alors que qu‟elle peut être de dominance gauche ou de codominance pour certains patients [38]. La structure coronarienne est visible à l‟aide d‟angiographie par tomodensitométrie (ATDM), une modalité qui rehausse les coronaires par administration d‟agent de contraste lors d‟une acquisition par tomodensitométrie (TDM). Nous voulons de plus utiliser la modalité par résonance magnétique avec rehaussement tardif (IRM-RT) afin de limiter l‟exposition du patient à des agents radioactifs. En effet, l‟IRM-RT a été reconnue comme étant une modalité d‟imagerie fiable pour l‟étude de la viabilité myocardique [90] et est de plus non invasive (comparée à une angiographie par exemple). Afin d‟obtenir un modèle augmenté il faut préalablement effectuer un recalage des volumes disponibles. En effet, sans recalage les
informations seraient projetées de manière indépendante et le clinicien pourrait obtenir de l‟information erronée concernant une coronaire faussement associée à une perte de viabilité myocardique. Le cœur étant constamment en mouvement, l‟électrocardiogramme ne garantie pas l‟acquisition des images au même instant du cycle cardiaque. Les approches conventionelles pour le recalage de ces deux volumes appliquent l‟algorithme ICP (“Iterative Closest Point”) sur des modèles surfaciques disponibles dans les deux modalités. Cette méthode consiste à mettre en correspondance deux modèles de surface en se basant sur un calcul de distance minimale entre les surfaces et points qui les composent [3]. Le recalage est complété de manière manuelle afin d‟assurer une correspondance d‟orientation dans le sens du petit axe, ce qui ne peut être accompli de façon automatique pour cause de manque de caractéristiques dans cette direction. Nous cherchons donc de plus à automatiser ce processus.
Revue de littérature
Suite à une étude de la viabilité myocardique, le clinicien a recours à un modèle d‟association de régions du myocarde à un groupe d‟artères coronariennes. Le modèle à 17-segments a été recommandé par l‟AHA et est présenté à la figure 2. Chaque cercle concentrique du modèle correspond à un niveau d‟élévation par rapport à l‟apex tel que montré à la figure 2. Ce modèle divise le myocarde en segments, chacun associé à un groupe d‟artères : la partie inférieure gauche (segments 3, 4, 9, 10, et 15) coloré de brun est associée à la coronaire droite, la partie supérieur gauche (segments 1, 2, 7, 8, 13, 14 et 17) de couleur bleu à la coronaire gauche et celle de droite en vert à la circonflexe (segments 5, 6, 11, 12 et 16). Ce modèle est construit à partir de la population mais ne reflète pas l‟arbre coronarien d‟un patient spécifique. Il existe en effet certaines personnes pour qui des segments ne correspondent pas aux coronaires associées par le modèle [38].
Figure 2 : Explication (image de gauche) et modèle originale (image de droite) à 17-segments.
Différentes modalités d‟images existent pour assister le clinicien lors du diagnostique. Les structures anatomiques sont visibles à l‟aide de l‟ATDM. Un agent de contraste est administré au patient au travers du bras et se propage jusqu‟aux artères coronaires. Un scan CT est effectué au moment où l‟agent de contraste se trouve dans les coronaires et elles apparaissent donc plus claires dans les images résultantes. Il est ainsi possible de visualiser la structure tridimensionnelle de l‟arbre coronarien. Cette modalité ne permet pas d‟étudier l‟état du myocarde et le clinicien a recours à de l‟imagerie fonctionnelle où les effets de la maladie sur le muscle sont visibles. L‟imagerie par résonance magnétique (IRM) avec rehaussement tardif (IRM-RT) peut être utilisée. L‟emphase est mise sur les tissues morts dans les images. L‟avantage de l‟IRM-RT sur l‟imagerie nucléaire est de limiter l‟exposition du patient à des agents ionisants. Elle est de plus non invasive en comparaison à l‟angiographie par exemple. L‟IRM-RT utilise un agent de contraste qui persiste dans les zones de pertes de viabilité, au contraire des autres cellules dont on présume une éjection plus rapide du produit de leur environnement.
Des vues spécifiques sont définies lors de l‟étude d‟images cardiaques. Deux sont dans le sens du grand axe (la direction dans laquelle le ventricule gauche est le plus long) et une dans le sens du petit axe dans laquelle le ventricule gauche semble circulaire. Le ventricule droit et gauche sont visibles dans la vue du grand axe horizontal mais seule le VG est visible dans la vue du grand axe verticale.
Recalage multimodal d’images médicales de structures cardiaques
Il existe deux catégories de méthodes de recalage d‟images médicales [119]: par correspondances de primitives ou d‟intensités [124]. La première exploite les formes géométriques et nécessite la sélection de points de contrôles ou la segmentation d‟organes. Il est possible de se fier à des segmentations telle la segmentation de l‟endocarde et de l‟épicarde. Par contre, le recalage ne pourra se faire que dans le sens du long axe puisqu‟aucun repère du myocarde ne permet d‟associer correctement les deux segmentations dans le sens du petit axe du cœur. Les faibles variations de courbures dans le sens du petit axe ne peuvent pas être exploitées. En effet, le muscle cardiaque est constamment en mouvement et se déforme. Il est impossible de garantir que deux acquisitions de modalités différentes soient prises au même instant du cycle cardiaque, même sous contrôle avec électrocardiogramme. De plus les patients souffrant de maladies cardiovasculaires peuvent avoir un VG de forme altéré due à la maladie. Seuls les points d‟insertion, qui sont les points d‟encrage du ventricule droit sur le gauche, sont disponibles, mais ceci nécessiterait la segmentation du ventricule droit. La méthode de recalage avec analyse par composante principale (ACP) a déjà été exploitée avec succès [126]. Cette méthode calcule la direction de dispertion maximale de points dans un espace 3D à partir d‟une matrice de covariance créée à partir d‟une matrice de position 3D des points des modèles disponibles dans les deux modalités. Il s‟agit d‟un recalage rigide.
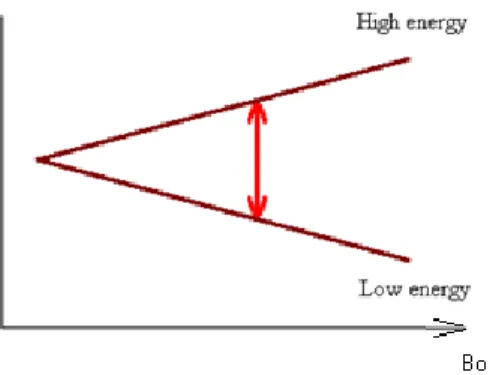
Afin de mettre en correspondance les deux modèles, un champ de déformation peut être appliqué en exploitant le modèle des splines plaque mince [168], [169]. Il s‟agit d‟une méthode de recalage élastique qui s‟effectue en se basant sur un ensemble de points de contrôles correspondants. Le champ de déformation est trouvé en cherchant à minimiser l‟énergie nécessaire afin de courber une plaque mince à partir d‟une position initiale vers une destination connue. L‟énergie en une position (x,y) sur une plaque mince est proportionnelle à la dérivée seconde en un point hors du plan :
2 2 2 2 2 2 2 2 * 2 y z y x z x z
où z est une fonction de x et de y et dépend des positions des points de contrôles et est définie par une fonction de base U qui minimise :
2 2 2 2 2 2 2 2 2 * 2 dxdy y z y x z x z. La généralisation décrit des composantes uk
avec des points sources et destinations et n est le nombre de points sources. Il faut donc minimiser une somme individuelle de composantes d‟après :
d k k d m d m u J u J 1 ) ( ) ( et
m d k m d k d m d d dx x x u m u J ... 2 1 1 1 4 1... ! !... ! ) ( .Une fois le maximum obtenu à partir du recalage par correspondance de primitives il faut encore exploiter le recalage par correspondance d‟intensités. Ce calcul se base sur les valeurs d‟intensités contenues dans l‟image afin de faire une étude statistique de leur distribution dans chacune des images. L‟information mutuelle utilise le calcul d‟entropie, soit
i
i i p
p
H log , où pi est la probabilité d‟occurrence d‟une intensité dans une
PA,B(a,b) est la probabilité d‟avoir l‟intensité a dans l‟image A et l‟intensité b dans
l‟image B à une même position relative. Ces probabilités sont évaluées à partir d‟histogrammes.
Objectifs de recherche
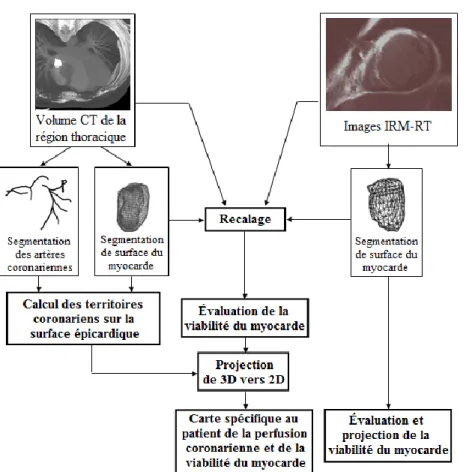
L‟objectif principal est donc de représenter les zones de perfusion myocardique des coronaires dans le cas de patients soufrant de troubles cardiaques causés par des maladies coronariennes à partir de volume ATDM, couplé avec de l‟information fonctionnelle de la viabilité myocardique obtenue à partir d‟un volume IRM-RT. Un recalage de surfaces provenant des deux modalités permet donc d‟établir la fusion de l‟information structurelle et fonctionnelle afin de visualiser l‟ensemble de l‟information intégrée sur une carte circulaire à deux dimensions. Le premier objectif est donc de déterminer les territoires coronariens sur la surface du myocarde à partir de surfaces du VG et de la segmentation de coronaires dans un volume ATDM. Le deuxième objectif est l‟obtention d‟une fusion des deux modalités qui implique un recalage de la surface du cœur en utilisant les modalités CT et IRM en trois dimensions. Ceci est accompli dans un premier temps en se basant sur la segmentation des surfaces myocardiques à partir d‟un volume ATDM et d‟un volume IRM-RT puis en se basant sur les intensités contenues dans les volumes. Le troisième objectif consiste à obtenir une carte de viabilité myocardique établie à partir de la segmentation des surfaces du myocarde (épicarde et endocarde) dans un volume IRM-RT recalé. Le dernier objectif est la projection simultanée des territoires coronariens ainsi que de la viabilité du myocarde sur une carte circulaire en 2D, similaire au modèle 17-segments présentement utilisé en clinique. Cette carte permettra d'associer les tissus cardiaques affectés aux artères coronariennes qui les irriguent. Les étapes sont décrites à la figure 3.
Figure 3 : Étapes de création d‟une carte spécifique au patient montrant à la fois la viabilité du myocarde et les territoires coronariens.
Méthodologie
Les acquisitions des volumes ATDM sont produites par un scanner Sensation 16/64 (Siemens Medical Solution, Forcheim, Allemagne). Pour tous les patients une segmentation de l‟épicarde et de l‟endocarde est obtenue. Une segmentation des coronaires est fournie sous forme de liste de points identifiés manuellement par un cardiologue expérimenté. Les points des coronaires sont disponibles sous trois groupes soient : 1) coronaire gauche (CG), 2) coronaire droite (CD) et 3) coronaire circonflexe (CX). Le clinicien peut fournir d‟autres groupes de coronaires s‟il le désire. Ceci offre
l‟avantage d‟étudier l‟irrigation du myocarde par des branches de coronaires principales. Afin de déterminer les territoires coronariens, nous avons premièrement utilisé un algorithme de croissance de région en choisissant comme points sources les points du modèle surfacique les plus proches des coronaires fournies. Une expansion progressive des régions se produisaient. Cette approche s‟est avérée longue et de plus comportaient le défaut d‟associer un point de la surface au groupe de coronaires dont la région l‟atteignait en premier, ne tenant pas compte des distances sur la surface. Afin de palier à ces limites, nous avons plutôt choisi d‟exploiter l‟algorithme de Dijkstra qui calcule les distances sur des surfaces géodésiques à partir d‟un point source. Nous avons donc fait le calcul de distance pour chaque point de contrôle par rapport à tous les autres points du modèle. L‟association d‟un point se fait à la coronaire la plus proche et la couleur de celle-ci lui est assignée (CG en bleu; CD en rouge; CX en vert; branches en jaune). Nous obtenons ainsi une surface tridimensionnelle subdivisée en régions coronariennes.
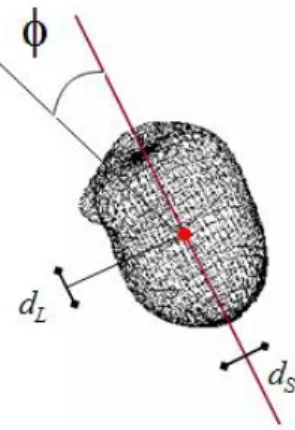
Le recalage des modèles surfaciques segmentés dans les deux modalités permettra de fusionner la structure des coronaires et la viabilité du myocarde. Une initialisation est accomplie à l‟aide d‟une ACP qui met en correspondance les modèles provenant de deux modalités différentes. Une suite de déformations élastiques suivie par des transformations dans l‟espace est effectuée et comparée à l‟aide d‟un calcul d‟information mutuelle. Les valeurs d‟informations mutuelles sont comparées une fois l‟algorithme terminé et la valeur maximale obtenue est celle indiquant la meilleure transformation. Une transformation est composée d‟une translation du point centrale du VG et d‟une rotation autour du long axe du cœur tel que présenté à la figure 5. Les limites du domaine de transformation sont déterminées de manière empirique : 1/8 de la distance du myocarde dans le sens du grand axe, 1/4 dans le sens du petit axe (toutes directions confondues) et 20o d‟inclinaison maximale du modèle par rapport au long axe.
Figure 5 : Domaine de transformation lors du calcul de l‟information mutuelle.
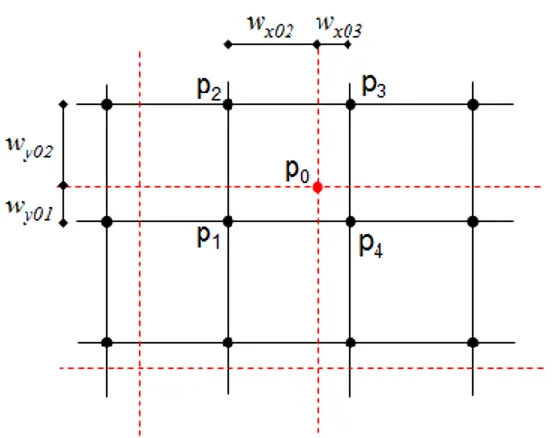
La viabilité du myocarde est visible dans des volumes IRM-RT en analysant les intensités du signal des images. Les images ont été acquises à l‟aide d‟une machine à 1.5 Tesla de modèle Sonata (Siemens Medical Solutions, Erlangen, Allemagne). Les images sont acquises environ 20 minutes après avoir administré l‟agent de contraste. L‟étude de la viabilité est effectuée de manière trans-murale (c'est-à-dire entre l‟épicarde et l‟endocarde) en analysant les intensités contenues dans le volume IRM-RT. Les intensités traversées entre un point du modèle de l‟endocarde et son homologue sur l‟épicarde en termes de coordonnées polaires (voir figure 4) sont cumulées et restent intactes.
Figure 4 : Évaluation de la viabilité trans-murale à l‟aide de modèles segmentés et identification des coordonnées polaires de chaque point.
La projection des territoires coronariens et la viabilité du myocarde recalé sur une carte circulaire 2D se fait par projection de coordonnées polaires 3D en 2D. Les anneaux de différentes élévations par rapport à l‟apex sur le myocarde sont projetés sur le disque à une distance proportionnelle du centre tel que montré à la figure 6. Cette projection place le septum vers la gauche du disque et la disposition des coronaires est similaire au modèle à 17-segments (voir figure 6). Le recalage établi entre les volumes permet de conserver la correspondance de régions entre les deux modalités sur la carte 2D suite à la projection.
Figure 6 : Projection 3D vers 2D (image de gauche) et orientation du modèle projeté (image du milieu et de droite).
Résultats
Les territoires coronariens sur la surface du myocarde ont été calculés en 3D puis projetés vers la carte 2D. Les résultats pour le patient 1 et 2 sont montrés à la figure 7. Un quatrième groupe est formé par une branche de la CG pour le patient 1. Le tableau 1 compare les territoires coronariens calculés selon notre méthode avec le modèle de territoires obtenu à l‟aide de la méthode Green Lane. Par la suite le même calcul est effectué pour comparer le modèle 17-segments au modèle Green Lane. L‟aire des surfaces correspondantes est divisée par la surface totale puis multipliée par 100%.
(a) (b) (c) (d)
Figure 7 : Territoires pour le Patient 1 en 3D et sur une carte 2D avec quatre groupes de coronaires (a,b) et pour le patient 2 selon notre méthode (c) comparé au résultat de la
méthode Green Lane.
Tableau 1 : Comparaison en pourcentage de correspondance des territoires coronariens calculés selon notre méthode ainsi que le modèle à 17-segments avec le résultat de la méthode Green Lane.
Calculé vs. Green Lane 17-segment vs. Geen Lane
Patient 1 95.28 79.10
Patient 2 83.14 73.00
Patient 3 87.17 81.70
Patient 4 84.80 81.40
Moyenne 87.59 78.80
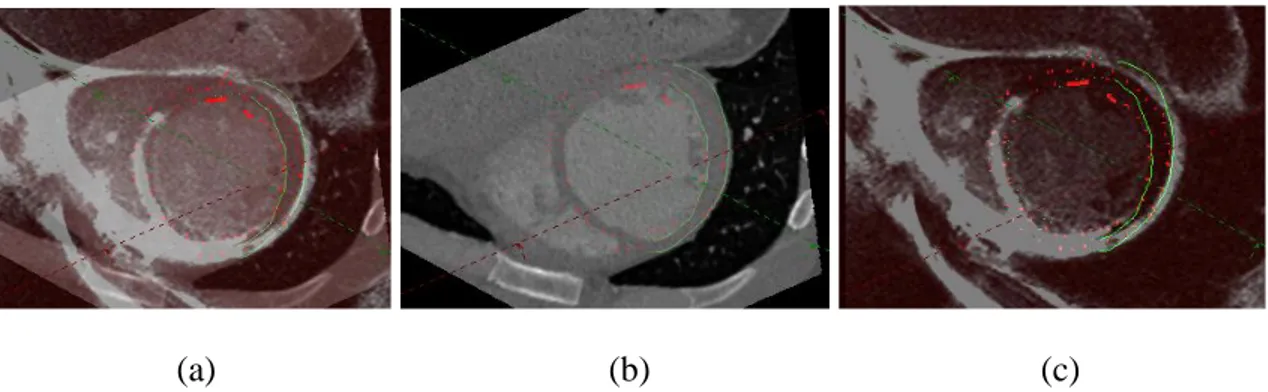
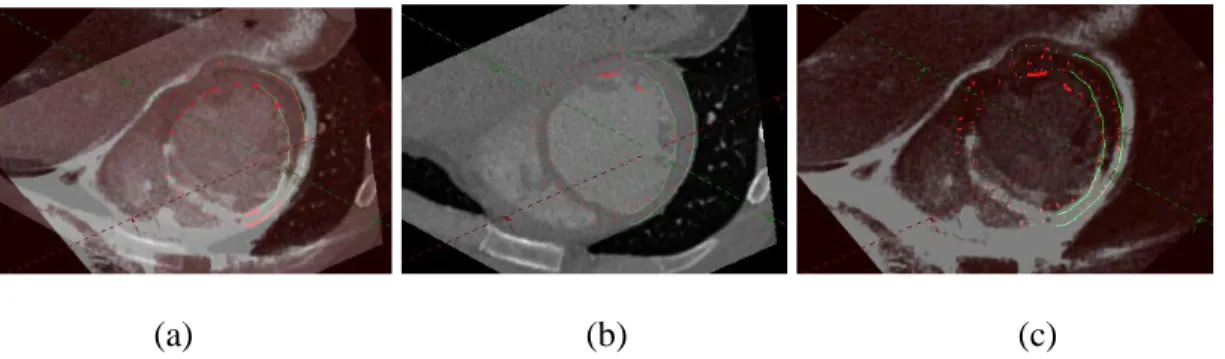
Un exemple de recalage rigide par PCA est montré à la Figure 8. Une déformation des modèles par TPS est montré à la Figure 9. L‟alignement des volumes avant le recalage final est montré à la figure 10 suivit par un exemple de résultat final de recalage obtenu à l‟aide de l‟information mutuelle (Figure 11).
Figure 8 : Modèles surfaciques suite au recalage par analyse de composantes principales. Le modèle rouge indique la surface dans l‟IRM-RT et le vert dans le volume CT.
Figure 9: déformation des modèles surfacique suite à TPS.
(a) (b) (c)
Figure 10 : Aligment avant recalage par information mutuelle pour le patient 1 : les deux volumes superposés (a), CT (b) et IRM-RT (c).
(a) (b) (c)
Figure 11 : Résultat final de recalage pour le patient 1 : les deux volumes superposés (a), CT (b) et IRM-RT (c).
Les résultats de projection de viabilité sont montrés à la figure 12 pour les patients 1, 3, 5 et 6. Dans le cas où le modèle surfacique couvre une surface qui dépasse les limites du volume DEMR, certains points ne peuvent pas se faire assigner une intensité vue l‟absence d‟information de viabilité. Ceci correspond à la section bleu sur les modèles de viabilité. La carte de perfusion coronarienne du myocarde jumelée à la projection de viabilité est montrée pour deux patients à la figure 13. Il est possible de percevoir une perte de viabilité au niveau de la CG pour le patient 1 (figure 13 a), ce qui est effectivement le cas chez ce patient qui a un blocage à 70% de cette coronaire.
(a) (b)
Figure 13: Modèle de perfusion coronarienne du myocarde sur la viabilité myocardique trouvé selon notre méthode pour le Patient 1 (a) et pour le Patient 3 (b).
Conclusion
Nous avons réussi à créer une carte spécifique au patient où la perfusion coronarienne du myocarde (et donc les territoires coronariens) est visible et fusionnée avec l‟information de la viabilité du myocarde. Par manque de disponibilité de données nous n‟avons pas pu représenter la carte complète pour tous les patients. Les territoires obtenus pour les patients correspondent en général au modèle obtenu par le clinicien à l‟aide de la méthode Green Lane. De plus la carte finale permet bien d‟identifier les zones de perte de viabilité myocardique en les associant aux coronaires responsables de leur irrigation. Par contre, il est possible d‟observer de la distorsion sur les anneaux extérieurs de notre modèle. De plus, les cliniciens qui ont évalué notre modèle comprennent l‟image globale mais éprouvent des difficultés à interpréter la viabilité. Le recalage que nous avons utilisé est de plus limité. Premièrement il est difficile d‟assurer une capture d‟image au même instant du cycle cardiaque, même lorsque contrôlé avec un électrocardiogramme. La présence d‟agent de contraste dans le myocarde d‟images IRM-RT et son absence pour les images ATDM (dans cette modalité il n‟est présent que dans les coronaires) rend le
recalage par information mutuelle plus difficile. De plus le modèle de déformation que nous utilisons est déduit à partir du myocarde et ne tient donc pas compte des voxels avoisinants.
Les résultats qualitatifs que nous obtenons indiquent un recalage optimal mais les différences entre les solutions de déformations possibles sont souvent non significatives, ce qui nous pousse à croire que nous détectons un recalage maximal sans pouvoir obtenir un niveau de précision satisfaisant. La méthode d‟identification des artères coronariennes reste à raffiner puisque la segmentation de ces structures est effectuée manuellement par un expert.
TABLE OF CONTENTS
DÉDICACE ...III ACKNOWLEDGEMENTS ... IV RÉSUMÉ ... V ABSTRACT ... IX CONDENSÉ ... XIII TABLE OF CONTENTS ... XXX LIST OF TABLES ... XXXIII LIST OF FIGURES ... XXXIV LIST OF FIGURES ... XXXIV LIST OF APPENDICES ... XLI LIST OF ABBREVIATIONS ...XLII INTRODUCTION ...1 CHAPITRE 1 LITTERATURE SURVEY ...5 1.1 Anatomy, physiology and function of the healthy heart ... 5 1.2 Coronary Artery Disease... 12 1.3 Medical imaging in CHD ... 16 1.4 The 17-segment model ... 27 1.5 Interventions in presence of CHD ... 31 1.6 Multimodal registration of medical images ... 37 1.6.1 Principal Component Analysis ... 381.6.2 Mutual Information ... 40 1.6.3 Thin Plate Spline ... 45 1.6.4 Multimodal registration of cardiac images ... 47 1.7 Myocardium segment model... 49 1.8 Research objectives ... 51 CHAPITRE 2 METHODOLOGY ...54 2.1 Coronary territories from CTA images ... 55 2.2 Fusion of structural and functional information ... 60 2.2.1 Feature-based Initialization of registration ... 62 2.2.2 Free form deformation of surfaces with Thin Plate Spline ... 64 2.2.3 Multimodal Registration Based on Intensities ... 66 2.3 Myocardial viability from DEMR ... 72 2.4 Creation of Viability Maps from 3D to 2D projection ... 73 CHAPITRE 3 RESULTS ...79 3.1 Coronary territories ... 79 3.2 3D Registration ... 93 3.2.1 Registration based on Principal Components ... 93 3.2.2 Thin Plate Spline-based Registration ... 95 3.2.3 Mutual information and final registration results ... 96 3.3 Myocardial Function from DEMR... 107 3.4 Viability Map ... 115 CHAPITRE 4 DISCUSSION ...117
4.1 Coronary Territories... 117 4.2 Registration of perfusion territories over viability... 118 4.3 Viability map ... 120 4.4 Projection of structure and function from 3D to 2D ... 120 CONCLUSION ...122 REFERENCES ...125 APPENDIX A - PUBLICATIONS ...147
LIST OF TABLES
Table 2-1: Coronary color code. ... 59 Table 3-1: Comparison as a percentage of correspondence of our computed coronary territory maps and the 17-Segment model to the map obtained with the Green Lane method as the ground truth. ... 93 Table 3-2: Numerical results after mutual information registration for Patient 1. ... 99 Table 3-3: Numerical results after mutual information registration for Patient 3. ... 101 Table 3-4 : Numerical results after mutual information registration for Patient 5. ... 104 Table 3-4 : Numerical values after mutual information registration for Patient 6... 107
LIST OF FIGURES
Figure 1.1: Heart Anatomy: four chambers, valves (a) and veins, arteries, vena cava (b) [6]. ... 6 Figure 1.2: vertical (a) and horizontal (b) long axis view of the heart [35]. ... 8 Figure 1.3 : View of the heart in the short axis plane [35]. ... 8 Figure 1.4: Coronary tree: right (a) and left (b) dominance [10]. ... 9 Figure 1.5: Cardiac cycle and electrocardiogram (ECG) [20]. ... 12 Figure 1.6: Atherosclerosis: accumulation of plaque inside a coronary [29]. ... 14 Figure 1.7 Atherosclerosis: schematic view of lesions types ... 15 Figure 1.8 : Schematic representation of coronary angiography [40], [41] . ... 18 Figure 1.9 : Orientation of nuclei in a normal environment (a) and in the presence of an external magnetic field B0 (b) [97]... 21
Figure 1.10: Magnetization in the presence of a constant magnetic field (a), with parallel or anti-parallel direction (b), and orientation of the spin direction (c) [97]. ... 22 Figure 1.11: Difference in energy level of nucleus with application of an external magnetic field B0. ... 23 Figure 1.12: Components of the net magnetization M after applying an RF signal of 900
and the oscillatory effect on the vector after its removal [97]. ... 24 Figure 1.13: Free induction decay, the signal captured upon return of the net magnetization M towards a B0 direction after removal of an RF signal [97]. ... 25
Figure 1.14: Captured signal after a spin-echo sequence [97]. ... 25 Figure 1.15: Selecting a slice to image with MRI. ... 26 Figure 1.16: Slice thickness with different magnetic field strength. ... 27
Figure 1.17: The 17-segment model to identify anatomical structures of the heart. The colors of the original model have been modified in order to associate each concentric ring to a specific area of the LV: apex (white), apical (red), mid-cavity (blue) and basal (green). ... 29 Figure 1.18: The 17-segment model with color coded areas relating to typical coronary distribution, and the legend associating segments of the model to anatomical LV location. ... 30 Figure 1.19: Coronary artery bypass graft: saphenous vein, radial artery and internal mammary artery bypass example [51]. ... 33 Figure 1.20: Cardiac catheterization [45]. ... 34 Figure 1.21: Balloon angioplasty (a) and stent placement (b) [46]. ... 35 Figure 1.22: Chest incision through the sternum (a), or between the ribs (b) [50]. ... 36 Figure 1.23 : Joint histogram images where values found in the reference image are placed over the abscissa axis and those from the moving image are placed on the ordinate axis. The joint histograms were created from identical CT images, perfectly aligned in (a) and with a rotation R applied to one of the images, R = 5 (b) and R = 10 (c). ... 41 Figure 1.24 (a) The 17-Segment Model: cross sections of the LV perpendicular to long axis (apex, apical, mid and basal portions). The septum is to the left. Three regions are found to be typically irrigated by the Left Anterior Descending (LAD), the Left Circumflex (CFX) and the Right Coronary Artery (RCA). (b) Green Lane Method: an experienced cardiac radiologist manually transcribes the coronary tree, with branch vessels, from a coronary angiogram onto a bull‟s eye plot. The plot is then divided into coronary distribution regions based on these projections (LAD blue, CFX yellow, RCA pink). ... 51
Figure 1.25 : Creation of a patient-specific diagnosis tool in the presence of coronary artery disease. Each step of the current project is written in bold. ... 53 Figure 2.1: schematic representation of the LV in the short axis plane. ... 63 Figure 2.2 : Points from the LV surface from CTA (in black) are matched to DEMR surface points (in red) by selecting those that have the smallest distance angle to MR points, in this case b since (b <a). ... 65 Figure 2.3: Grid correspondence during registration and distance weights for histogram calculation. ... 70 Figure 2.4: Maximal tilt and translation for transformation of moving image while searching for maximal value of mutual information. ... 72 Figure 2.5: Schematic representation of viability estimation. Intensities are averaged along a segment s between a point belonging to the epicardium and another belonging to the endocardium ... 73 Figure 2.6 : LV surface model and schematic representation of spherical coordinates calculated for each of the surface points (a) and polar projection from 3D to the 2D map. ... 75 Figure 2.7: Projection of the 3D geodesic model of the LV onto a 2D disk in order to create the viability map. The outer ring of the map to the right corresponds to the basal area of the LV, projection of the LCX territory (in green) is expected to lie to the upper right side of the model, and the RCA (in red) is expected to occupy the lower left area of the map. ... 76 Figure 2.8: An example of result for the Green Lane method (LAD blue, LCX yellow and RCA pink) (to the left) compared to the 17-segment model (LAD blue, LCX green, RCA brown) (to the right)... 78
Figure 3.1: The CTA volume for Patient 1 with the geodesic model of the LV in green. The white lines describe a coordinate system for the left ventricle. ... 80 Figure 3.2: Epicardium (a) and endocardium (b) models of the LV identified in the CTA for Patient 1. ... 81 Figure 3.3: Color coded coronary points delineated by a physician seen over a volume rendered view of CTA. A coronary stent is visible (black arrow) close to the base of the heart in the LAD. ... 82 Figure 3.4: Color coded coronaries for patient 1 in 3D (a) and over the geodesic model of the epicardium (b). ... 82 Figure 3.5: Color coded coronaries in 3D with a four group classification (yellow is for branch vessel off from the LAD). ... 83 Figure 3.6: Result of automatic computation of coronary territories for patient 4 with 3 group classification: LAD (blue), LCX (green), RCA (red) in 3D with coronary segmentation (a) and in 2D map (b). The black arrow points the apex. ... 84 Figure 3.7: Coronary territories for patient 1 with a 4 group classification: LAD (blue), RCA (brown), LCX (green) and a branch off the LAD (yellow) in 3D (a) and on a 2D territory map (b). ... 84 Figure 3.8: CTA volume of Patient 2 (a), with LV segmentation (b-c). LV segmentation model: epicardium (d) and endocardium (e). ... 85 Figure 3.9: Color coded coronaries for Patient 2, with 3 coronaries: LAD (blue), LCX (yellow) and RCA (red). ... 86 Figure 3.10: Result of the automatic computation of coronary territories for Patient 2 (to the left) and territory map following the Green Lane method.The black arrow points to the apex. The yellow arrow points to a variation with regards to the Green Lane model... 86
Figure 3.11: CTA volume of patient 3 (a), with LV segmentation (b-c). LV segmentation model: epicardium (d) and endocardium (e). ... 87 Figure 3.12: Color coded coronaries for Patient 3, with 3 coronaries: LAD (blue), LCX (yellow) and RCA (red). ... 88 Figure 3.13: Color coded coronaries for patient 3, with 3 coronaries: LAD (blue), LCX (yellow) and RCA (red). ... 88 Figure 3.14: Result of automatic computation of coronary territories for patient 3 with previous method. ... 89 Figure 3.15: CTA volume of Patient 4 (a), with LV segmentation (b-c). LV segmentation model: epicardium (d) and endocardium (e). ... 90 Figure 3.16: Color coded coronaries: LAD (blue), LCX (yellow) and RCA (red) over LV model extracted from CTA (green) for Patient 4. ... 91 Figure 3.17: Color coded coronary territories for patient 4 over LV model from CTA, with 3 coronaries: LAD (blue), LCX (green) and RCA (red)... 91 Figure 3.18: Comparison of our CT-derived model for patient 4 (a) with the Green Lane (b) and the 17-segment model (c). The black concentric lines drawn in figure (b) have been placed for comparison purposes. ... 92 Figure 3.19: Geodesic models of DEMR and CTA after PCA registration for Patient 1 in 3D (a) and in a short axis view (b). ... 94 Figure 3.20: Result of registration initialization using principal components for Patient 1. The black arrow seen in the rendered volume view indicates the location of misalignment of LV surface points from DEMR and CTA. The top left view shows the difference in orientation noticeable with the orientation of the RV in DEMR (red arrow) and CTA (green arrow). ... 95
Figure 3.21: Geodesic models after TPS algorithm for patient 1. Only CTA volume is shown for clarity of presentation. ... 96 Figure 3.22: DEMR and CTA volume for Patient 1 before registration. ... 97 Figure 3.23: Registration result for Patient 1. DEMR images (a), CTA volume (b) and overlay of both in the short axis view (c). ... 98 Figure 3.24 : Registration result for Patient 3. ... 100 Figure 3.25 : DEMR and CT for Patient 5 before registration. Arrows indicate position of the RV in DEMR (red) and CT images (green). ... 102 Figure 3.26: Registration result for Patient 5 showing orientation of CTA volume (a), DEMR slice (b) and the actual correspondence of the two (c). ... 103 Figure 3.27: Orientation of images for Patient 6 after principal component analysis and before registration with thin plate spline and mutual information; DEMR (a), CTA (b) and overlay of both images in the short axis view (c). Arrows in (c) indicate the end of lung region in CTA (dashed red line) and DEMR (dashed green line). ... 105 Figure 3.28: Final registration result for Patient 6; CTA (a), DEMR (b) and overlay of both images in the short axis view (c). Dashed lines in (a) and (b) indicate the end of the lung region in CTA (dashed red line) and in DEMR (dashed green line) images. ... 106 Figure 3.29: The volume rendered DEMR of Patient 1 in the short axis view (a) and the same volume with the surface model of the left ventricle (b). ... 108 Figure 3.30: The DEMR volume for Patient 1 with the geodesic model of the LV in red.
... 109 Figure 3.31: Epicardium (to the left) and endocardium (to the right) models of the LV identified in the DEMR for Patient 1. ... 109
Figure 3.32 : Viability map for Patient 1 as computed by our method, in 3D with colored coronaries and in 2D. ... 110 Figure 3.33 : The DEMR volume for Patient 3 (a) with the LV surface points and their interconnections drawn in red (b) (c). ... 111 Figure 3.34 : LV surface model (epicardium to the left and endocardium to the right) from DEMR for Patient 3. ... 111 Figure 3.35 : Viability map for Patient 3 in 3D and over a 2D map. ... 112 Figure 3.36 : DEMR multiplanar reconstruction in the short axis direction for Patient 5.
... 112 Figure 3.37 : Epicardium (to the left) and endocardium (to the right) models of the LV identified in the DEMR for Patient 5. ... 113 Figure 3.38 : Viability in 3D and 2D for Patient 5 as computed by our method. ... 113 Figure 3.39 : DEMR multiplanar reconstruction in the short axis direction for Patient 6 (a) and with LV surface points in red (b) and in a 3D rendered view (c). ... 114 Figure 3.40: LV epicardial (to the left) and endocardium (to the right) surface from DEMR for Patient 6. ... 114 Figure 3.41 : Viability map for Patient 6 in 3D (a) and 2D (b). ... 115 Figure 3.42: Viability map for Patient 1 (a), with overlaid coronary territory borders (b) and for comparison the color coded territory map (c) (LAD blue, LCX green and RCA red). ... 116 Figure 3.43: Coronary territories overlaid viability map for patient 3. ... 116
LIST OF APPENDICES
LIST OF ABBREVIATIONS
AHA American heart association
AV Atrioventricular node
BMS Bare metal stent
CABG Coronary artery bypass graft
CAD Computer aided diagnosis
CT Computer tomography
CTA Computer tomography angiography
CHD Coronary heart disease
DEMR Delayed enhancement magnetic resonance
DES Drug eluting stent
DICOM Digital imaging and communications in medicine
ECG Electrocardiogram
GPU Graphical processing unit
GPVI Generalized partial volume interpolation
IVUS Intravascular ultrasound
LAD Left anterior descending
LCX Left circomflexe
LV Left ventricle
MI Mutual information
MPR Multi-planar reconstruction
MR Magnetic resonance
NN Nearest neighbor
ONCAB On-pump coronary artery bypass
OPCAB Off-pump coronary artery bypass
PCA Principal component analysis
PDA Posterior descending artery
PET Positron emission tomography
PTCA Percutaneous transluminal coronary angioplasty
PVI Partial volume interpolation
RA right atrium
RCA Right coronary artery
RF radio frequncy
RV Right ventricle
SA Sinoatrial node
SAN Short axis normal
SPECT Single photon emission computer tomography
TMR Transmyocardial laser revascularization
TPS Thin plate spline
INTRODUCTION
Coronary heart disease (CHD) can be due to the build up of plaque in the coronary arteries (atherosclerosis) [1] which leads to ischemia, an insufficient supply of blood to the heart wall, which results in myocardial dysfunction. When ischemia remains untreated an infarction may appear (areas of necrosis in cardiac tissues) and consequently the heart‟s contractility is affected. Since the left ventricle (LV) of the heart is responsible for forcing the blood to the entire body, myocardium (heart wall) dysfunction can therefore lead to death. Cardiovascular diseases account for 33.5% of all deaths that occurred in United States in 2005 and CHD is the cause of one of every five deaths that occurred during that year raising this disease as the largest cause of death in United States [2]. Revascularization therapy is an intervention that tries to reestablish a normal blood flow through coronary arteries in an attempt to recover contractile function of the heart wall.
In the context of CHD, medical imaging assists clinicians through computer aided diagnosis (CAD). Knowledge of myocardium viability is helpful prior to any intervention for planning purposes and for predicting the outcome of procedures. Revascularization therapy is only considered when there is hope of recovery for the myocardium. States of the myocardium in case of CHD are hibernation, stunning or scarring [42]. In the first case, the myocytes lessen their contractile activity due to the reduction in blood flow affecting the heart‟s overall contractility. Stunning is a state of myocardium dysfunction which follows a period of ischemia. In this case recovery of myocardial cells contraction is possible. For scarring, the myocytes are permanently damaged and will never recover their contractile property [36]. Perfusion and viability studies allow clinicians to examine the extent and the severity of CHD over the myocardium. Aided by a population-based model, the clinician can relate affected areas of myocardium to coronaries that typically
irrigate this region with blood. However, this model does not fit to every patient whose coronary tree structure might deviate from that of the majority of the population.
After assessing myocardial dysfunction, the clinician can proceed to a catheterization to locate coronary lesions. This consists in inserting a guide wire into the patient‟s artery until it reaches the origin of the heart‟s coronaries. While a series of X-rays is being captured, a contrast agent is administered that will propagate along the coronaries‟ path. The result is a movie showing the dye propagating through the coronaries. In lesion sites, coronaries appear to narrow or are blocked completely in which case the dye stops spreading. This method of evaluation of coronary lesions might result in complications in rare cases, such as the puncture of vessels or adjacent organs or difficulties at the puncture site where the guide wire is first introduced where hematoma could develop.
Different imaging modalities allow visualization of a patient‟s function or anatomy and might be used in CAD in the presence of CHD. Anatomic (or structural) information is available with Computer Tomography Angiography (CTA). A contrast agent is administered through the arm and spreads until it reaches the coronaries. A CT scan is performed at that moment and coronaries appear bright on the resulting images. The surfaces of the myocardium (epicardium and endocardium) are identifiable as well and coronary anatomy of individual patients can be determined by experienced physicians. This modality is however deprived of any functional information and the effect of the disease on the cardiac muscle cannot be studied. Myocardial function, and therefore identification of damaged tissues, is possible with nuclear studies (PET, SPECT), that enhance sites of damaged tissues, as well as delayed enhancement magnetic resonance (DEMR), that enhances dead tissues. The advantage of DEMR over the previous modalities is the non exposure to ionizing radiation. In DEMR, the persistence of a contrast agent in the myocardial cells allows for the identification of myocardium
corresponding to dead tissues since the agent remains longer in dead cells (hypothesized to be due to the slow washout of agent by myocardial cells). The location of dead tissues on images is therefore possible by identifying brighter regions in the myocardium in DEMR images. This modality therefore offers viability information and has proven reliable in highlighting the extent of infarcted myocardium [4].
Intervention for revascularization in the presence of CHD benefits from knowledge of a patients‟ myocardial viability. In standard clinical practice, patients do not typically receive both a CTA and a DEMR (or nuclear study). Rather, the clinician relies on an MR study, followed but a coronary angiogram. The MR or nuclear images allow locating damaged or dead areas over the myocardium. He then refers to a population based model (such as the 17-segment model) that guides him to the highest probable stenosed coronary responsible for the lesion (this could be scar or ischemia). Structural damage to the coronaries may be inferred from CT angiograms. The clinician is interested in locating the coronary arteries including sites of plaque accumulation inside a coronary and that alters blood flow. This procedure involves a catheter insertion, which might imply a possible risk for the patient. Moreover, the individual patient‟s coronary anatomy might deviate from the standard models and lead to misinterpretation of the patient‟s state. Furthermore, the 17-segment model includes the main coronary arteries but not the location of specific diagonal branches.
We aim to fuse both function and structural information to aid in the clinical procedure. The goal of this thesis is therefore to provide a means to determine, in a patient-specific manner, if a patient will benefit from an intervention, such as a revascularization by stent or bypass, and moreover might save a patient from undergoing a catheterization in the case where non-viable (dead) tissue is identified. We make the case that fusing CTA and DEMR (or nuclear) will allow us to answer the question: which coronaries feed which
regions and will those regions benefit from intervention? DEMR is chosen for this study since it does not involve exposure of the patient to ionizing agents and since it has proven reliable for viability studies [4]. Thus we endeavor to create patient-specific 2D viability maps, similar to the 17-segment model and that would allow the physician to visualize the association of regions of myocardium that are found to contain non-viable (dead) or damaged tissue with a particular coronary artery. This involves registration of both structural and functional images from CTA and DEMR respectively. Those modalities have the advantage of being considered non invasive (as opposed to catheterization) and their fusion allows synergistic interpretation of available information.
The second chapter of this thesis describes the anatomy of a healthy heart, as well as CHD and its impact on the heart‟s organs. Therapeutic interventions as well as modalities used are presented as well. In Chapter 3, methods used to create viability maps are listed and the results obtained are shown in Chapter 4. Finally Chapter 5 concludes the work done for this thesis and enumerates possible future work.
CHAPITRE 1
LITTERATURE SURVEY
Myocardial viability and stenosis location (position of obstruction in coronaries) are crucial information to the physician in order to attempt a prognosis of an intervention in the presence of coronary artery disease. To properly describe this pathology, the anatomy and function of the healthy heart will first be presented, followed by a description of the different physiological alterations induced by CHD. A study of currently used modalities and a review of existing methods of registration and of coronary territory estimation will also be presented.
1.1 Anatomy, physiology and function of the healthy heart
The chambersThe heart is located in the thorax, in a sac known as the pericardium between the lungs and composed of four chambers: the right and left atria and the right and left ventricles (Figure 1.1). The interventricular septum (Figure 1.1) delineates the compartments of the left and right ventricles [5]. Valves ensure the correct blood flow direction between the different chambers of the heart and the cavities connected to them. The right atrium and the right ventricle are separated by the right atrioventricular valve, also known as the tricuspid valve. In the same way the left atrium and left ventricle are separated by the mitral valve. The pulmonary valve separates the right ventricle from the pulmonary artery. The aortic valve separates the LV from the aorta.
(a)
(b)
Figure 1.1: Heart Anatomy: four chambers, valves (a) and veins, arteries, vena cava (b) [6].
![Figure 1.7 Atherosclerosis: schematic view of lesions types [27]. Coronary artery at lesion-prone location (a), type II lesion (b), type III or preatheroma (c), type IV or](https://thumb-eu.123doks.com/thumbv2/123doknet/2324167.29894/58.918.335.639.206.761/figure-atherosclerosis-schematic-lesions-coronary-artery-location-preatheroma.webp)
![Figure 1.19: Coronary artery bypass graft: saphenous vein, radial artery and internal mammary artery bypass example [51]](https://thumb-eu.123doks.com/thumbv2/123doknet/2324167.29894/76.918.269.707.209.535/figure-coronary-artery-bypass-saphenous-internal-mammary-example.webp)