UNIVERSITÉ DE MONTRÉAL
MODELING AND EXPERIMENTAL VALIDATION OF THE PERFORMANCE OF PHASE CHANGE MATERIAL STORAGE TANKS IN BUILDINGS
KATHERINE D’AVIGNON
DÉPARTEMENT DE GÉNIE MÉCANIQUE ÉCOLE POLYTECHNIQUE DE MONTRÉAL
THÈSE PRÉSENTÉE EN VUE DE L’OBTENTION DU DIPLÔME DE PHILOSOPHIAE DOCTOR
(GÉNIE MÉCANIQUE) DÉCEMBRE 2015
UNIVERSITÉ DE MONTRÉAL
ÉCOLE POLYTECHNIQUE DE MONTRÉAL
Cette thèse intitulée :
MODELING AND EXPERIMENTAL VALIDATION OF THE PERFORMANCE OF PHASE CHANGE MATERIAL STORAGE TANKS IN BUILDINGS
présentée par : D’AVIGNON Katherine
en vue de l’obtention du diplôme de : Philosophiae Doctor a été dûment acceptée par le jury d’examen constitué de :
M. PELLETIER Dominique, Ph. D., président
M. KUMMERT Michaël, Doctorat, membre et directeur de recherche M. PASQUIER Philippe, Ph. D., membre
DEDICATION
To Sylvain, because you stayed put whilst I jumped into the void,
you smiled while I panicked, you fed me when pauses were rare, you let me grow and learn at my own rhythm, thank you.
À Sylvain, parce que tu es resté fixe alors que je sautais dans le vide,
que tu m’as souris alors que je paniquais, que tu m’as nourri quand les pauses se faisaient rares, que tu m’as laissé grandir et apprendre à mon rythme, merci.
“We have to continually be jumping off cliffs and developing our wings on the way down.”
ACKNOWLEDGEMENTS
I started this doctoral project quite naively. Reaching this point has been like crossing the desert; an apparently infinite struggle to no end. Somehow, here I am with a complete thesis. This could not have been possible without the help and support of many, to whom I address these few words.
To start, I must give my sincere thanks to my thesis supervisor, Professor Michaël Kummert. He trusted me with his laboratory and did not despair when things went awry. He gave me the opportunity to try different things, to delve into side-tracks and let me find my way on my own. He remained patient, calm and supportive while I freaked out, lost time and broke test tube after test tube. It is because of him that I got into this doctorate and thanks to him that I got through it. I must underline the support and encouragement I received from Professors Michel Bernier and
Philippe Pasquier throughout the years. Thank you for the advice, the time and the material you
lent out so earnestly. I should also note the helpful advice of Professors Bantwal Rabindranath
Baliga and Bruno Detuncq.
I would like to thank the students who participated in various parts of this project: Antonin
Paquette-Rufiange, Dustin Goyer, Jonathan Lazaro, Christophe Chilini, Lin Chun Pang, Eva Ngansop and François Mercier-Boulet. Though you might have felt like small cogs in a big
wheel, your little nudges of progress helped nonetheless.
My thanks go out to the other MECBAT students, past and present, with whom I have shared unforgettable moments: Aurélie Verstraete, Romain Jost, Marilyne Rancourt-Ouimet, Mathieu
Lévesque, Antoine Courchesne-Tardif, Matthieu Grand, Massimo Cimmino, Parham Eslami-Nejad, Humberto Quintana, Kun Zhang, Samuel Lettelier-Duchesne, Simon Maltais Larouche, Bruno Marcotte; and all the others. Special thanks to Benoit Delcroix who, like me, shared in the
“joy” of modelling phase change materials.
I would like to mention the technical assistance of Philippe Massé in the commissioning of the Semi-Virtual Laboratory and Thierry Lafrance from Mëkanic for his contribution to the instrumentation of the PCM capsule.
Finally, I would like to thank Professors Andreas Athienitis, Dominique Pelletier and Philippe
Pasquier for having accepted to be members of the jury.
This project was made possible with funding from the “Fonds de recherche du Québec – Nature
et technologies (FRQNT)”, of the NSERC Smart Net-Zero Energy Buildings Strategic Research Network (SNEBRN) and the Canadian Foundation for Innovation.
My warmest thanks to all, Katherine D’Avignon Montreal, December 2015
RÉSUMÉ
Le stockage d’énergie thermique dans les bâtiments permet d’atténuer les pointes d’appel de puissance sur le réseau électrique et de synchroniser la demande énergétique à la disponibilité de ressources énergétiques renouvelables, telle l’énergie solaire. Les matériaux à changement de phase (MCP) peuvent être utilisés afin de permettre un tel stockage d’énergie thermique. Ceux-ci offrent une haute densité de stockage énergétique (principalement sous forme d’énergie latente) et un changement de phase à température quasiment constante.
L’intégration de MCP dans un réservoir où circule un fluide caloporteur permet de créer un système de stockage actif. La charge et décharge énergétique du réservoir peuvent alors être contrôlées par le débit du fluide caloporteur envoyé dans le réservoir ou vers un contournement. Afin d’assurer une performance adéquate du réservoir de stockage à MCP dans un bâtiment, le comportement dynamique de celui-ci doit être prévisible. Or, le design du réservoir aura un impact crucial sur son fonctionnement : la température de changement de phase du matériau, la géométrie du réservoir et des capsules de MCP influenceront le comportement dynamique de celui-ci. Afin de permettre un design adéquat du réservoir, des outils permettant la simulation énergétique de tels systèmes sont nécessaires.
Or, la modélisation du changement de phase, souvent basée sur une relation entre l’enthalpie et la température du matériau, présente certaines difficultés. Elle est, entre autre, limitée par les informations rendues disponibles par les manufacturiers, qui sont souvent incomplètes ou erronées. Les MCP ont aussi tendances à se comporter différemment lors de leur fusion et lors de leur solidification (i.e. présence d’hystérèse) et ils exhibent parfois des phénomènes de surfusion dont l’occurrence est plus stochastique que déterministe. De plus, peu de données expérimentales existent sur le comportement dynamique de tels réservoirs. Ainsi, les modèles numériques actuels sont limités à quelques géométries et rarement validés expérimentalement. Toutes ces problématiques sont soulevées dans cette thèse et des solutions sont abordées.
La première partie (chapitre 4) offre une contribution à une méthode de caractérisation normalisée des matériaux à changement de phase, à travers une évaluation critique du traitement des données de la méthode « T-History ». Une proposition est faite quant à la variante qui devrait être adoptée pour déterminer la courbe enthalpie-température de MCP présentant une surfusion
importante afin de fournir toutes les informations nécessaires pour la simulation numérique de leur comportement.
La deuxième partie (chapitre 5) se concentre sur les essais expérimentaux détaillés d’un réservoir horizontal contenant des capsules rectangulaires de matériaux à changement de phase à échelle réelle. Les essais expérimentaux effectués sont minutieux: 14 conditions d’opérations distinctes sont testées, faisant varier le débit d'entrée, l'intervalle de température ainsi que le profil de la charge dans le réservoir. Trois répétitions de chaque test permettent d’étudier la variabilité des résultats.
Finalement, la dernière partie (chapitre 6) se concentre sur le développement ainsi que la validation numérique et expérimentale d’un nouveau modèle permettant la simulation de réservoirs de MCP. Le modèle est basé sur une discrétisation semi-explicite et représente le changement de phase du matériau par la méthode enthalpique, permettant aussi la simulation d’un MCP avec de l’hystérèse entre ses processus de fusion et de solidification. Le modèle est d’abord validé numériquement par comparaison de ses résultats avec ceux de modèles détaillées à éléments-finis. Les données expérimentales du chapitre précédent sont ensuite utilisées pour effectuer une validation expérimentale exhaustive. La comparaison des résultats numériques aux données expérimentales selon les principes de la ligne directrice 14 de l’American Society of Heating, Refrigerating and Air-conditioning Engineers confirme la validité des résultats du modèle pour cette géométrie.
ABSTRACT
Thermal energy storage in buildings can attenuate peak power demand to the electric grid and synchronize the heating or cooling load to the availability of renewable energy, such as solar energy. Phase change materials (PCM) can be used to allow such storage of thermal energy. They offer high energy storage density (mainly through latent energy) and a quasi-constant phase change temperature.
The integration of PCMs in a tank where a heat transfer fluid can circulate allows the creation of an active thermal storage system. Charging and discharging energy from the reservoir can be controlled by directing the heat transfer fluid into the tank or towards a by-pass. To ensure an adequate performance of the PCM storage tank in a building, its dynamic behaviour must be predictable. The PCM tank’s design will have a crucial impact on its operation: the material’s phase change temperature, the geometry of the tank and PCM capsules will influence the transient behaviour of the tank. To allow an adequate design of the tank, tools allowing the energy simulation of such systems are required.
However, the modelling of phase change itself, often based upon a relation between the enthalpy and temperature of the material, presents some difficulties. It is, amongst other things, limited by the information made available by manufacturers, which are often incomplete or erroneous. PCMs have also the tendency to behave differently during their fusion and solidification processes (i.e. presence of hysteresis) and they exhibit at times a phenomenon of supercooling whose occurrence tends to be more stochastic than deterministic. Moreover, little experimental data exists on the transient behavior of such PCM storage tanks. The existing numerical models are limited to a few geometries and have rarely been validated experimentally. All these problems are explored in this thesis and solutions are addressed.
The first section of this thesis (Chapter 4) offers a contribution towards a standardised characterisation method for phase change materials through a critical evaluation of the data processing in the T-History Method. A proposal is made concerning the data processing variant which should be adopted to determine the enthalpy-temperature curve of PCMs presenting an important degree of supercooling so that all the required information necessary for its numerical simulation is available. The second section (Chapter 5) concentrates on the detailed experimental testing of a real-scale horizontal storage tank containing rectangular PCM capsules. The
experimental tests are thorough: 14 different operating conditions are tested with combinations of different inlet flowrates, temperature intervals and load profiles to the tank. Three repetitions of each test allow the assessment of the variability of results.
Finally, the last section (Chapter 6) focusses on the development as well as the numerical and experimental validation of a new model for the simulation of PCM storage tanks. The model is based on a semi-explicit discretization and represents phase change in the material by the enthalpy method, allowing the simulation of a PCM with hysteresis between its fusion and solidification processes. The model is first validated numerically by comparing its results to those of detailed finite-element models. The experimental data from the previous chapter are then used to perform an exhaustive experimental validation. The comparison of numerical results to the experimental measurements following the principles of Guideline 14 from the American Society of Heating, Refrigerating and Air-conditioning Engineers confirms the validity of the model results for the studied geometry.
TABLE OF CONTENTS
DEDICATION ... III ACKNOWLEDGEMENTS ... IV RÉSUMÉ ... VI ABSTRACT ... VIII TABLE OF CONTENTS ... X LIST OF TABLES ... XIV LIST OF FIGURES ... XV LIST OF SYMBOLS AND ABBREVIATIONS... XIX LIST OF APPENDICES ... XXICHAPTER 1 INTRODUCTION ... 1
CHAPTER 2 LITERATURE REVIEW ... 5
2.1 Modeling the phase change process ... 5
2.1.1 Enthalpy method ... 6
2.1.2 Effective heat capacity method ... 8
2.1.3 Issues with modelling the phase change process ... 10
2.2 Modeling PCM encapsulated in flat, rectangular capsules ... 13
2.2.1 Gaseous heat transfer fluid ... 13
2.2.2 Liquid heat transfer fluid ... 14
2.3 Experimental data on phase change material thermal storage tanks ... 16
2.4 Applications of PCMs in building systems ... 17
2.4.1 PCM in construction material ... 18
2.4.2 Applications in solar energy systems ... 19
2.4.4 Free cooling applications ... 21
2.4.5 Follow-up of real applications in buildings... 22
2.5 Conclusion ... 24
CHAPTER 3 OBJECTIVES AND THESIS ORGANISATION ... 25
3.1 Thesis objectives ... 25
3.2 Thesis organisation ... 26
CHAPTER 4 ARTICLE 1: ASSESSMENT OF T-HISTORY METHOD VARIANTS TO OBTAIN ENTHALPY-TEMPERATURE CURVES FOR PHASE CHANGE MATERIALS WITH SIGNIFICANT SUBCOOLING ... 28
4.1 Abstract ... 28
4.2 Introduction ... 29
4.3 Literature review: PCM characterization methods ... 31
4.4 Experimental test ... 32 4.4.1 Setup ... 32 4.4.2 Procedure ... 33 4.4.3 Experiment ... 34 4.5 Results ... 36 4.5.1 T-history method – Z ... 36 4.5.2 Time-delay method – M ... 38
4.5.3 Sandness & Rekstad’s Method – SR ... 41
4.5.4 Thermal-delay method – K ... 44
4.6 Discussion and recommendations ... 47
4.7 Conclusion ... 49
4.8 Acknowledgements ... 50
4.9.1 Subscript ... 50
4.10 References ... 51
CHAPTER 5 ARTICLE 2: EXPERIMENTAL ASSESSMENT OF A PHASE CHANGE MATERIAL STORAGE TANK ... 55
5.1 Abstract ... 55
5.2 Keywords ... 55
5.3 Introduction ... 56
5.4 Experimental set-up ... 57
5.5 Test methodology ... 61
5.6 Results and discussion ... 62
5.6.1 Step tests ... 62
5.6.2 Interrupted tests ... 75
5.6.3 Fixed temperature change rate tests ... 78
5.6.4 Constant power tests ... 80
5.7 Comparison of useful energy from the tank for all tests ... 82
5.8 Conclusion ... 85
5.9 Acknowledgments ... 86
5.10 References ... 87
CHAPTER 6 ARTICLE 3: MODELING HORIZONTAL STORAGE TANKS WITH ENCAPSULATED PHASE CHANGE MATERIALS FOR BUILDING PERFORMANCE SIMULATION 91 6.1 Abstract ... 91
6.2 Introduction ... 91
6.3 Mathematical model ... 93
6.3.2 Negligible flow conditions | Pe < 2 ... 100
6.3.3 Enthalpy-temperature curve and hysteresis ... 101
6.4 Preliminary study through detailed model analysis ... 103
6.4.1 Fluid flow ... 103
6.4.2 Heat transfer surface ... 109
6.4.3 Lateral conduction between PCM nodes ... 110
6.4.4 Grid and time step analysis ... 110
6.5 Model adjustments ... 113
6.6 Experimental validation ... 115
6.6.1 Experimental set-up ... 115
6.6.2 Comparison to experimental results ... 118
6.7 Discussion ... 124
6.8 Conclusion ... 125
6.9 Acknowledgements ... 126
6.10 References ... 126
CHAPTER 7 GENERAL DISCUSSION ... 130
CHAPTER 8 CONCLUSION AND RECOMMENDATIONS ... 133
BIBLIOGRAPHY ... 135
LIST OF TABLES
Table 4.1: PCM properties specified by manufacturer ... 34
Table 5.1: PCM properties of S27 as specified by the manufacturer ... 58
Table 5.2: Duration of the useful power output ... 71
Table 5.3: Total energy variation in the test for each process and operating condition ... 84
Table 6.1: Material characteristics ... 105
Table 6.2: Data for simulation test cases ... 105
Table 6.3: Characteristics of phase change material S27 ... 117
Table 6.4: Validation metrics for all PCM tank tests ... 120
Table A.1: S27 properties supplied by the manufacturer ... 152
Table B.1: List of temperature sensors ... 160
Table B.2: Measurement accuracy for NI 9217 specified by the manufacturer ... 163
Table B.3: Detailed calculation of random uncertainty for thermocouple TC - 12 ... 165
Table B.4: Maximum combined uncertainty for every sensor ... 167
Table B.5: List of uncertainty sources, associated uncertainty reduction methods and conclusion ... 169
LIST OF FIGURES
Figure 1-1: Schematic of different PCM storage tank geometries a) flat plate, b) shell-and-tube with crossflow, c) cylindrical capsules, d) coil submerged in PCM, e) packed bed of spherical capsules and f) heat pipe ... 3 Figure 2-1: Evolution of a material’s specific enthalpy as a function of material temperature for a)
a pure substance and b) a binary mixture ... 7 Figure 2-2: Evolution of a material’s apparent specific heat capacity as a function of material
temperature ... 9 Figure 2-3: Evolution of a material’s specific enthalpy as a function of material temperature in
the presence of a) supercooling or b) hysteresis ... 11 Figure 4-1: Temperature evolution during a full cycle of the T-history experimental procedure . 34 Figure 4-2: T-history data from six of the PCM samples tested for the third cooling and heating
cycle ... 35 Figure 4-3: Division of the T-history curves following the method Z for a) the reference sample
and b) the PCM sample ... 37 Figure 4-4: T-history curve of PCM sample indicating two alternate ways of treating subcooling
in method M ... 39 Figure 4-5: Enthalpy-temperature curves resulting from the method presented by method M
according to the way subcooling is treated ... 40 Figure 4-6: Comparison of enthalpy-temperature curves for every PCM sample, for both heating
and cooling for method M ... 41 Figure 4-7: Comparison of enthalpy-temperature curves for every PCM sample by method SR . 42 Figure 4-8: Method K for a) the reference sample and b) the PCM sample ... 44 Figure 4-9: Effective specific heat curves as a function of temperature for sample K19, calculated
with method K using a 10 s time interval for a) heating and b) cooling process data ... 46 Figure 4-10: Enthalpy as a function of temperature for all samples, as per method K, for both
Figure 4-11: Enthalpy-temperature curves produced by method M (with absolute temperature interval), method K and method SR for all PCM samples, from both cooling and heating test
data ... 48
Figure 5-1: Instrumented PCM capsule ... 58
Figure 5-2: PCM tank viewed from the inlet, including 1) perforated plate, 2) capsule support and 3) PCM capsules ... 59
Figure 5-3: Position of the instrumented PCM capsule in the tank as viewed from the outlet ... 59
Figure 5-4: Schematic representation of the PCM tank testing zone of the Semi-Virtual Lab ... 60
Figure 5-5: Temperature profiles for a heating test at v = 0.3 L/s and ΔT = 10 °C ... 63
Figure 5-6: Temperature profiles for a cooling test at v = 0.3 L/s and ΔT = 10 °C ... 63
Figure 5-7: PCM temperature measured by "long" sensor as a function of time for all cooling and heating test repetitions ... 65
Figure 5-8: PCM temperature measured by the "short" sensor as a function of time for all heating and cooling test repetitions ... 66
Figure 5-9: Outlet fluid temperature from PCM tank as a function of time for all heating and cooling test repetitions ... 68
Figure 5-10: Evolution of instantaneous tank power output through logarithmic time ... 69
Figure 5-11: Melt (in grey) and freeze time (in black) associated with every flowrate and temperature differential combination calculated through the short, Tpcm, s, and long PCM sensors, Tpcm, l, as well as the tank outlet temperature, Tout. ... 72
Figure 5-12: Degree of supercooling for all v and ΔT combinations ... 74
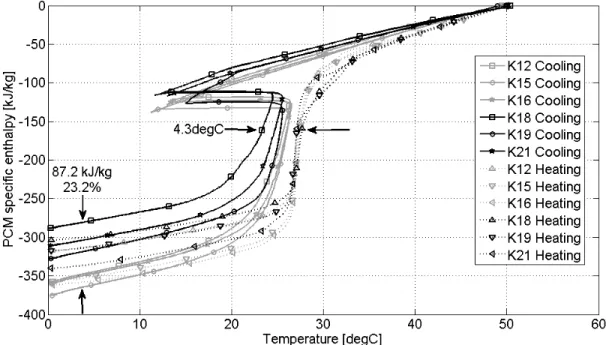
Figure 5-13: Enthalpy-temperature curve followed by PCM according to different authors ... 76
Figure 5-14: Interrupted heating and cooling tests, v = 0.3 L/s, ΔT = 10 °C, with the fourth repetition indicated by dash-dotted lines ... 77
Figure 5-15: Test results for inlet temperature change rate of 1.25 °C/hr, v = 0.3 L/s ... 79
Figure 5-17: Temperature profiles for a cooling test at v = 0.3 L/s and constant power input ... 81
Figure 6-1: Flat slab-like PCM capsule ... 94
Figure 6-2: Modelled section of the PCM storage tank ... 95
Figure 6-3: Modelled section of the PCM tank (between the two dotted lines) is discretized into several control volumes (illustrated here for 2 PCM control volumes in the y direction) ... 96
Figure 6-4: Model discretization ... 98
Figure 6-5: Schematic of an enthalpy-temperature curve with hysteresis ... 101
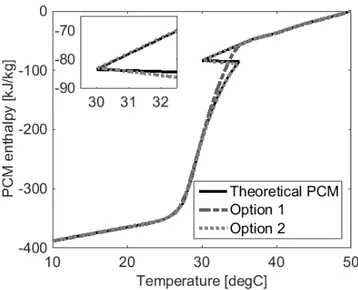
Figure 6-6: Enthalpy-temperature curve followed by PCM according to different authors ... 102
Figure 6-7: Fluid flow profiles studied ... 104
Figure 6-8: Velocity profile [m/s] at the half-height of the fluid passage for Model 3 ... 107
Figure 6-9: Outlet fluid temperature for Case 1 ... 108
Figure 6-10: Temperature distribution at sectional cuts of the PCM capsule, 1500 s into Case 1 ... 109
Figure 6-11: Temperature distribution at sectional cuts of the PCM capsule, 1500 s into Case 1 ... 112
Figure 6-12: Repartition of PCM inside the capsule ... 114
Figure 6-13: Schematic of by-pass section and entry/exit volumes ... 114
Figure 6-14: Experimental set-up schematic ... 116
Figure 6-15: Enthalpy-temperature curve of PCM S27 ... 117
Figure 6-16: PCM capsule tested ... 118
Figure 6-17: Insulated PCM storage tank ... 118
Figure 6-18: Tank outlet fluid temperature as a function of time for all step tests ... 119
Figure 6-19: Tank outlet fluid temperature as a function of time for interrupted test ... 122
Figure 6-20: Tank outlet fluid temperature as a function of time for fixed temperature change rate tests ... 123
Figure 6-21: Tank outlet fluid temperature for constant power heating test ... 124 Figure 6-22: Tank outlet fluid temperature for constant power cooling test ... 124 Figure A-1: Image of S27 sample equipped with a thermocouple sensor ... 151 Figure B-1: Raw experimental and correlation predicted temperature difference plotted against
LIST OF SYMBOLS AND ABBREVIATIONS
The following symbols and abbreviations apply to Chapters 1, 2, 3, 7 and 8 of this thesis. The different journal papers presented in Chapters 4 to 6 however have their own nomenclature. The symbols and abbreviations for each journal paper are specific to that Chapter and the reader is asked to refer to each paper’s nomenclature for information on the symbols and abbreviations used.
ASHRAE American Society of Heating, Refrigerating and Air-conditioning Engineers cp Specific heat capacity [kJ/(kg-K)]
cp,App Apparent specific heat capacity [kJ/(kg-K)]
DSC Differential scanning calorimetry
H Enthalpy [kJ]
HTF Heat transfer fluid
HVAC Heating, Ventilating and Air-Conditioning k Thermal conductivity [W/(m-K)]
kl Liquid state thermal conductivity [W/(m-K)]
ks Solid state thermal conductivity [W/(m-K)]
L Latent heat of fusion [kJ/kg] lf Liquid fraction [-]
PCM Phase change material T Temperature [K] or [°C] t Time [s], [mins] or [hrs]
Tf Solidification temperature [K] or [°C]
Tm Fusion temperature [K] or [°C]
TRNSYS Commercial brand name of a transient system simulation program
Greek symbols
𝜕 Differential [-] ρ Density [kg/m3]
LIST OF APPENDICES
Appendix A – Additional S27 properties ... 151 Appendix B – Temperature sensor calibration and uncertainty ... 159
CHAPTER 1
INTRODUCTION
An important part of building energy use serves to meet the thermal needs of the buildings such as space heating and cooling as well as hot water heating. In 2010, it is 60% of the energy consumed in Canadian commercial and institutional buildings which could be attributed to thermal needs; in the case of the residential sector, these end-uses accounted for over 80% of building energy usage (Natural Resources Canada, 2013). The sector’s energetic future therefore depends in large part on the evolution of building thermal systems energy efficiency.
Building energy demand undergoes a succession of peaks and valleys over the course of a day due to the schedule of occupant behaviour and daily weather cycles. Over a year, seasonal weather variations increase these peaks; northern climates experience peak heating demands in winter time and southern climates see increased needs in the hottest summer days. As they overlap, energy demand peaks from neighbouring buildings become critical for utility companies. Additional production and transport capacity must be planned to meet these peak load, which occur for only a few hours each year. For example, Quebec’s peak energy demand reached 38 950 MW at 7h21 on January 8th (Hydro-Quebec, 2014). Though the installed capacity of 36 643 MW is sufficient for usual operation (Hydro-Quebec, 2014), such instances prompt the need to purchase expensive and more environmentally damaging energy for neighbouring utilities. It is no surprise utilities across the globe seek to reduce building peak energy demand. The inclusion of renewable energy resources tends to accentuate this issue. In fact, the great variability in the availability of renewable energy resources such as wind and solar, often leads to increased de-synchronization of energy supply and demand. The exploitation of these resources therefore does not permit the complete replacement of the more polluting thermal power stations which provide a stable and reliable energy supply. Knowing the limits of planetary energy resources, it is more than a reduction of energy consumption which is required; a better synchronisation of energy demand and supply is also essential.
The introduction of a technology allowing energy to be stored as heat or “cold” in off-peak demand periods and restored when needs are maximum is of prime interest. The storage of latent energy is of particular interest in comparison to that of sensible energy as it allows a larger storage density and releases heat over a narrow temperature range (Agyenim, Hewitt, Eames & Smyth, 2010). Latent energy can be stored in any material which changes phase over the
operating temperature interval. The solid/liquid phase change is of particular interest as the inherent change in material volume is more manageable than for liquid/gas transitions. The large variety of commercially available Phase Change Materials (PCMs) also allows the selection of the correct transition temperature, leading to the adequate outlet heat transfer fluid temperature from the storage unit. Water is a natural PCM, but its uses are limited by the low phase change temperature (0 °C). In the case of building heat load levelling, the desirable interval for heat transfer fluid temperature is between 15 and 90 °C (Farid, Khudhair, Razack & Al-Hallaj, 2004), which requires a range of adapted PCMs.
Different phase change material storage systems exist for use in buildings. PCM enhanced building materials such as wallboards, floor tiles, concrete, bricks and windows can passively augment a building’s thermal mass (Khudhair & Farid, 2004). Controlling the timing of heat storage and release is required for peak demand shifting, so in that regards only active storage is of interest. Active PCM storage systems include radiant floors containing PCM material (Kalnæs & Jelle, 2015; Pomianowski, Heiselberg & Zhang, 2013) but most often refer to heat exchangers built to charge/discharge energy from PCM to a heat transfer fluid. Storage units of the shell-and-tube type can be found, as well as heat-pipes. Companies across the world produce encapsulated PCM most often of rectangular, cylindrical or spherical shape which can be installed in storage tanks so as to create a “latent heat thermal energy storage system”. These can take the form of vertical or horizontal water tanks including PCM capsules (Belén Zalba, Marin, Cabeza & Mehling, 2003) or air ducts holding PCM capsule banks across which the air flow can circulate (Regin, Solanki & Saini, 2008; Zhu, Ma & Wang, 2009). A schematic of different PCM storage tank geometries is presented in Figure 1-1.
Figure 1-1: Schematic of different PCM storage tank geometries a) flat plate, b) shell-and-tube with crossflow, c) cylindrical capsules, d) coil submerged in PCM, e) packed bed of spherical
capsules and f) heat pipe
The deployment of phase change material storage tanks in the building industry remains to this day quite limited. Canada and the province of Quebec are no exception. In fact, installations in the province, despite being functional, have not seen their performance been adequately documented. Recent court cases also seem to indicate that some installed systems did not meet expectations (Larocque, 2014; Siemens Canada ltée c. Groupe Enerstat inc., 2014; Systemex Energies inc. c. Groupe Enerstat inc., 2015); the most frequent complaint appears to be the system’s incapacity to supply and maintain the planned power output.
However, the information given by manufacturers is often limited to the thermophysical properties of the pure substances included in the chosen PCM, and the selection of the storage unit is often based on nominal capacity values. These calculations do not reflect the transient behaviour of the storage tank once they have been included in complex heating and cooling systems. The incapacity of Heating, Ventilating and Air-Conditioning (HVAC) system designers to understand and predict the transient behaviour of PCM storage tanks increases the risk that the system will not deliver the expected performance, and they are thus reluctant to include this technology in their design.
To increase the use of PCM storage tanks in the building sector, models must be created to simulate the transient behaviour of such tanks in interaction with electromechanical systems so as to understand how they would impact them. These models must be accessible to HVAC system designers and compatible with energy simulation programs used in the industry.
The first objective of this study is the development of a model for the simulation of the behaviour of horizontal storage tanks with commercially-available PCM capsules of rectangular geometry. The model, based on the enthalpy method, is intended for use in whole building simulations so computational efficiency will be an important factor, as well as accuracy on the time scale of typical building system response.
The second objective of the study is to thoroughly validate the model. As pointed out by past researchers, assumptions which are reasonable for one type of PCM storage tank can often not be applied safely to other geometries (Dutil, Rousse, Ben Salah, Lassue & Zalewski, 2011). These modelling assumptions need to be investigated and verified for the specific geometry under study. Too many past studies have also relied on numerical results from the literature to validate new PCM storage models. Original experimental data is rare and often incomplete, so thorough experimental testing is required for an adequate experimental validation of the model.
CHAPTER 2
LITERATURE REVIEW
This literature review contains elements relating to each of the project objectives described previously. First, the development of an adequate model for the simulation of a phase change material storage tank can be separated into two steps: modelling the phase change process itself and simulating heat transfer mechanisms inside the tank. Section 2.1 of this literature review discusses the existing methods to model the phase change process while Section 2.2 presents existing models of PCM storage tanks of the studied geometry: horizontal tanks with PCM encapsulated in flat, rectangular capsules. Secondly, experimental validation of the model requires thorough testing of the tank on a test bench which can measure the correct experimental data and impose realistic operating conditions. In Section 2.3, a review is made of the existing experimental data on the use of PCM storage systems in order to identify data of importance as well as the areas where information is lacking. Finally, Section 2.4 presents specific applications of PCM storage units in buildings to identify the likely operating conditions and metrics of importance.
2.1 Modeling the phase change process
A material’s change of phase from liquid to solid state can be described as the time-wise evolution of the liquid/solid interface through the volume studied. Determining the position of this interface at a specific time is therefore the goal of phase change problems. This position depends directly on the speed at which heat is absorbed by the material, hence on the material’s thermal properties. However, those properties (thermal conductivity, specific heat capacity, density etc.) often change significantly between liquid and solid states. Modelling the change of phase therefore implies knowing the position in time and space of the liquid/solid interface so the appropriate properties can be applied on both sides. The complexity of the phase change problem is caused by the fact that this interface position is both the solution to the problem and a required input; such types of problems are named moving boundary problems and have been studied as early as 1831 by Clapeyron and Lamé in their investigation of the formation of the Earth’s crust. It was Jožef Stefan’s 1889 work on ice formation, however, which truly introduced a general class for these problems, hereafter known as Stefan problems.
According to Shyy et al. (1996), resolution methods for moving boundary problems are divided in two main categories :
1. Lagrangian methods and 2. Eulerian methods.
Lagrangian methods are also known as front-tracking methods. They imply following the phase change front throughout the studied domain by reconfiguring the spatial or temporal grid so the interface is always on a grid limit. This implies the interface between the solid and liquid phases is seen as a discontinuity in the material and its position is an intrinsic part of the problem solution.
Eulerian methods instead establish a fixed grid for the studied volume and reconstruct a phase change front from the properties determined at each point of the domain. These methods are less precise in their definition of the phase change front but when such a precision is not required they offer the advantage of greater computational efficiency and a simpler implementation for the modeller.
2.1.1 Enthalpy method
One of the more popular Eulerian methods is named the “enthalpy method” and was described by numerous authors (Crank, 1984; Lacroix, 1989; Shyy et al., 1996; V. R. Voller, Cross & Markatos, 1987; V.R. Voller & Prakash, 1987). It uses the same equation for both the liquid and solid phases of the material, deducting the phase change front position a posteriori through the temperature determined for each control volume in the grid. To do this, it requires a function linking the material specific enthalpy to its temperature for the whole temperature interval of interest.
For example, in the case of a conduction problem, the governing equation for the phenomena can be written as:
ρ∂(H)∂t = ∇(k∇T) (2-1)
The equation can be discretized according to the control volume method where the total enthalpy, H, and temperature, T, can be interpreted as average values over the control volume studied. The total enthalpy includes both sensible and latent components as indicated in Equation (2-2):
H = cp∙ T + lf∙ L (2-2)
where cp is the material specific heat capacity, lf is the control volume liquid fraction and L the material’s enthalpy of fusion. The governing equation can be modified to include this definition of enthalpy where the enthalpy of fusion is treated as a source term:
ρcp∂(T)∂t = ∇(k∇T) − Lρ ∂(l∂tf) (2-3)
To complete the model, a relation between the material’s temperature and liquid fraction must be established. For a pure substance, specific enthalpy is a sharp but continuous function of material temperature (Tittelein et al., 2015) as illustrated on Figure 2-1a. Most real PCMs behave as binary mixtures (Tittelein et al., 2015), with phase change spread out over a temperature interval as illustrated in grey on Figure 2-1b.
Figure 2-1: Evolution of a material’s specific enthalpy as a function of material temperature for a) a pure substance and b) a binary mixture
In that case, temperature Tm indicates the moment the material begins to melt and temperature Tf indicates the end of the melting process. Between these two temperatures is a “mushy zone” where both phases coexist. The liquid fraction, lf, can then be calculated for each control volume as a function of the temperature field following Equation (2-4):
lf=TT − Tm f− Tm
An alternative exists where the liquid fraction and other properties are updated through the enthalpy value:
lf=HH − Hm f− Hm
(2-5)
This alternative has the advantage of being less sensitive to minor errors on the control volume temperature than that using Equation (2-4). So it is then possible to model the change of phase of a pure substance (isothermal phase change) without losing accuracy.
2.1.2 Effective heat capacity method
Another popular Eulerian method involves reflecting the position of the phase change front in the specific heat capacity value of the material. In this method, when the phase change temperature is reached in a control volume, any energy supplied to the control volume serves to change the specific heat capacity until the additional energy required for phase change has been accounted for. Therefore, in the case of a unidimensional conduction problem, the governing equation can be written as:
ρcp,App∂(T)∂t = k∂ 2T
𝜕𝑥2 (2-6)
where cp,App is the apparent specific heat capacity, k is the material thermal conductivity, ρ is the material density and T the material temperature.
Figure 2-2: Evolution of a material’s apparent specific heat capacity as a function of material temperature
The equation then uses variable properties according to the control volume temperature, an example is given in Equation (2-7) for the thermal conductivity:
k = �ks(1 − lksf) + kllf kl if T <Tm if Tf≤T ≤Tm if Tf< T (2-7)
As is clear from Figure 2-2, the apparent heat capacity is a discontinuous function of the material temperature. Though the method was used by many authors, it often results in non-convergence due to the abrupt changes in the apparent specific heat capacity at the solid/liquid interface. This has been shown to be especially true when implicit time discretization is used (Al-Saadi & Zhai, 2015; Gong & Mujumdar, 1997). Numerous variants have been proposed to resolve these non-convergence issues, rendering the method more complex to implement (Bonacina, Comini, Fasano & Primicerio, 1973; Gong & Mujumdar, 1997; Yang & He, 2010). This method’s computational speed is still inferior to most enthalpy methods (Al-Saadi & Zhai, 2015).
2.1.3 Issues with modelling the phase change process
Additional issues commonly arise in the modelling of the phase change process caused by the enthalpy-temperature curve (or apparent heat capacity curve) themselves, specifically the presence of hysteresis between the heating and cooling curves and the presence of supercooling1. These effects modify the expected behaviour of the phase change material, making its prediction and modelling more complex or at times even impossible without resorting to statistical probabilities.
Hysteresis is a phenomenon where the melting temperature of a material is different from its solidification temperature, not because the material changes phase over a temperature interval as presented in Figure 2-1b but because an offset exists between the enthalpy-temperature curves representing the cooling and heating processes for the same material. This phenomenon is illustrated on Figure 2-3b. At times, hysteresis is a property of the material or material sample under study but at times its presence is due to the measurement conditions, in which case it is often labelled “apparent hysteresis” (Mehling & Cabeza, 2008).
1 The terminology employed in Chapter 4, is “subcooling” instead of “supercooling” but it refers to the same
phenomenon. Subcooling is generally used by authors in building sciences who model PCM behaviour, and Chapter 4 used that terminology. Chemical engineers and material science authors use supercooling, which is a more rigorous term, and was used in our subsequent work in Chapters 5 and 6.
Figure 2-3: Evolution of a material’s specific enthalpy as a function of material temperature in the presence of a) supercooling or b) hysteresis
Supercooling, sometimes referred to as “subcooling” in the literature, is a phenomenon where the material being cooled does not start to crystalize immediately upon reaching its solidification temperature. Instead, as illustrated on Figure 2-3a, the material will become a supercooled liquid (indicated in grey on Figure 2-3a) and reach a temperature well below the solidification temperature before the actual solidification process takes place. The difference between the solidification temperature and the real nucleation temperature is known as the degree of supercooling of the material. Supercooling happens in pure materials; water, for example, when pure can at times not solidify before temperatures below -15 °C are reached. This delays the release of the latent heat of fusion and can be a serious problem in thermal storage applications. It is especially frequent in salt hydrates, so manufacturers will often add nucleating agents to reduce its prevalence and importance (Mehling & Cabeza, 2008), though their presence is not always sufficient to prevent its occurrence.
Previous work by Günther, Mehling & Hiebler (2007) attempted to model supercooling numerically to ensure a more accurate prediction of the behaviour of salt hydrates. The paper stated that, as most PCMs do not have a fixed melting temperature but rather a melting range, a fixed degree of supercooling cannot be associated with most PCMs. Instead, a range of
temperatures at which nucleation of the supercooled liquid is likely to start exists and the likelihood of one temperature starting nucleation can be estimated through a statistical distribution within the nucleation range. Another important notion of their modelling technique is the speed of crystallization and its relation to the speed with which heat is transported in the same material. The authors explain that every molecule undergoing the change a phase from liquid to solid will release a fixed amount of latent energy which raises the temperature of the material in proximity. Depending on the relative speed of crystallization to that of heat transport in the material, solidification of one PCM molecule can either inhibit or stimulate the propagation of the phase change front, thereby causing or limiting the formation of a temperature plateau in the material. The numerical model of the supercooling effect performed quite well when compared to experimental data. The main issue with this model is the absence of required information for most PCMs. The additional information required by this modelling method (the crystallization speed and nucleation probability as a function of temperature) is unknown for most materials and requires thorough experimental testing for which no standardized method exist as of yet.
Solomon, Karthikeyan & Velraj (2013) performed a detailed study of the supercooling of a PCM installed in a vertical double pipe annular heat exchanger (i.e. heat pipe) with air serving the role of heat transfer fluid in the set-up’s inner tube. The researchers studied the impact of varying the fluid flowrate on the presence and degree of supercooling measured. Results indicated increasing the fluid flowrate, and thus increasing the heat flux to the PCM, augmented the degree of supercooling measured. Similarly, supercooling was more prominent in the PCM which was positioned closest to the fluid entry than that further downstream as it experienced higher cooling rates. However, beyond a certain fluid velocity, any further increases had negligible effects on supercooling. They also found that the degree of supercooling measured at the different cooling rates in their experimental data correlated well with the apparent specific heat curve as a function of temperature obtained through digital scanning calorimetry (DSC) with similar cooling rates. This would indicate that characterisation of a material should be performed at the same heating/cooling rates as those expected in the targeted application for the resulting curves (enthalpy-temperature curve or apparent specific heat-temperature curve) to adequately represent the PCM’s expected behaviour.
2.2 Modeling PCM encapsulated in flat, rectangular capsules
2.2.1 Gaseous heat transfer fluid
Phase change material encapsulated in flat rectangular containers has been modelled by different researchers when using air as heat transfer fluid. Dolado et al. (2006) developed various numerical models simulating the behaviour of flat slab-like PCM capsules exposed to air flow, each considering different modelling assumptions. Two of the models are finite-difference based and considered only conduction inside the PCM, neglecting any effect natural convection might have while the PCM is in liquid phase. One model considered one-dimensional conduction in the PCM in the direction normal to Heat Transfer Fluid (HTF) flow while the other considered conduction in the PCM both parallel and normal to the HTF flow. Comparing numerical results to the previous experimental data of Belén Zalba (2002) confirmed that the unidimensional model could reproduce experimental data with the required accuracy. Hence, modelling conduction inside the PCM in the direction of HTF flow did not bring any significant accuracy improvement to the numerical results.
Vakilaltojjar and Saman (2001) developed three numerical models to evaluate the impact of different modelling assumptions in simulating a thermal storage unit with PCMs, installed in an air-conditioning unit. As air was to be the considered heat transfer fluid, all models neglected the fluid heat capacity as well as that of the capsule wall. One model ignored the sensible heat at the initial stages of melting and freezing of the PCM (i.e. the initial temperature of the PCM was set equal to the melting temperature). Another model also assumed the wall temperature inside the PCM capsule was either equal to the melting point of the PCM or equal to the air temperature. Numerical results indicated that assuming a constant air speed profile at the tank inlet did not significantly impact outlet air temperature from the unit in comparison to a fully developed inlet air flow profile. The analysis showed that the air-side heat transfer resistance dominates the overall heat transfer resistance so both the capsule wall and PCM thermal resistances could safely be ignored in this case. This model however has some inherent limitations; among others, its limited capability to predict heat transfer rates.
Halawa et al (2005) developed a model for a roof integrated solar heating system using thermal storage inside PCM slabs. The model accounts for bi-dimensional conduction inside the PCM as
well as the variation of air temperature along the length of the PCM capsules. Arguing neither “constant heat flux” nor “constant temperature” were realistic boundary conditions at the capsule wall, they implemented different Nusselt number values for each control volume over the length of the PCM capsule. Each was calculated for constant temperature boundary conditions but was solely valid over the length of that control volume. Further work (Saman, Bruno & Halawa, 2005) compared this model’s numerical results to two tests from Vakilaltojjar’s experimental data (2000), one for flat PCM capsules and the other for conical capsules. In both cases, the model demonstrated an interesting fit but had difficulty replicating the tank outlet fluid temperature following rapid changes to the inlet fluid temperature. These differences lead to errors in the simulated heat transfer rate of over 0.5 kW or ~ 28% of the measured value for conical capsules.
Halawa, Saman & Bruno (2010) developed a one-dimensional finite-difference model where, again, the fluid’s thermal capacity was neglected. The PCM’s thermal resistance was also considered negligible with regards to the capsule wall’s thermal resistance. As the thickness of the capsule is small, only one node inside the PCM was modelled. Comparing the outlet fluid temperature from numerical and experimental results demonstrated a satisfactory agreement. However, the model predicted slightly higher values than shown in the experimental results during the 15 minutes following a sudden change in inlet fluid temperature. The difference between these results reached a high of ~ 1.2 °C. The authors noted that the presence of supercooling, neglected in the model, could explain the sudden variations in the experimental data which are not reflected in the numerical data during the cooling process.
2.2.2 Liquid heat transfer fluid
Studies of encapsulated PCM of rectangular geometry are scarce for liquid Heat Transfer Fluid (HTF). Elsayed (2007) studied ice in horizontal capsules exposed to cyclic HTF temperatures using a tri-dimensional implicit model based on the enthalpy method. For simplicity, the author assumed the solid PCM would remain fixed at the centre of the capsule so the capsule symmetry could be exploited. Model results were summarily compared to numerical and experimental data from past research, which showed a good agreement. Though the model was implicit, a maximum time step of 3 secs could be used for results to be independent of mesh size (fluid velocity was not specified). A numerical study let the author conclude that the rate of heat
transfer was more influenced by the HTF temperature than by the heat transfer coefficient. Consequently, the paper postulated that the average fluid temperature could be used to determine the thermal response of a PCM storage unit with reasonable precision.
Liu, Bruno & Saman (2011) developed a unidimensional model to simulate the behaviour of horizontal PCM tanks for use in refrigerated trucks, based on Halawa’s “phase change processor” (2010) previously described in Section 2.2.1. The model included the HTF specific heat capacity but did not consider any thermal resistance for the PCM material nor any heat transfer between adjacent PCM nodes in the direction of HTF flow. Results from two experimental tests of a complete melt/freeze cycle showed a close agreement between the outlet fluid temperature measured experimentally and its simulated counterpart. However, the model had some difficulties adequately representing experimental results at the beginning of the melting process following an initial change in inlet HTF temperature. A parametric study (M. Liu, Bruno & Saman, 2011) performed with the numerical model indicated that the inlet fluid temperature to the tank as well as fluid flowrate had a significant impact on the PCM melting time as well as rates of heat transfer.
Langlois (2011) developed a unidimensional model of a horizontal PCM storage tank based on isothermal phase change and implemented it in the TRNSYS building energy simulation program (Klein et al., 2011) as a TRNSYS type. The model considered that only one fluid control volume was associated with each PCM capsule and the capsule itself was only discretized into numerous control volumes over its thickness, not its length. The model is based on a variant of the method proposed by Zivkovic & Fujii (2001) where the same equation is used for both the liquid and solid phases of the PCM and only the equation coefficients are changed from one state to the other. This implies a constant verification of the phase change front is required to choose the correct boundary conditions and thermal properties for each control volume. No experimental validation of the model exists.
Bony & Citherlet (2007b) modified a pre-existing stratified hot water storage tank model from TRNSYS, named Type 60, to include the effects of PCM capsules of various geometries. The model presents various advantages compared to previous propositions: it uses a variable number of nodes over the PCM thickness, considers two-dimensional conduction in the PCM and accounts for both supercooling and hysteresis in the PCM as well as natural convection in the
PCM’s liquid phase. Simulation results demonstrated a good fit between experimental and numerical results. Experimental tests only concerned with cylindrical capsules installed vertically in a vertical water storage tank. The model accuracy for horizontal storage with rectangular capsules was not demonstrated, and some model assumptions are not adapted to this configuration. For example, the heat transfer coefficient considered is that of a vertical plate submitted to convective heat transfer in both vertical and horizontal tank orientations. Inherent limitations of Type 60, such as the fact that natural convection is deemed the main heat transfer mechanism in the fluid, could also inhibit the adequate modelling of a horizontal tank. Finally, hysteresis and supercooling being negligible in the paraffin used in the experimental tests, the results did not allow the assessment of the model’s treatment of these two phenomena.
Puschnig, Heinz & Steicher (2005) have also developed TRNSYS models capable of representing a water tank filled with PCM capsules of various geometries as well as micro-encapsulated PCM slurries. This model is based upon another existing TRNSYS model, named Type 240, and considers exclusively vertical tank where thermal stratification and natural convection are important components of the heat exchanges between the heat transfer fluid and PCM. Conduction inside the PCM capsules is considered bi-dimensional and convective heat exchange between the fluid and PCM includes both natural and forced convection.
Most other studies where a liquid is used as HTF have considered particular configurations where capsules are heated in an asymmetrical fashion, imposing constant flux or constant temperature boundary conditions over the length of the capsule, (Costa, Buddhi & Oliva, 1998; Hamdan & Elwerr, 1996; Lacroix, 2001; Silva, Gonçalves & Pires, 2002) instead of convective heat transfer from a fluid.
2.3 Experimental data on phase change material thermal storage tanks
Moreno et al. (2014) experimentally tested the use of a horizontal PCM storage tank to shift the daytime cooling load of a small space. The PCM tank was coupled to a water-to-water heat pump and air handling unit, linked to a shed-size building, which was used to represent the indoor space whose temperature must be maintained. The performance of a horizontal water storage tank of identical dimensions was compared to that of the tank stacked with PCM capsules, which are commercially-available, rectangular in shape and made of high density polyethylene. Test parameters were representative of a real-life application, with the heat pump’s compressorswitching on and off, fluid flow being interrupted when minimum inlet HTF temperature was reached, etc. Charging time was deemed an important metric and was determined in function of either the outlet fluid temperature or PCM temperature. One of the PCM capsules having been outfitted with a temperature sensor, supercooling was found to be present even though it was not documented in the manufacturer data. Results indicate that for the same footprint, the PCM tank could on average supply 14.5% more cooling energy than the water tank, at the expense of a charging time which was 4.6 times longer.
Dolado et al. (2011) performed thorough experimental testing of a PCM-air heat exchanger which included metal-encapsulated PCM slabs positioned vertically. Detailed figures provide the evolution of the temperature through time, measured at the surface of the PCM capsules inside the unit as well as the fluid inlet and outlet temperatures for the different tests. The impact of varying the fluid flowrate and inlet fluid temperature on the thermal power produced by the unit was evaluated. The time required to fully charge/discharge the tank was also studied and at least one test underwent three repetitions to evaluate the repeatability of the process. One capsule was especially outfitted with three additional sensors placed inside the capsule to measure the PCM temperature itself. These sensors allowed an analysis of the PCM’s behaviour inside the specific capsule geometry, indicating for example, longer phase change plateaus at sensors placed further downstream from the tank inlet.
Such detailed experimental tests exist for other PCM capsule geometries such as plastic pouches (Saied Mohammad Vakilaltojjar, 2000; Zukowski, 2007), plastic vertical slabs (Lázaro, Dolado, Marín & Zalba, 2009; B. Zalba, Marin, Cabeza & Mehling, 2004), as well as spherical (Bedecarrats, Castaing-Lasvignottes, Strub & Dumas, 2009; I. W. Eames & Adref, 2002; Nallusamy, Sampath & Velraj, 2007) and cylindrical capsules (J. Wei, Kawaguchi, Hirano & Takeuchi, 2005). However, thorough analysis of the behaviour of the commercially available capsules studied in this project has not been found in the literature.
2.4 Applications of PCMs in building systems
Possible applications of PCM in buildings are numerous and diversified. For example, Buick, O’Callaghan & Probert (1987) numerically studied the contribution of PCM thermal storage on the heat pumps of a central heating system. Authors demonstrated that installing PCM between the heat pumps and distribution system, heat pumps of a reduced capacity could be installed thus
reducing system installation costs. Riffat, Omer & Ma (2001) built a prototype to study the potential of PCM and tube heat exchangers for thermoelectric cooling. Their study demonstrated the use of PCM instead of the cold source (heat sink) improved the system’s performance by maintaining a low temperature differential between the cold and hot junctions of the module. There are however 4 subjects which return more frequently in the literature: the addition of thermal inertia in building materials, thermal storage associated with solar systems, hot water storage tanks in general and free cooling. These subjects stand out, among other things, by their relation to the thermal conductivity of PCMs. In the case of adding thermal inertia to the building envelope, the low thermal conductivity of the PCM is not problematic as charging and discharging occurs over a long period. Active applications such as free cooling, hot water storage tanks generally and specifically associated with solar energy however require quicker charge/discharge time and methods must be put in place to compensate the PCM’s low thermal conductivity.
2.4.1 PCM in construction material
Many researchers have studied the inclusion of PCM in construction material such as gypsum, concrete and wallboards in order to increase the building’s thermal mass (Athienitis, Liu, Hawes, Banu & Feldman, 1997; Behzadi & Farid, 2011; B. Delcroix, 2015; Farid et al., 2004; Khudhair & Farid, 2004; Nikoofard, Ugursal & Beausoleil-Morrison, 2015; Sharma, Tyagi, Chen & Buddhi, 2009; Tyagi & Buddhi, 2007; X. Wang et al., 2009; D. Wei, Liang, Xing & Yun, 2009; Belén Zalba et al., 2003; Zhou, Zhang, Wang, Lin & Xiao, 2007). These materials aim to reduce the daily variations of temperature inside the building consequently reducing peaks in heating and cooling. In northern climates, the additional thermal mass allows to store solar energy during the day and to discharge it at night to heat the room’s ambient air. Similarly, in hotter climates, building thermal mass stores nocturnal coolness allowing the reduction of mechanical cooling during the day. Such an addition of thermal mass to a building is however a passive thermal storage method, since charging and discharging cannot be controlled.
Other storage methods termed « active» permit the control of the charge applied to the PCM as well as the moment the charging/discharging takes place, thus allowing a control over the moment the system’s energy is released. One such option is the inclusion of PCM in ventilated façades (Alvaro de Gracia, Navarro, Castell & Cabeza, 2015; Fiorito, 2012; S. Liu & Li, 2015;
Rodriguez-Ubinas, Ruiz-Valero, Vega & Neila, 2012) where air flow is controlled by louvers. This is also the case of a storage tank connected to a building’s heating or cooling loop where flow can either enter the tank or by-pass it, such as the configuration studied in this thesis.
2.4.2 Applications in solar energy systems
Studies on the use of PCM in solar thermal systems are frequent and aim mainly to compensate the temporal de-synchronization between the availability of solar energy and the occurrence of heating requirements (Al-Kayiem & Alhamdo, 2012; Bansal & Buddhi, 1992; Bony & Citherlet, 2007a; Esen, 2000). Certain researchers have studied solar panels with a thin layer of PCM added into them (Chen, Gu, Peng, Peng & Wu, 2010; P. C. Eames & Griffiths, 2006; Rabin, Bar-Niv, Korin & Mikic, 1995). Malvi, Dixon-Hardy & Crook (2011) have added PCM to combined photovoltaic and thermal solar panels. Their study showed that by cooling the photovoltaic panel, the PCM increase by 9% the daily energy produced by the system in comparison to ordinary photovoltaic panels.
Cabeza et al. (2006) have experimentally compared the behaviour of a stratified hot water storage tank including encapsulated PCMs to that of a simple storage tank when coupled to solar thermal panels. Their experimental results indicated the use of PCM produces hot water over a longer period without any supplemental heating and reduces the thermal storage tank size. Results from Ibáñez et al. (2006) demonstrate an increase in the solar fraction from 4% to 8% when PCM are added to a hot water storage tank connected to thermal solar panels. Following a similar experiment, Canbazoğlu et al. (2005) compared different encapsulated PCMs inserted in the hot water tank of a thermal solar system. Their results demonstrated a PCM storage tank could store up to 3 times more energy than an ordinary tank depending on the material used.
However, other researchers have found that the use of PCM to store energy produced by a solar thermal system was disadvantageous when compared to a typical sensible storage tank. For example, Bony & Citherlet (2007a) have noted an increase in supplemental heating when PCM is included in a solar system’s hot water tank. Talmatsky & Kribus (2008) have numerically simulated a solar thermal system combined with a PCM tank and compared results for different combinations of PCMs and capsule positions inside the tank. They concluded that adding PCM inside hot water storage tanks did not increase the system efficiency. Rather, the annual energy transmitted to the final user is often inferior for PCM systems.
According to Kousksou et al. (2011), the mixed results of these authors demonstrate that PCM thermal storage can have both a positive and negative impact on solar thermal systems depending on the phase change temperature chosen and the comparison criteria used. The variability of these results also indicates the importance of an adequate simulation of the storage system’s behaviour at the design stage.
2.4.3 Applications of PCM in hot water storage tanks
As seen in the previous section, the use of PCMs in the storage of solar energy often involves the use of PCM-enhanced hot water storage tanks. The study of such PCM-enhanced tanks is also important for their use in the supply of domestic hot water, whether or not they are connected to thermal solar systems. Domestic hot water is usually provided using electric or gas heaters which have a low efficiency in terms of primary energy due to the fact that they often imply the conversion of fossil fuels to electricity and electricity to thermal energy (Nkwetta & Haghighat, 2014). Domestic hot water storage tanks are also a great opportunity for peak shifting building electric demand to off-peak periods provided that modifications are made to ensure power draw does not occur concurrently with water withdrawal (Lacroix, 1999). Moreover, as the water temperature inside these tanks must be maintained at or above 60 °C to prevent the proliferation of dangerous bacteria such as Legionella (ASHRAE, 2000), the possibility to supply water at a constant temperature with latent systems is of particular interest.
Al-Hinti et al. (2010) discussed the effect of water withdrawal patterns on the performance of both a PCM-enhanced and ordinary domestic hot water storage tanks. Following a withdrawal pattern typical of residential day-time consumption of domestic hot water for a small family, average water temperature in the ordinary tank dropped by 20 °C (71 °C to 51 °C) while the average temperature dropped by only 12 °C (72 °C to 60 °C) in the PCM-enhanced tank. They concluded that in cases of extreme consumption, such as during evening hours, the presence of PCMs resulted in extended operational time of the system without the need for supplementary heating of the water.
Several other studies have also demonstrated that the inclusion of PCMs in hot water storage tanks can increase their storage density and delay the activation of supplementary heating following water withdrawal for a significant amount of time, at times displacing it completely to
off-peak power demand periods (A. de Gracia, Oró, Farid & Cabeza, 2011; Mehling, Cabeza, Hippeli & Hiebler, 2003). This potential can further be enhanced through the use of optimised control strategies (Nkwetta et al., 2014) and the adequate choice of phase change temperature and capsule geometry (Barba & Spiga, 2003). The implicit requirement behind both the evaluation of control strategies and design choices is the availability of adequate modelling tools.
2.4.4 Free cooling applications
Free cooling is another classic application of active PCM storage. Zalba et al. (2004) have experimentally tested the use of a PCM storage tank to store cold from the night-time air and restore it as cooling capacity during the day. The unit was experimentally submitted to step changes in its inlet fluid temperature, using combinations of different inlet temperatures and air flowrates. The study indicated that the use of such a tank in an industrial building is economical in comparison to a conventional air-cooling system as it uses approximately 9 times less electricity.
Arkar & Medved (2007) have numerically compared different modes of free cooling for a residence with low energy consumption including a system with PCM integrated in the ventilation system. Besides cooling the residence at night, cool outside air is also stored in the PCM and released in the residence by day. Though the air flowrate into the PCM unit remained constant during the simulation, the inlet temperature changed following the daily variations in outdoor air temperature surrounding the residence, located in Ljubljana, Slovenia. The study concludes this method is more efficient in the reduction of indoor air temperature than continuous free cooling as well as night-time free cooling where only one opening exists per room (single-sided natural ventilation). Even though the method leads to slightly higher indoor temperatures when compared to cross night-time ventilation (where openings on opposite walls allow the incoming air to sweep across the entire room), it increases air quality in the residence by continuing ventilation of outdoor air during the hot hours of the day. Moreover, air flow required for cross night-time ventilation to be efficient depends on wind and is not guaranteed every night of the hot season.
Turnpenny el al. (2000, 2001) conceived and constructed a cooling system containing heat pipes inserted into PCM and used it conjointly with a ceiling-suspended air heater. Their experimental trials were performed with different air flowrates and step changes in inlet temperature to the
unit. Results indicate this system compares advantageously to chilled ceilings through its inferior mass and the fact no cold water has to be produced. When compared to conventional air-conditioning systems, the study’s results indicate the PCM system is more economical and more energy efficient.
Raj & Velraj (2010) performed a detailed review of publications of PCMs used in free cooling. They concluded that in spite of the potential of PCM in free cooling demonstrated by some authors, the low thermal conductivity of both air and most PCMs as well as long PCM charging time remain significant obstacles. As free cooling potential varies greatly as a function of site location and climate, a detailed analysis is required before selecting the correct phase change temperature and heat transfer rate for each application. Knowing PCM thermal properties vary as a function of temperature, the design of any PCM storage system should be based on the analysis of the PCM’s transient behaviour.
2.4.5 Follow-up of real applications in buildings
Authors cited previously discuss numerical or experimental results obtained from the study of PCMs. To select the appropriate operating conditions under which to experimentally test a PCM storage tank however, it is the real operating conditions found in actual building HVAC systems which are of interest, not simulation results or experimental tests. To draw a complete portrait of the state of the art on the domain of PCMs in buildings, concrete cases of real PCM storage tanks monitored during their installation in buildings must also be discussed.
2.4.5.1 Ice as phase change material
Most sites where thermal storage with phase change materials has been implemented and its performance monitored used water as PCM. As for other such materials, different configurations exist among which ice-on-coil systems, encapsulated ice and ice slurry based systems are the most common.
Sohn & Nixon (2001) have studied the operation of fire station 506 of the United States Army on the Yuma Proving Ground, in Arizona, where an ice tank has been in service since 1988. This tank consists of a coil submerged in water and is used to produce ice at night to even out peak air-conditioning loads occurring during the day. The general operating conditions required the tank to be fully charged daily, over a 20 hour period by a 281 kW (80-ton) chiller producing ice in the