affiliée à l’Université de Montréal
Experimental study of volumetric gas-liquid mass transfer coefficient in slurry
bubble columns
AFSHIN FALLAHI Département de génie chimique
Mémoire présenté en vue de l’obtention du diplôme de maîtrise ès sciences appliquées Génie chimique
Mai 2019
Ce mémoire intitulé :
Experimental study of volumetric gas-liquid mass transfer coefficient in slurry
bubble columns
présenté par Afshin FALLAHI
en vue de l’obtention du diplôme de Maîtrise ès sciences appliquées a été dûment accepté par le jury d’examen constitué de :
Abdellah AJJI, président
Jamal CHAOUKI, membre et directeur de recherche
ACKNOWLEDGEMENTS
I would like to express my sincere gratitude to Professor Jamal Chaouki for his valuable guidance and support throughout this study. He provided me the opportunity to work on this challenging project and always gave me intellectual freedom.
I am deeply grateful to El Mahdi Lakhdissi for his guidance and help with the experimental part of my research. I benefited from our discussions and his invaluable comments and suggestions on my thesis. I would also like to thank him for the translation of the abstract to French.
I would like to thank my dear friend and colleague, Mojtaba Mokhtari, for his valuable contribution and help, and constructive comments on my thesis.
Many thanks to my colleagues at PEARL research group, from whom I learned a great deal during our meetings and friendly discussions.
The technical support of the department of Chemical Engineering, particularly Mr. Robert Delisle and Mr. Sylvain Simard-Fleury is greatly appreciated.
I acknowledge the financial support provided by Total E&P and Natural Sciences and Engineering Research Council of Canada (NSERC).
I dedicate this work to my wife, Maryam, and my son, Mahyar.
RÉSUMÉ
Les colonnes à bulles slurry (SBCRs) sont largement utilisées dans une multitude de procédés où le contact efficace entre les phases gazeuse, liquide et solide est d’une importance critique. Dans ce contexte, les SBCRs ont trouvé beaucoup d’applications lors de la dernière décennie dans plusieurs industries chimiques, biochimiques et pétrochimiques. Les colonnes à bulles offrent plusieurs avantages à savoir un transfert de chaleur et de masse élevé, des coûts d’opération et de maintenance diminués, un excellent mélangeage des différentes phases, une distribution uniforme de la température et aussi de la compacité. Il est déjà établi qu’une compréhension complète des phénomènes de transfert de matière est essentielle pour le design et la mise en échelle des SBCRs. Or, ces deux tâches s’avèrent difficiles à réaliser du fait que la vitesse de transfert de matière est liée directement aux dimensions du réacteur, aux conditions opératoires et aux propriétés physiques de chacune des phases. Malgré le nombre d’études qui ont été menées sur l’effet des particules solides sur l’hydrodynamique et le transfert de matière dans les colonnes à bulles, il n’y a pas encore un accord sur le mécanisme dominant et aussi sur son amplitude. Plus important, la majorité des travaux antérieurs ont été réalisées dans des réacteurs à échelle laboratoire pour étudier l’effet des particules solides. Par conséquent, les résultats peuvent s’avérer non pertinent du fait que l’hydrodynamique change quand on passe de l’échelle laboratoire à l’échelle industrielle.
Pour aborder cette problématique, une colonne à bulles slurry à échelle pilote a été utilisée dans ce travail pour étudier le coefficient volumétrique de transfert de matière gaz-liquide (𝑘𝐿𝑎) dans un
système biphasique (air-eau) et triphasique (air-eau-billes de verre). L’effet de la vitesse superficielle du gaz, la concentration et la taille des particules sur le 𝑘𝐿𝑎 a été étudié expérimentalement. Les résultats obtenus ont été justifiés en considérant l’hydrodynamique et les différentes théories de transfert de matière applicables aux colonnes à bulles. Dans la dernière partie de cette étude, une corrélation fiable a été développée pour estimer le coefficient de transfert de matière en se basant sur les conditions opératoires, les grandeurs du design et les propriétés des trois phases.
Pour l’effet de la vitesse superficielle du gaz dans le système air-eau, nous avons observé que l’augmentation de la vitesse du gaz (entre 0.4 et 21.3 cm/s) augmente le coefficient de transfert de matière. Ceci peut être attribué à un meilleur mélangeage entre les phases liquide et gazeuse et
aussi à la rétention de gaz élevée. Aussi, un résultat intéressant est que, indépendamment de la vitesse de gaz, la variation du coefficient de transfert de matière dans la direction radiale est négligeable ce qui peut être attribué à la rapidité du mélangeage de la phase liquide dans la colonne. Nous avons aussi observé que la concentration (0, 1, 3, and 5%v/v) et la taille (71 and 156 µm) des particules solides (i.e. Billes de verre) affectent fortement la vitesse de transfert de matière. L’effet de la phase solide sur le 𝑘𝐿𝑎 est dépendant de la vitesse du gaz. Pour les faibles vitesses, la présence
des particules solides a un effet négatif sur le transfert de matière tandis qu’à hautes vitesses, le solide fait augmenter le transfert de matière. Les billes de verre à diamètre élevé (i.e. 156 µm) ont fait augmenter le coefficient de transfert de matière de manière notable et ceci est dû principalement à l’augmentation de la turbulence dans l’interface gaz-liquide à cause de la présence des particules. La corrélation développée pour estimer le coefficient de transfert de matière dans les systèmes biphasiques et triphasiques comprend Schmidt, Galilei, Froude, Bond, la densité du gaz et du liquide, la diffusivité de l’oxygène et le diamètre de la colonne. La corrélation développée a pu reproduire les résultats expérimentaux avec succès : Erreur absolue moyenne < 4.81% et écart type ~ 0.27 %.
ABSTRACT
Slurry bubble column reactors (SBCRs) are extensively employed in a variety of processes in which efficient contact between the gas, liquid, and solid phases are of critical importance. In this context, in the past decade, SBCRs have found numerous applications in chemical, biochemical, and petrochemical industries. Bubble column reactors offer a number of advantages: superior heat and mass transfer rates, low operating and maintenance costs, excellent mixing of solids, uniform temperature distribution, and compactness. It is well established that a comprehensive understanding of the mass transfer phenomena is essential in order to design and scale-up SBCRs for industrial purposes. The fact that the mass transfer rate is connected to a large number of factors including reactor dimensions, operating conditions, physical properties of each phase makes the problem even more complicated. Despite the fact that there are several studies on the impact of solid particles on hydrodynamics and mass transport in SBCRs, still, there is no general agreement regarding the prevailing mechanism or the magnitude of such effect. More importantly, the majority of previous studies utilized laboratory scale test rig to investigate the role of solid particles; thus, the results may not be relevant to large scale reactors mainly due to the differences in hydrodynamics.
To address these research gaps, in the present study, a pilot scale slurry bubble column has been used to investigate the volumetric gas-liquid mass transfer coefficient (𝑘𝐿𝑎) in two-phase (air-water) and three-phase (air-water-glass beads) systems. The influence of superficial gas velocity, solid particle concentration, and solid particle size on 𝑘𝐿𝑎 were experimentally explored. The obtained results were justified by taking into account the hydrodynamics, various mass transfer theories applicable to SBCRs. In the last part of the study, a reliable model (i.e. correlation) was developed to estimate the mass transfer coefficient based on the operating conditions, design variables and the properties of the three phases.
Regarding the effect of superficial gas velocity in the air-water system, it was observed that increasing the gas velocity (in a wide range of 0.40-21.30 cm/s) leads to a higher mass transfer rate. This can be attributed to the better contact between the liquid and gas phase, and the more gas holdup. Interestingly, it was noted that regardless of the gas velocity, the variation in the mass transfer coefficient in the radial direction is not significant, which can be partly ascribed to the high
liquid phase mixing in the column. It was found that the concentration (0, 1, 3, and 5% v/v) and size (71 and 156 µm) of solid particles (i.e. glass beads) strongly affect the behavior of the system and the mass transfer rate. The effect of the solid phase on 𝑘𝐿𝑎 depends on the gas velocity. In low gas velocities, the presence of solid particles adversely affects the mass transfer, while at high velocities, solids particles are beneficial. Using large size glass beads (i.e. 156 µm) caused a noticeable improvement in the mass transfer coefficient, mainly due to turbulence increasing in the gas-liquid interface by the particles. The developed correlation for predicting the mass transfer coefficient in two and three-phase systems incorporates Schmidt, Galilei, Froude and Bond numbers, and gas and liquid density, oxygen diffusivity, and column diameter. The developed correlation could reproduce the experimental data successfully: mean absolute percentage error < 4.81% and standard deviation ~ 0.27 %.
TABLE OF CONTENTS
ACKNOWLEDGEMENTS ... III RÉSUMÉ ... IV ABSTRACT ... VI TABLE OF CONTENTS ... VIII LIST OF TABLES ... X LIST OF FIGURES ... XI LIST OF SYMBOLS AND ABBREVIATIONS... XI
INTRODUCTION ... 1
1.1 Problem Statement and Motivation ... 1
1.2 Objectives ... 3
LITERATURE REVIEW ... 4
2.1 Slurry bubble columns ... 4
2.1.1 Concept, types, and applications ... 4
2.1.2 Design and operation ... 6
2.1.3 Hydrodynamics ... 7
2.1.4 Dynamics of gas bubbles ... 16
2.2 Mass transfer ... 17
2.2.1 Theories ... 17
2.2.2 Volumetric mass transfer coefficient, 𝒌𝑳𝒂 ... 21
2.2.3 Mass transfer measurement techniques ... 25
EXPERIMENTAL AND METHODOLOGY ... 27
3.1 Materials ... 27
3.3 Measurement of volumetric mass transfer coefficient ... 30
RESULTS AND DISCUSSION ... 31
4.1 Effect of superficial gas velocity ... 31
4.2 Radial distribution of volumetric mass transfer coefficient ... 34
4.3 Effect of solid concentration ... 36
4.4 Effect of particle size ... 41
4.5 Developing a new model for predicting 𝒌𝑳𝒂 ... 42
4.5.1 Dimensionless analysis to derive correlation ... 42
4.5.2 Applying developed correlation to previous experimental results ... 46
4.5.3 Comparison of the present correlation with other correlations ... 48
CONCLUSION AND RECOMMANDATIONS ... 50
5.1 Conclusion ... 50
5.2 Recommendations ... 51
REFERENCES ... 52
LIST OF TABLES
Table 2.1- Experimental study of the transition regime in the bubble columns (Air-Water) [7, 36]
... 10
Table 2.2- Correlations for predicting (𝑎) and (𝑘𝐿) in BCs and SBCs ... 22
Table 3.1- Physical properties of materials in this work ... 27
Table 3.2- Operating conditions and geometrical specifications of the BC with distributor ... 28
Table 4.1- Solubility of oxygen in water at various temperatures and atmospheric pressure. (MAPE = 1.3 %) ... 33
Table 4.2- Dimensionless numbers used in this work ... 43
Table 4.3- Formulas for calculating density, viscosity, and diffusivity of the slurry phase ... 44
Table 4.4- Literature list for the SBCs parametric study ... 47
LIST OF FIGURES
Figure 2.1- Sketch of different types of bubble column reactors. Adapted from reference [24] ... 5 Figure 2.2- Variables and phenomena affecting the performance of bubble columns. Adapted from reference [25] ... 6 Figure 2.3- Schematic of the flow regimes in bubble column reactors. Adapted from reference [24]
... 7 Figure 2.4- Flow regime diagram in bubble columns depending on gas velocity and column diameter. Adapted from reference [24] ... 9 Figure 2.5- Parameters influencing the Performance of the Slurry Bubble Column Reactor. Adapted from reference [33] ... 12 Figure 2.6- Gas holdup variation with superficial gas velocity. Adapted from reference [44] ... 13 Figure 2.7- Schematic of two film theory. “Mass transfer results from molecular diffusion via the film”. Adapted from reference [83] ... 18 Figure 2.8- Schematic of Higbie’s model. “Each liquid element is in contact with the gas phase for the same amount of time”. Adapted from reference [5] ... 19 Figure 2.9- Schematic of Surface-renewal theory. “Liquid elements at the interface are randomly changed by fresh elements from the bulk”. Adapted from reference [4] ... 20 Figure 2.10- Sketch of oxygen transfer from the air bubble into the water based on two film theory. Adapted from reference [83] ... 24 Figure 3.1- (a) Schematic of experimental set-up (b) Photograph of optical dissolved oxygen probe (Visiferm DO325, Hamilton Inc.) ... 29 Figure4.1- Dissolved oxygen concentration variation for air–water system. ... 31 Figure 4.2- Radial distribution of volumetric mass transfer coefficient in the air-water system. .. 34 Figure 4.3- Radial distribution of 𝑘𝐿𝑎 in the air-water system. ... 35 Figure 4.4- Impact of 𝑈𝐺 on the 𝑘𝐿𝑎 - (a) Air-Water-Glass beads 71𝜇𝑚 - (b) Air-Water-Glass beads 156𝜇𝑚 ... 37
Figure 4.5- Impact of solid particles concentration on the 𝑘𝐿𝑎 at different 𝑈𝐺-(a) Air-Water-Glass
beads 71𝜇𝑚 , (b) Air-Water-Glass beads 156𝜇𝑚 ... 39
Figure 4.6- Effect of particle size on 𝑘𝐿𝑎 at a constant solid concentration ... 41
Figure 4.7- Comparison between the experimental and the predicted value of 𝑘𝐿𝑎 ... 45
Figure 4.8- Applying developed a correlation of 𝑘𝐿𝑎 to previous experimental works ... 46
LIST OF SYMBOLS AND ABBREVIATIONS
Nomenclature
𝑎 Interfacial area [1 𝑚⁄ ]
𝐶0 The dissolved oxygen concentration in the water (t = 0) [𝑚𝑔 𝐿⁄ ]
𝐶𝑖 The dissolved oxygen concentration in the gas − liquid interface [𝑚𝑔 𝐿⁄ ] 𝐶𝐷𝑂 The dissolved oxygen concentration in the water (𝐶𝐿) [𝑚𝑔 𝐿⁄ ]
𝐶𝑂∗2 The dissolved oxygen concentration in the water in equilibrium with 𝑃𝑂2[𝑚𝑔 𝐿⁄ ] 𝐶𝑉 Volumetric solid concentration
𝑑0 Orifice diameter [𝑚𝑚]
𝑑𝑏 Spherical bubble diameter [𝑚]
𝑑𝐵𝑃𝑃𝑆 Bubble Plate ( gas distributor)Pore Size (in the reference [1]) [𝑚] 𝑑𝑃 Solid particle mean diameter [𝜇𝑚]
𝑑𝑠 Sauter mean bubble diameter in the reference [2] [𝑚]
𝑑𝑣𝑠 volume − surface mean bubble diameter (in the reference [3]) [𝑚]
𝐷𝐶 Column diameter [𝑚]
𝐷𝐺 Molecular diffusivity of oxygen from the water to the air bubbles [𝑚2⁄ ] 𝑠 𝐷𝐿 Molecular diffusivity of oxygen from the air bubbles to the water [𝑚2⁄ ] 𝑠
𝑔 Gravitational constant [𝑚 𝑠⁄ ] 2 𝐻 Henry constant [𝑚𝑜𝑙 𝑚⁄ 3. 𝑎𝑡𝑚]
𝐻0 Initial liquid height [𝑚] 𝐻𝐶 Column height [𝑚]
𝐽𝑂2 The molar flux of oxygen from the air bubble through the water [𝑚𝑜𝑙 𝑚
2. 𝑠]
⁄
𝑘𝐺 Local gas − phase mass transfer coefficient [𝑚 𝑠⁄ ] 𝐾𝐺 Overall gas − phase mass transfer coefficient [𝑚 𝑠⁄ ]
𝑘𝐿 Local liquid − phase mass transfer coefficient [𝑚 𝑠⁄ ]
𝐾𝐿 Overall liquid − phase mass transfer coefficient [𝑚 𝑠⁄ ] 𝑘𝐿𝑎 Volumetric liquid phase mass transfer coefficient [1 𝑠⁄ ] 𝑁𝑂2 Oxygen mass transfer rate per unit volume [𝑚𝑜𝑙 𝑚⁄ 2. 𝑠]
𝑃𝑖 Oxygen partial pressure in the gas − liquid interface [𝑎𝑡𝑚] 𝑃𝑂2 Oxygen partial pressure in the air bubble bulk [𝑎𝑡𝑚]
𝑃𝑂∗2 Oxygen partial pressure in equilibrium with liquid phase [𝑎𝑡𝑚]
𝑠 Surface renewal rate related to the rate of production of the fresh surface [4] 𝑡 Time variable [𝑠]
𝑇 Temperature [℃]
𝑈𝐺 Superficial gas velocity [𝑚 𝑠⁄ ] 𝑈𝐿 Superficial liquid velocity [𝑚 𝑠⁄ ] 𝑉𝐺 Gas volume in SBC [𝑚3]
𝑉𝐿 Liquid volume in SBC [𝑚3]
𝑉𝑆 Solid volume in SBC [𝑚3]
𝑉𝑇 The total volume of the three − phase in slurry bubble column [𝑚3]
Dimensionless numbers
𝐵𝑜 Bond number = 𝑔𝜌𝐿𝐷𝐶2⁄ 𝜎𝐿 𝐹𝑟 Froude number = 𝑈𝐺⁄√𝑔𝑑𝐵 𝐺𝑎 Galilei number = 𝑔𝜌𝐿2𝐷𝐶3⁄𝜇𝐿2 𝑆𝑐 Schmidt numbr = 𝜇𝐿⁄𝜌𝐿𝐷𝐿
Greek letters
𝛿𝐺 The film thickness in the gas phase [𝑚]
𝛿𝐿 The film thickness in the liquid phase [𝑚]
𝜀𝐺 Gas holdup [−]
𝜀𝑖 The holdup of phase 𝑖 [−] 𝜇𝐿 Liquid viscosity [𝑘𝑔 𝑚. 𝑠]⁄ 𝜇𝑆𝐿 Slurry viscosity [𝑘𝑔 𝑚. 𝑠]⁄ 𝜌𝐺 Gas density [𝑘𝑔 𝑚⁄ 3] 𝜌𝐿 Liquid density [𝑘𝑔 𝑚⁄ 3] 𝜌𝑆 Solid density [𝑘𝑔 𝑚⁄ 3] 𝜌𝑆𝐿 Slurry density [𝑘𝑔 𝑚⁄ 3] 𝜎𝐿 Surface tension [𝑁 𝑚]⁄
𝜙𝐿 The volume fraction of the liquid phase [−]
𝜙𝑆 The volume fraction of the solid phase [−] 𝜃 Contact time according to penetration theory [5]
Abbreviations
BC Bubble column
BCR Two-Phase bubble column reactor DO Dissolved Oxygen concentration MAPE Mean absolute percentage error SBC Slurry bubble column
SBCR Liquid- Solid suspension (Slurry bubble column reactor) SD Standard deviation
INTRODUCTION
1.1 Problem Statement and Motivation
Bubble column reactors have been used extensively in the past 40 years as gas-solid-liquid contactors and reactors in numerous chemical processes including gas-liquid Fischer-Tropsch synthesis [6], coal liquefaction, hydrodesulphurization, hydrogenation, and biological wastewater treatment [7]. In comparison to other multi-phase reactors, BCR offers far better heat and mass transfer rates, easy maintenance, low capital cost and the possibility of using fine solid catalysts and adding fresh catalysts without shutting down the entire system. Mass transfer rates between different phases significantly influence the performance of BCR and are of great importance in the design and scale-up of this technology [8]. Despite the wealth of research in this area, still, there are many unanswered questions regarding the mass transfer mechanisms in BCR due to the complexity of the system once other influencing factors including fluid dynamics, the chemistry of solution, and solid particle properties are to be taken into account. The main factors that can affect the mass transfer rate in BCR are (i) properties of each phase (ii) operating conditions (including temperature, pressure, and gas velocity), and (iii) reactor dimensions and internals design [9]. In fact, these parameters can affect the gas-liquid mass transfer coefficient and the specific interfacial area between the gas and liquid phase. The influence of the various parameters on the mass transfer coefficient and the interfacial area is discussed in chapter 2.
The liquid side mass transfer coefficient is often the limiting step in the overall mass transfer for many industrial situations in the bubble columns and the slurry bubble columns. The 𝑘𝐿𝑎 decreases significantly in large scale reactors [10], and leads to complexity in the reactor design and scale-up. Many researchers investigated the effect of various parameters on 𝑘𝐿𝑎 in slurry bubble columns
[11-13]. However, the majority of them are done in a laboratory-scale [13] despite the need to know the 𝑘𝐿𝑎 in the actual industrial condition in order to have a reliable large-scale design.
Besides, in most of the industrial applications of SBCRs, the solid particles use as a catalyst to increase the reaction rate and consequently decrease the reactor size. Obviously, the presence of solid particles in the liquid phase changes the apparent viscosity and density of the slurry phase. Therefore, hydrodynamic parameters of the system are changed and consequently, the mass transport rate is also changed. However, considering the complex interaction between so many
phenomena within slurry bubble column reactors, the exact mechanism through which solid phase alters the gas-liquid-solid processes is still a matter of debate. In addition, the impact of the solid concentration and solid physical properties on the overall mass transfer rate has not been fully investigated. Researchers reported various contradictory results about the effect of solid particles on 𝑘𝐿𝑎. Some of them observed an increment in the volumetric mass transfer coefficient by adding
the solid particle into the system [14]. In contrast, other researchers reported that the presence of the particles leads to a decrease in 𝑘𝐿𝑎.
It should be mentioned that the measurement technique itself can be an important issue for measuring the 𝑘𝐿𝑎. The measurement techniques can be divided into direct methods and indirect methods [15]. Direct methods include various methods such as mass spectrometry, dissolve oxygen probe and Polarographic Electrode. Indirect methods use the variations of a specific parameter (such as pressure drop and solution volume) in order to estimate the mass transfer coefficient. So, the direct methods are more accurate.
In the present study, investigations on the bubble column and slurry bubble column are done to define the effect of solid particles and the process conditions on 𝑘𝐿𝑎. A pilot scale slurry bubble column has been utilized for the experimental investigations. Air, water and glass beads are used as materials and a dissolve oxygen probe, as a direct measurement technique, is utilized to measure the local oxygen concentration in the bubble column. The influence of superficial gas velocity (in various flow regimes), solid particle concentration, and particle size on 𝑘𝐿𝑎 were experimentally
explored. After that, a reliable correlation was proposed to estimate the volumetric mass transfer coefficient based on the operating conditions, design variables and the physical properties of the materials.
1.2 Objectives
Mass transfer rate is one of the most important parameters that should be determined in advance to precisely design bubble columns. From an economical point of view, increasing the mass transfer rate is highly wanted and is one of the basic problems in industries.
The overall objective of the present study is the experimental investigation of the volumetric mass transfer coefficient in a pilot-scale slurry bubble column reactor. To do so, the following sub-objectives were performed.
❖ Objective 1: Experimental study of the volumetric mass transfer coefficient in the bubble column to define the effect of process parameters on the radial 𝑘𝐿𝑎.
❖ Objective 2: Define the effect of the particle size and concentration on the 𝑘𝐿𝑎 in the slurry bubble column
❖ Objective 3: Develop a new correlation for predicting the volumetric gas-liquid mass transfer coefficient for slurry bubble columns
LITERATURE REVIEW
2.1 Slurry bubble columns
2.1.1 Concept, types, and applications
Multiphase reactors are solid-liquid-gas contactors and reactors in which chemical reactions can take place [16]. Multiphase reactors are typically divided into three main categories, namely, trickle bed, fluidized bed, and bubble column reactors [7]. A bubble column reactor is basically a vertical column in which the gas phase in the form of bubbles are dispersed at the bottom of the column into a liquid phase (Two- phase bubble column (BCR)) or liquid- solid suspension (Slurry bubble column reactors (SBCR)) [7]. SBCRs have attracted tremendous attention in various industries and have been extensively employed in chemical and environmental processes [17-19]. In particular, BCRs are used in biotechnology, petrochemical processes, oxidation, hydrogenation of unsaturated oils, polymerization, alkylation and chlorination, effluent/wastewater treatment process, flotation and metallurgical operations (leaching of metal ores) [20], Fischer-Tropsch (FT) [21], catalytic chlorination of alkenes [18] and the hydro-conversion of petroleum residues and heavy oils [22]. Bubble column reactors offer a number of advantages in design and operation as compared to other reactors, which grant them enormous popularity and applicability in many fields. Bubble column reactors have unique mass and heat transfer characteristics which lead to high mass and heat coefficient due to enhanced dispersion of gas into liquid [20]. Additionally, simple design, low operating cost, and maintenance due to the lack of any mechanically operated parts, low energy input needed and high durability of catalysts are other positive aspects of BCRs [20]. On the other hand, the possibility of online catalyst addition and withdrawal ability and plug-free operation are other merits of these systems. The bubble column can be designed to work in either semi-batch mode (the superficial liquid velocity of 𝑈𝐿 ≅ 0) or in continuous mode (either co-currently (𝑈𝐿 >
0) or counter-currently (𝑈𝐿 < 0) ) [23]. Figure 2-1 illustrates several types of bubble column reactors.
Single Stage Multi Staged Multi-Channel
Loop Reactor Jet Reactor Downflow BC
With Static Mixers Fluidized Bed Slurry Reactor
2.1.2 Design and operation
During the design and scale-up of BCRs, three main phenomena should be taken into consideration: (i) heat and mass transfer characteristics; (ii) mixing characteristics; (iii) chemical kinetics of the reacting system. In line with this, the performance of a bubble column reactor strongly depends on a number of interconnected variables and processes. Figure 2-2 provides some of the key parameters and steps that determine the overall efficiency of bubble columns. Reaction orders with respect to reactants and products, rate constant, liquid- and solid- side mass transfer coefficients are extremely influential. In BCRs a stream of gas (dispersed phase) in the form of bubbles is injected into a liquid phase (continuous phase); accordingly, it is essential to understand the hydrodynamic aspects of the gas phase. Important parameters that influence hydrodynamics and mass transfer rate in SBCRs are flow regimes, gas holdup, bubble shape, bubble size, rise velocity, back mixing, pressure and temperature, the chemistry of gas/liquid/solid, solid particles properties, and reactor dimensions and design.
Figure 2.2- Variables and phenomena affecting the performance of bubble columns. Adapted from reference [25]
2.1.3 Hydrodynamics
It is widely acknowledged that the operating conditions, design, and geometry of the column impact the hydrodynamics of the SBCRs [26-28]. The key hydrodynamic parameters of bubble column reactors are discussed in the following sections.
2.1.3.1 Flow regime
The flow regimes in bubble column reactors are of three types: homogeneous flow regime (bubbly flow), heterogeneous flow regime (churn-turbulent), and slug flow regime, which are essentially defined by the operating conditions (mainly the superficial gas velocity) (depicted in Figure 2-3).
Homogeneous
Heterogeneous
Bubbly Flow Churn Turbulent
Slug Flow
Figure 2.3- Schematic of the flow regimes in bubble column reactors. Adapted from [24] The homogeneous flow regime (perfect or bad bubbly flow) is usually seen at low superficial gas velocities, (3-8 cm/s in semi-batch bubble columns) [29]. This flow regime is marked by a narrowed bubble size distribution and the generated bubbles are relatively spherical and have uniform small sizes (1–7 mm [30]).
A uniform bubble distribution and fairly mild mixing are witnessed over the entire cross-sectional area of the column [31]. There is no bubble coalescence or breakage in this regime, therefore, the
size of bubbles is controlled by gas sparger design and also properties of the system [32]. In this regime, the gas bubbles do not influence the motion of the liquid motion and almost no liquid mixing is observed [33].
The heterogeneous flow regime is marked by a wide bubble size distribution and generated bubbles are non-uniform in both small and large sizes. This type of regime is obtained at high superficial gas velocities (greater than 5 cm/s in batch columns) or when gas sparger generates large bubble via large size orifices [34]. In a heterogeneous flow regime, there is severe bubble coalescence and breakage, so, there are different sizes of bubbles in the column [7]. Due to the harsh turbulent motion of gas bubbles and liquid recirculation unsteady flow patterns and large bubbles with short residence times are formed by coalescence [7]. This flow regime is often seen in industrial-size and large diameter columns [31]. Despite the fact that the gas–liquid mass transfer coefficient is lower at heterogeneous regime (compared to homogeneous flow), BCRs are normally run under heterogeneous flow conditions in the chemical industry. Slug flow regime, characterized by bullet-shaped bubbles (extended over the entire column diameter), occurs in laboratory columns with small diameters and at high gas velocities [7]. This regime is formed as a result of the formation of bubble slugs when larger bubbles are stabilized by the column wall [29].
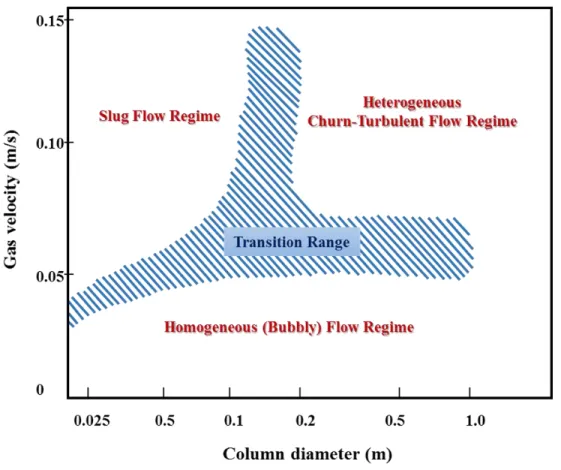
Between these two flow regimes (homogeneous and heterogeneous), there is a transition flow regime where the stability of the system from homogeneous flow regime decreases and a large circulation is forming due to a cluster of bubbles [34]. Figure 2-4 shows those regimes based on superficial gas velocity versus reactor diameter, where the shaded region indicates the transition flow regime [29]. This map is valid for both bubble and slurry bubble columns with a batch liquid phase operated with a low viscosity liquid phase. When the gas velocity is low (< 0.04 m/s), the BCR usually operates in the homogeneous flow regime and the column diameter has little impact on the flow regime. For columns with very small diameters, an increase in gas velocity can change the flow regime and formation of slugs will be observed.
Figure 2.4- Flow regime diagram in bubble columns depending on gas velocity and column diameter. Adapted from reference [24]
Knowing the conditions at which regime transition from homogeneous to turbulent take place is quite important since significant changes are noted in the hydrodynamic behavior of the system. Thorat and Joshi [32] proposed that the transition gas velocity depends on the diameter and height of the column (aspect ratio (L/D)), sparger design, and physical properties of the system. Sarrafi et al. [35] conducted a comprehensive study on the existing literature on the transition superficial gas velocity and concluded that generally, the velocity falls in the range of 0.044-0.067 m/s. Table 2-1 lists the results of the literature studies with an air–water system for the regime transition properties.
Table 2.1- Experimental study of the transition regime in the bubble columns (Air-Water) [7, 36] Researcher(s) Transition velocity (m/s) Transition gas holdup (%)
Krishna et al. [37] 0.0330 19.8
Yamashida & Inoue [38] 0.0400 23.4
Hyndman et al. [31] 0.0370 13.7
Bach & Philhofer [39] 0.0463 27.7
Kastanek et al. [40] 0.0510 20.4
Drift-flux is one of the methods to detect transition region which is based on plotting the drift flux velocity (𝑗𝐺𝐿) against the gas holdup (𝜀𝐺). 𝑗𝐺𝐿 is given by equation 2-1:
𝑗
𝐺𝐿= 𝜀
𝐺(1 − 𝜀
𝐺) (
𝑈𝐺 𝜀𝐺±
𝑈𝐿
1−𝜀𝐺
)
(2-1)where (+) sign indicate co-current flows and (-) sign means counter-current flows of the gas–liquid. In this technique, the drift flux,
𝑗
𝐺𝐿 (the volumetric flux of any phase virtual to a surface moving at the volumetric average velocity) is plotted against the superficial gas velocity,𝑈
𝐺.The change in the slope of the curvature shows the transition from homogeneous flow regime to heterogeneous flow regime.
The gas holdup is an important dimensionless key factor which plays a central role in the design of BCRs. It is basically defined as the volume fraction of gas in gas-liquid or gas- liquid suspension phase [24]. Similarly, the liquid and solid phase holdups are the volume fraction of liquid and solid phases, respectively.
In slurry bubble columns, the total volume (𝑉𝑇𝑜𝑡𝑎𝑙) of the three-phase system is given by the
following expression:
𝑉
𝑇𝑜𝑡𝑎𝑙= 𝑉
𝐺𝑎𝑠+ 𝑉
𝐿𝑖𝑞𝑢𝑖𝑑+ 𝑉
𝑆𝑜𝑙𝑖𝑑(2-2)
As a result, the holdup of any phase, i, can be presented by the following equation [29]:
𝜀
𝑖=
𝑉𝑖𝑉𝑇𝑜𝑡𝑎𝑙 (2-3)
For three-phase SBCRs, Li and Prakash [41] put forward the following approach for measuring the gas holdup. The static pressure drop along the bed height can be calculated by:
∆𝑃 = (𝜌
𝐺𝜀
𝐺+ 𝜌
𝐿𝜀
𝐿+ 𝜌
𝑆𝜀
𝑆)𝑔∆𝐻
(2-4) where 𝑔, ρ, and ∆𝐻 are the gravitational acceleration, density, and height difference between the transducers, respectively. After some rearrangements, the following equation for finding the 𝜀𝐺(gas holdups) is obtained:
𝜀
𝐺= 1 −
1 𝑔(𝜌𝐿𝜙𝐿+𝜌𝑆𝜙𝑆)Δ𝑃
Δ𝐻 (2-5)
where 𝜙𝐿 and 𝜙𝑆 are volume fraction of liquid and solid phase, respectively.
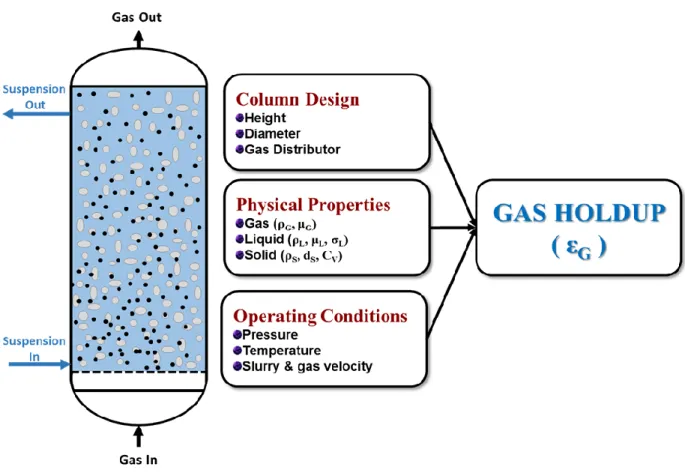
The gas holdup depends on several factors: operating conditions, physical properties of the gas/liquid/solid phase, column geometry, sparger design, and solid loading. Figure 2.5 summarizes different SBCRs parameters that influence gas holdup.
Figure 2.5- Parameters influencing the Performance of the Slurry Bubble Column Reactor. Adapted from reference [33]
Generally, gas holdup increases with raising gas velocity and operating pressure and declines with increasing liquid viscosity and solid concentration. In bubble columns, the effect of column size on gas holdup becomes negligible as the aspect ratio reaches 5 [33]. There are a number of methods to determine the gas holdup: electroconductivity, X-ray transmission, mean resistance time distribution, optical fiber probes, particle image velocimetry, and computer tomography [42, 43]. A popular approach is plotting gas holdup against gas velocity to find the dominant flow regime. Figure 2-6 shows that with increasing gas velocity gas holdup increases and flow regime moves from the homogeneous region to the heterogeneous region [44].
Figure 2.6- Gas holdup variation with superficial gas velocity. Adapted from reference [44]
Another method is the pressure profile method in which we basically measure the static pressure at several points (using manometers or pressure transducers) to find the pressure drop along the bed [45-48].
2.1.3.3 Superficial gas velocity
Superficial gas velocity is the average velocity of the gas that is injected into the column. This parameter can be easily calculated by dividing the volumetric flow rate by the cross-sectional area of the column. In BCRs, an increment in the superficial gas velocity leads to a rise in the gas holdup [26, 31, 41, 49-54]. This relationship is more valid for the bubbly flow regime as opposed to the churn-turbulent regime [55, 56].
2.1.3.4 Liquid phase properties
The properties of the liquid phase affect bubble formation and coalescence, which is turn has an impact on the gas holdup. In this regard, in liquids with high viscosities, larger bubbles can form which have higher rising velocities and lower gas holdup [57]. This decrease of the gas holdup in liquids with high viscosities can be attributed to either an increase in the initial bubble size or a reduction of bubble breakage due to a decrease collide of bubbles in a liquid result in a decrease in turbulence rate [57, 58]. In a comprehensive study with several organic liquids [59], it was indicated that the gas holdup is higher for mixtures compared to pure liquid with similar properties (surface tension, density, viscosity). Tang and Heindel [60] suggested that tap water (the most frequently used liquid in bubble columns) brings about reproducibility issues in the air–water two phase studies since the volatile compounds in tap water can influence the coalescence and subsequently the gas holdup in the column.
2.1.3.5 Solid particles
Solid particles, which usually serve as catalysts, affect the hydrodynamics and mass transfer in bubble columns. Chilekar et al. [61]analyzed this from two perspectives: (i) increase of viscosity and (ii) change in bubble coalescence due to the wetting properties in the liquid phase. The effect of solid particles on the hydrodynamics of SBCRs stems from a number of physical processes, which are elaborated below.
Density effect: Basically, due to the addition of solid particles, the density of the medium in which bubbles are rising changes. Therefore, bubble rise velocity resulting from the buoyancy alteration is influenced.
Viscosity effect: It is known that the viscosity of the slurry phase increases with solid particles concentration, size, and density [44, 62, 63]. According to the literature, viscosity can have two contradictory effects: (i) higher viscosity leads to superior bubble coalescence and lower bubble breakage, and thus gas holdup is lowered; (ii) bubble rise velocity declines at higher viscosities and thus the gas holdup increases.
Primary bubble size: Solid particles can affect bubble formation during both the expansion and the detachment stages. Variations in bubble formation can in turn influence gas holdup and regime transition.
Effect of bubble-particle interaction on bubble rise velocity: It is believed that bubble motion can be restricted by the presence of solid particles, leading to a lower rise velocity [64]. On the contrary, solid particles encourage a lateral movement of bubbles due to a collision.
Solid particles non-uniform spatial distribution: The haphazard and disordered distribution of solid particles within the column can diminish the stability of the homogeneous regime in SBCRs [65]. Regarding the influence of solid concentration and size on gas holdups, there is no general consensus. In this context, some researchers reported that increasing the solid concentration leads to an inferior gas holdup [26, 50, 52, 55, 57, 66-68]. The experiments of Kara et al. [67]and Kato et al. [66] revealed that gas holdup strongly depends on solids concentration at low especially at high gas velocities (>10–20 cm/s). For particle size, the phenomenon is more complicated since size effect is connected to flow regime, gas velocity and solid concentration. In one study [53], it was noted that at a fixed gas velocity and solid concentration, increasing the particle size decreased the holdup [53]. Interestingly, it was reported that unlike small gas bubbles, large bubble holdups are independent of solids concentration [50]. Li and Prakash [41, 57] observed a decrease in a holdup with solid concentration up to 25% vol. followed by a small increment at higher concentrations. This trend was ascribed to the accumulation of fine bubbles at high concentrations and a decrease in the rise velocity of small bubbles. In contrast, results of Krishna et al. [50] and de Swart et al. [69] experimental work with air-paraffin oil-glass beads three-phase system suggested that the holdup of large gas bubbles is independent of solid concentration up to 36 vol.%.
2.1.4 Dynamics of gas bubbles
The dynamics of gas bubbles are mainly influenced by the bubble size and distribution in the liquid phase throughout the column. The behavior and size of bubbles depend on the hydrodynamic flow regime, the liquid properties, reactor design, gas sparger design, and superficial gas velocity. In turn, the gas-liquid interfacial area and overall mass transfer rate strongly depend on the bubble size.
It has been suggested that in the homogeneous flow regime, bubble have narrow size distributions and there are less bubble-bubble interactions [70]. However, at higher superficial gas velocities, once we enter the churn turbulent regime, due to greater interactions between bubbles, breakage and coalescence can take place, leading to more diverse bubble sizes (generally discussed as small and large bubbles) [71]. Obviously, bubble breakage and coalescence phenomena affect both the size of the bubble and bubble rise velocity. Large bubbles rise fast and result in back mixing, while small gas bubbles move much more slowly and re-circulate within the slurry. Regarding the impact of gas flow rate on bubble size and rise velocity, Akita and Yoshida [3] observed a steady decline in bubble size with gas flow rate, while, several other researchers witnessed [41, 53, 72] appearance of a maximum bubble size upon increasing the superficial gas velocity. They also reported that generally larger bubbles present in the center of the column and smaller ones are closer to the walls. Prakash et al. [49] found that the rise velocity of small bubbles goes down with increasing the superficial gas velocity, whereas for large bubbles it follows an upward trend. Previous studies showed that the bubble size increases with liquid viscosity [57] and decreases with liquid surface tension [3]. Different from this study, Schafer et al. [73] reported that as the liquid viscosity or surface tension was reduced, the bubble diameters also dropped. Luo et al. [74] examined the influence of pressure on gas bubble properties and suggested that at a higher pressure, bubble size diminishes. This is in agreement with the study of Schafer et al. [73], in which it was indicated that higher temperature or pressure brings about smaller bubble sizes. In the presence of solids, larger bubble sizes have been evidenced by several researchers [41, 57, 74], which was ascribed to the increment in the apparent viscosity of the liquid medium.
Two phenomena significantly impact the gas bubble size and, therefore, the behavior of bubbles in SBCRs: coalescence and breakup. When two bubbles collide, a small amount of liquid is trapped
between the bubbles. During the drainage of this liquid in the next step, the liquid films on droplets are ruptured and provide the possibility for bubbles to coalescence. It is noteworthy that coalescence occurs only if sufficient time is given for the trapped liquid to reduce the film thickness. Generally, three forces account for bubble collisions: 1) turbulence from the random motion of bubbles, 2) buoyancy, and, 3) laminar shear [75]. In respect to bubble breakup, the majority of researchers applied the Rayleigh-Taylor instability or the theory of isotropic turbulence to calculate the maximum stable bubble size in the turbulent flow regime (i.e. bubble prior to breakup) [75-81]. Rayleigh-Taylor instability considers a balance between the surface tension and gravity forces acting on a gas bubble. In case the gravity force is stronger than the surface tension, the bubble will breakup. In the isotropic turbulence mechanism, the velocity fluctuations imposed by the turbulent eddies put pressures on the gas bubbles, leading to bubble deformation and finally breakup.
Different methods have been put forward to estimate bubble size, shape, and velocity [7]. Among various methods, dynamic gas disengagement technique has been used extensively to study bubble behavior in SBCRs [82]. The central idea on which this technique was built is that small and large bubbles can be distinguished if there are considerable differences between their rise velocities.
2.2 Mass transfer
2.2.1 Theories
In slurry bubble column reactors comprehensive understanding of governing mass transfer mechanism(s) and mass transfer rate across the interface between the liquid and gas phases are of paramount importance since they directly affect the design and operation of the system. In this respect, theoretical models can be helpful to describe the mass transfer phenomena and the rate. Among various theories, the two-film theory, the penetration theory, and the renewal theory are the most reliable ones which have been applied to different types of BCRs. In the following section, the main components of these theories are introduced.
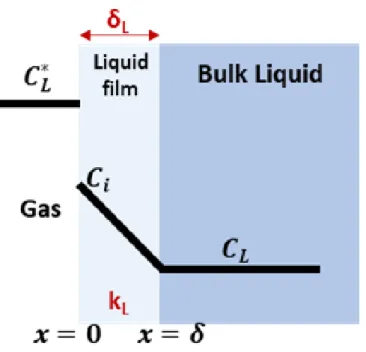
2.2.1.1 Two-film theory
For mass transfer between gas and liquid, the two-phase theory is the most famous theory. This theory was first proposed by Lewis and Whitman [83] back in 1924 for gas absorption. The main pillars of this theory are: (i) absence of turbulence near the interface and (ii) mass transfer resistance is in two hypothetical films on both sides of the interface. Some of the main assumptions utilized to develop the two-film theory are listed below:
1) There is a film of thickness (𝛿) in both the gas and liquid phases, which is separated by the interface.
2) Mass transfer stems from the molecular diffusion within the film. 3) Mass transfer through the film is steady state.
4) The mass transfer happens at low concentrations and, therefore, the mass flux is small. For convective mass transfer, liquid-side mass transfer coefficient is determined by equation 2-6
𝑘
𝐿=
𝐷𝐿𝛿𝐿
(2-6)
Figure 2.7- Schematic of two film theory. “Mass transfer results from molecular diffusion via the film”. Adapted from reference [83]
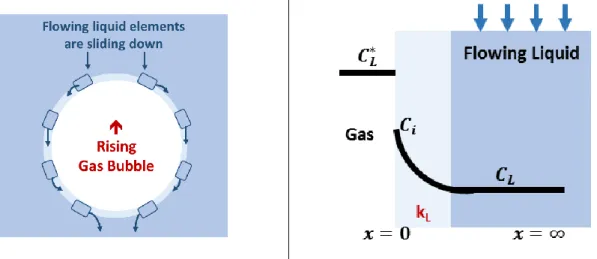
2.2.1.2 Penetration theory
As illustrated in Figure 2-8, the principal assumption in penetration theory (or Higbie’s model) is that each liquid element is in contact with the gas for a short period of time. Put it differently, turbulent eddies move from the bulk of towards the interface, have a short residence time at the interface and result in the mass transfer, and then go back to the bulk. Furthermore, to achieve an acceptably accurate yet simple model, the following assumptions were also made:
1) Mass transfer from the gas to the liquid can be regarded as an unsteady state, 2) Each liquid element is in contact with the gas phase for the same amount of time. 3) There is an equilibrium state at the gas-liquid interface.
The liquid side mass transfer coefficient in terms of the contact time (θ) and the molecular diffusivity of the gas into the liquid is calculated by [5] :
𝑘
𝐿= 2(
𝐷𝐿 𝜋𝜃)
0.5
(2-7)
It should be mentioned that mass transfer is greatest for the shortest 𝜃 and for long contact times liquid side mass transfer coefficient (𝑘𝐿) tends to zero.
Figure 2.8- Schematic of Higbie’s model. “Each liquid element is in contact with the gas phase for the same amount of time”. Adapted from reference [5]
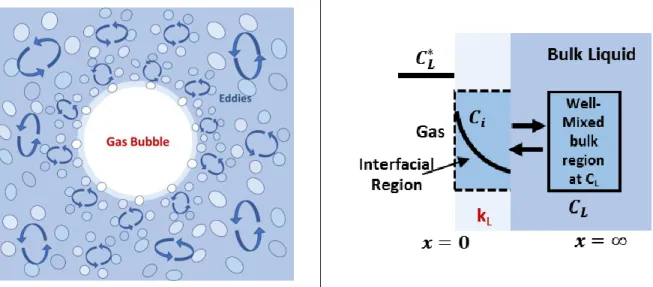
2.2.1.3 Surface-renewal theory
The foundation of the surface-renewal theory is based on the penetration theory. However, in the surface-renewal theory, a more probable (or universal) case is considered. The liquid phase is divided into two regions: the major portion of the liquid (i.e. bulk region) which is well mixed and the interfacial region. Moreover, a number of assumptions were used:
1) Liquid elements at the interface are replaced by new elements from the bulk 2) At any time, each liquid element at the interface can be replaced by a new element 3) Mass transfer from the gas into the liquid element is unsteady-state.
The liquid-side mass transfer coefficient in terms of the surface renewal frequency (𝑠) and the molecular diffusivity of the gas into the liquid can be calculated by [4]:
𝑘
𝐿= (𝐷
𝐿𝑠)
0.5 (2-8)Figure 2.9- Schematic of Surface-renewal theory. “Liquid elements at the interface are randomly changed by fresh elements from the bulk”. Adapted from reference [4]
2.2.2 Volumetric mass transfer coefficient, 𝒌
𝑳𝒂
Based on previous studies [10, 14, 55, 84-97], it is logical to postulate that the total mass transport between the gas and the liquid phase in SBCRs is controlled by the mass transfer from the gas-liquid interface to the bulk gas-liquid. Consequently, we need to determine the gas-liquid-side mass transfer coefficient (𝑘𝐿) and the gas-liquid interfacial area (𝑎).
In a unit volume of a BCR, gas holdup made up of n bubbles can be expressed by the following equation (assuming spherical bubble with diameter db):
𝜀
𝐺=
𝑉𝐺 𝑉𝑇𝑜𝑡𝑎𝑙=
𝑛(𝜋𝑑𝑏 3 6 ) 𝑉𝑇𝑜𝑡𝑎𝑙 (2-9)The interfacial area in the unit volume is defined as
𝑎 =
𝑇𝑜𝑡𝑎𝑙 𝑠𝑢𝑟𝑓𝑎𝑐𝑒 𝑎𝑟𝑒𝑎 𝑜𝑓 𝑏𝑢𝑏𝑏𝑙𝑒𝑠 𝑇𝑜𝑡𝑎𝑙 𝑣𝑜𝑙𝑢𝑚𝑒=
𝑛(𝜋𝑑𝑏2)
𝑉𝑇𝑜𝑡𝑎𝑙 (2-10)
Combining these two expressions (2-9) and (2-10), equation (2-11) provides the specific interfacial area [34]:
𝑎 =
6𝜀𝐺𝑑𝑏 (2-11)
Therefore, the specific interfacial area is a function of gas holdup and bubble size. Having small bubbles in the reactors and large gas holdup lead to a high gas-liquid interfacial area, in other words, good interphase contacting between phases.
Despite the fact that there are numerous articles on the overall volumetric mass transfer coefficient, only a handful of works have been dedicated to the study of 𝑘𝐿 and interfacial area separately in slurry bubble column reactors [98, 99]. This limits our understanding of dominant gas-liquid mass transfer mechanisms.
Finding the liquid-side mass transfer coefficient, based on the equation presented in sections 2.2.1.1-2.2.1.3, necessitates the knowledge of the gas-liquid diffusivity (𝐷𝐿) and the liquid film thickness (𝛿) or contact time (𝜃) or surface renewal frequency (𝑠), depending on which mechanism is dominant. The diffusivity can be found in available literature correlations, however, the
measurement of 𝛿, 𝜃 𝑎𝑛𝑑 𝑠 can be a challenging task. Table (2-2) lists previous studies that focused on measuring 𝑘𝐿 and interfacial area.
Table 2.2- Correlations for predicting (𝑎) and (𝑘𝐿) in BCs and SBCs
Researchers group
Model prediction
Akita & Yoshida (1974) [3] 𝑘𝐿 = 0.5𝑔0.625𝜌𝐿0.375𝜎𝐿−0.375𝐷𝐿0.5𝑑𝑣𝑠0.5 Godbole et al. (1984) [100] 𝑘𝐿 = 1.12 × 10⁻⁴𝑈𝐺−0.03𝜇𝐿−0.5 𝑎 = 19.2𝑈𝐺0.47𝜇𝐿−0.76 Miyahara et al. (1997) [2] 𝑘 𝐿 = 2 × 10⁻⁴( 𝜇𝐿 𝜌𝐿𝐷𝐿) 0.5(𝜌𝐿𝑈𝐺𝑑𝑠 𝜇𝐿 ) 3(𝑔𝜇𝐿4(𝜌𝐿−𝜌𝐺) (𝜌𝐿2𝜎𝐿3) ) 0.45 𝐷𝐿 𝑑𝑠 𝑎 = 24.37𝜀𝐺0.973𝜎𝐿−0.766𝜇𝐿−0.192, 2 − 𝑃ℎ𝑎𝑠𝑒 𝑎 = 35𝜀𝐺0.973𝜎𝐿−0.766𝜇𝐿−0.192, 3 − 𝑃ℎ𝑎𝑠𝑒 Neme et al. (1997) [101] 𝑘𝐿 = 0.105𝑈𝐺(𝑅𝑒𝐹𝑟𝑆𝑐2)−0.268 , 2 − 𝑃ℎ𝑎𝑠𝑒 𝑘𝐿 = 0.103𝑈𝐺(𝑅𝑒𝐹𝑟𝑆𝑐2)−0.265 , 3 − 𝑃ℎ𝑎𝑠𝑒 Schumpe et al. (1987) [88] 𝑘𝐿 = 9.7 × 10⁻⁵𝑈 𝐺−0.05𝜇𝐿0.15 , (𝐻2𝑂/𝑆𝑎𝑙𝑡 𝑆𝑜𝑙𝑢𝑡𝑖𝑜𝑛) 𝑘𝐿 = 6.45 × 10⁻⁵𝑈𝐺−0.05𝜇𝐿0.15 , (𝐻2𝑂/0.8𝑀 𝑁𝑎2𝑆𝑂4) Tomida et al. (1978) [102] 𝑎 = 4.65 × 10⁻¹²(𝑈𝐺 𝜇𝐿) 0.51 Vázquez et al. (2000) [1] 𝑘𝐿 = 0.17587 𝑈𝐺0.5𝜎𝐿1.35, (𝑑𝐵𝑃𝑃𝑆 = 150 − 200 𝜇𝑚) 𝑘𝐿 = 0.18233 𝑈𝐺0.5𝜎 𝐿1.35, (𝑑𝐵𝑃𝑃𝑆 = 90 − 150 𝜇𝑚) 𝑘𝐿 = 0.18689 𝑈𝐺0.5𝜎𝐿1.35, (𝑑𝐵𝑃𝑃𝑆 = 40 − 90 𝜇𝑚)
Several works have been devoted to the investigation of the effect of operating conditions and solid concentration on 𝑘𝐿𝑎. For instance, 𝑘𝐿𝑎 improves with increasing the superficial gas velocity, gas density and operating pressure while it deteriorates with liquid viscosity. Behkish et al. [103] showed that at higher solid concentrations, volumetric mass transfer coefficient possesses lower values. They justified this behavior by pointing out that upon addition of solids, the bubble coalescence leads to the formation of larger bubbles and thus decrement in the interfacial area [103].
Similarly, Kim et al. [104] observed that 𝑘𝐿𝑎 value increased by using Al2O3 nanoparticles at low
concentrations due to the bubble breakage effect. However, at higher solid concentrations (i.e. higher liquid viscosity), the formation of larger bubbles is facilitated due to the coalescence. Vandu and Krishna [10] developed a model for high slurry concentrations and high superficial gas velocities (0-40 cm/s) in bubble column at ambient conditions and revealed that volumetric mass transfer coefficient is mainly dependent on the gas holdup.
2.2.2.1 Oxygen transfer from air bubbles into the water
Transfer of one component such as oxygen from the air bubble (gas phase) into the water (liquid phase) has several steps and resistances. It is widely accepted that the resistance associated with the liquid film encompassing the gas bubbles contributes the most to the overall mass transfer resistance. In this context, the two film model has been applied by many researchers to investigate the gas–liquid mass transfer. A schematic representation of different stages of mass transfer according to the two-film theory is brought in Figure 2-10.
Figure 2.10- Sketch of oxygen transfer from the air bubble into the water based on two film theory. Adapted from reference [83]
As can be seen in this figure, the mass flux in each film can be calculated by multiplying the concentration difference (i.e. the driving force) by the mass transfer coefficient.
𝐽
𝑂2= 𝑘
𝐺(𝑃
𝑂2− 𝑃
𝑖) = 𝑘
𝐿(𝐶
𝑖− 𝐶
𝐷𝑂)
(2-12) Where 𝐽𝑂2 is the molar flux of oxygen (𝑚𝑜𝑙𝑚2𝑠), and 𝑘𝐿 and 𝑘𝐺 are the local mass transfer coefficients. 𝑃𝑂2 and 𝑃𝑖 are oxygen partial pressures in the air bubble and the gas-liquid interface, respectively. Similarly, 𝐶𝐷𝑂 and 𝐶𝑖 are the dissolved oxygen concentrations in the bulk liquid and the interface,
Considering the fact that the interfacial concentrations cannot be directly measured, the above equation should be rewritten as:
𝐽
𝑂2= 𝐾
𝐺(𝑃
𝑂2− 𝑃
𝑂∗2) = 𝐾
𝐿(𝐶
𝑂∗2− 𝐶
𝐷𝑂)
(2-13) where 𝑃𝑂∗2 is the oxygen pressure in equilibrium with the liquid phase, 𝐶𝑂∗2 is the oxygen saturation concentration (calculated by Henry's law,𝑃
𝑂2
∗
= 𝐻𝐶
𝑂∗2) in the bulk liquid in equilibrium to the bulk gas phase, and 𝐾𝐺 and 𝐾𝐿 are the overall mass transfer coefficients.
If we combine these two equations (2-12 and 2-13), we reach the following correlation:
1 𝐾𝐿
=
1 𝑘𝐿+
1 𝐻𝑘𝐺 (2-14)Considering the fact that the oxygen solubility in water is small (so 𝐻 is very large), it is logical to neglect the second term in equation 2-14, and only consider the resistance in liquid side of the interface. Consequently, the overall mass transport coefficient will be equal to the local coefficient:
𝐾
𝐿= 𝑘
𝐿.In SBCR, the oxygen mass transfer rate per unit volume, 𝑁𝑂2, can be expressed as:
𝑁
𝑂2= 𝑎. 𝐽
𝑂2= 𝑘
𝐿𝑎(𝐶
𝑂∗2− 𝐶
𝐷𝑂)
(2-15) In this equation, the overall flux (which is mol/s per surface area) is multiplied by the gas-liquid interfacial area (which is surface area per unit of liquid volume) to obtain molar flowrate per unit volume.2.2.3 Mass transfer measurement techniques
In SBCRs, one of the key obstacles against an accurate estimation of mass transfer is measuring local concentrations. In order to determine the gas-liquid interfacial area and mass transfer coefficient in multi-phase systems, the measurement techniques can be mainly divided into direct methods and indirect methods [15]. In direct methods, the diffusion coefficient is assessed by measuring the concentration of diffusing species as a function of depth of penetration [105]. Radioactive tracer technique, mass spectrometry, and spectrophotometry are among the most
common direct physicochemical methods. It is to be noted that despite the fact that direct methods are very reliable, they are also costly, time-consuming and intrusive.
In indirect approaches, changes in one of the system parameters that are dependent on the diffusion rate are tracked to calculate the diffusion coefficient. In this context, the rate of change of solution volume, the rate of pressure-drop in a confined cell, the rate of gas injection from the top to a cell (in which pressure and solution volume are fixed), and magnetic field characteristics are the most widely applied parameters. Unlike the direct methods, with indirect approaches, it is not necessary to measure the variations in the chemical composition of phases. Some of the well-known approaches are: pressure decay, magnetic resonance imaging, CAT scanning, and low field NMR, and dynamic pendant drop shape analysis [106-111].
EXPERIMENTAL AND METHODOLOGY
3.1 Materials
Oil – free air supplied by a central compressor is used as the gas phase. The flow rate of air is controlled by two rotameters, which allow operating in both homogeneous and heterogeneous flow regimes. The superficial gas velocity can be varied from 0.4 𝑐𝑚/𝑠 𝑡𝑜 25 𝑐𝑚/𝑠. Nitrogen is also employed as a gas phase as well in the saturation method to remove dissolved oxygen in the liquid medium.
Tap water serves as the liquid phase in all experiments which are being operated in batch mode (only gas flows upward). Glass beads are used in the column as the solid phase to obtain the slurry phase. It is to be noted that the experiments are conducted in the semi- batch mode. Prior to the addition of solid phase (i.e. glass beads) to the liquid, the initial height of liquid in the column is 1.10 meter. Two different sizes of hydrophilic glass beads are employed: 71 𝜇𝑚 and 156 𝜇𝑚, both having a density of 2500 𝑘𝑔/𝑚3. The volume fractions (𝐶𝑉) of solid particles in the liquid phase
are: 0, 1, 3 and 5 %.
Table 3.1- Physical properties of materials in this work
Physical properties (20°C)
Gas: 𝐴𝑖𝑟 𝜌𝐺 = 1.225 (𝑘𝑔 𝑚⁄ 3) 𝜇𝐺 = 1.83 × 10⁻⁵(𝑘𝑔 (𝑚. 𝑠))⁄ Liquid: 𝑇𝑎𝑝 𝑤𝑎𝑡𝑒𝑟 𝜌𝐿 = 997.04 (𝑘𝑔/𝑚3) 𝜇𝐿 = 0.001002 (𝑘𝑔 (𝑚. 𝑠))⁄ 𝜎𝐿 = 0.0729 (𝑁 𝑚⁄ ) 𝐷𝐿 = 2.56 × 10⁻⁹ (𝑚2⁄ ) 𝑠 Solid: 𝐺𝑙𝑎𝑠𝑠 𝑏𝑒𝑎𝑑𝑠 𝜌𝑆 = 2500 (𝑘𝑔 𝑚⁄ 3) 𝐶𝑉 = 0, 1, 3, 5% 𝑑𝑃 71 𝜇𝑚 10% 𝑓𝑖𝑛𝑒𝑟 𝑡ℎ𝑎𝑛 59 (𝜇𝑚) 𝑎𝑛𝑑 90% 𝑓𝑖𝑛𝑒𝑟 𝑡ℎ𝑎𝑛 85 (𝜇𝑚) 156 𝜇𝑚 10% 𝑓𝑖𝑛𝑒𝑟 𝑡ℎ𝑎𝑛 125(𝜇𝑚) 𝑎𝑛𝑑 90% 𝑓𝑖𝑛𝑒𝑟 𝑡ℎ𝑎𝑛 192(𝜇𝑚)3.2 Experimental Setup
Figure 3.1 shows a schematic of the experimental set up used to study the volumetric mass transfer coefficient in the slurry bubble column in this work. All experiments are carried out in a Plexiglass slurry bubble column of 2.61-meter total height and 0.292-meter inner diameter. The gas distributor is a perforated plate which has 94 holes of 1 mm orifice diameter with 1400 holes/m2 density.
To measure the dissolved oxygen concentration in the liquid phase, an optical dissolved oxygen (DO) probe (Visiferm DO325, Hamilton Inc.) is used. The DO probe is located 0.55 m above the distributor. The probe’s range of measurement for dissolved oxygen is 4 ppb to 25 ppm. The probe has 0.012-meter diameter and 0.325-meter length. For all 2-phase experiments, the DO concentration is determined at seven radial positions, while in the case of 3-phase experiments only the DO concentration at the center of the column is measured. This optical probe is worked on the basis of oxygen dependent luminescence quenching.
To record dynamic dissolved oxygen concentration and temperature of media, one data acquisition card (National Instrument, PCI6023E) and LabVIEW software are used. All data are recorded for 180 s and 512 Hz frequency. Each experiment is done for three times for 3-phase and five times for 2-phase to ensure repeatability and the mean average of obtained data in these tests are presented as the final results.
Table 3.2- Operating conditions and geometrical specifications of the BC with distributor
Column dimension
𝐷𝐶 0.292 (𝑚) 𝐻𝐶 2.61 (𝑚) 𝐻0 1.10 (𝑚) 𝐺𝑎𝑠 𝑑𝑖𝑠𝑡𝑟𝑖𝑏𝑢𝑡𝑜𝑟 𝑃𝑒𝑟𝑓𝑜𝑟𝑎𝑡𝑒𝑑 𝑝𝑙𝑎𝑡𝑒 𝑑0 = 1 (𝑚𝑚) (94 ℎ𝑜𝑙𝑒𝑠)Operating conditions
𝑃 1 (𝑎𝑡𝑚) 𝑇 15 − 22 (°𝐶) 𝑈𝐺 0.004– 0.25 (𝑚/𝑠)(a)
(b)
Figure 3.1- (a) Schematic of experimental set-up (b) Photograph of optical dissolved oxygen probe (Visiferm DO325, Hamilton Inc.)
3.3 Measurement of volumetric mass transfer coefficient
In order to determine the volumetric liquid-gas mass transfer (𝑘𝐿𝑎), the dynamic oxygen absorption
technique has been utilized. Among the different methods available for this technique, the saturation method has been applied in this study. Regarding the details of the saturation method, in the first step, nitrogen is introduced into the column in order to bring the concentration of dissolved oxygen to nil. In the next step, the nitrogen flow is stopped, allowing all N2 bubbles to leave the
liquid phase. Subsequently, pressurized air is sparged into the column and the concentration of dissolved oxygen is continuously measured via the optical probe.
Assuming that the liquid is perfectly mixed and the oxygen depletion from the gas bubble is insignificant, by considering a simple mass balance for dissolved oxygen as follows the concentration of DO at each moment can be calculated.
𝑑𝐶
𝑑𝑡
= 𝑘
𝐿𝑎(𝐶
∗
− 𝐶)
(3-1)In this equation 𝐶∗ is the oxygen solubility (i.e. oxygen saturation concentration at the liquid-gas
interface) at employed temperature and pressure, and 𝐶 is the oxygen concentration in the liquid phase.
Considering that the concentration of DO at t0 (the starting point of the experiment) is equal to
zero, the integration of the above equation results in [112] :
𝐶(𝑡) = 𝐶
∗[1 − 𝑒𝑥𝑝(−𝑘
𝐿𝑎(𝑡 − 𝑡
0))]
(3-2) The only unknown constant in this equation is the volumetric mass transfer, which can be found by a regression of Equation 3-2 to the actual concentration of 𝐶(𝑡) read by the probe [14] .RESULTS AND DISCUSSION
4.1 Effect of superficial gas velocity
As highlighted throughout the literature review section, superficial gas velocity is an important parameter in SBCRs since it not only controls the flow regime, but also affects the gas holdup, gas bubbles characteristics, and mass and heat transfer. Figure 4.1 illustrates the variations in the dissolved oxygen concentration versus time for the air-water system at three different superficial gas velocities (𝑈𝐺 =0.56, 5.28 and 18.55 cm/s).
For all gas velocities, the DO concentration-time profile can be divided into three distinct regions, which are elaborated below. At the beginning (time span of 0 to 10 s), the dissolved oxygen concentration is nearly constant. In the second stage, dissolved oxygen concentration increases with time very sharply in less than 15 s. This is followed by a less noticeable increment in DO with time between 25 and 65 s. Finally, DO reaches a plateau, where DO concentration is independent of the time of the experiments. Interestingly, it was noticed that the temperature drops as the superficial gas velocity is raised, which can be attributed to the following facts. Considering the fact that the temperature of the compressed air is lower than that of the liquid phase (i.e. tap water), as the air flowrate is increased, the temperature of the air-water system goes down. Additionally, at higher air velocities, more water evaporation rates can be envisaged, leading to the temperature drop.
Nevertheless, it needs to be emphasized that in each test (at each superficial gas velocity), the DO concentrations are recorded in a constant temperature.
As the superficial gas velocity is raised, more severe mixing in the system can be expected, which results in better contact between the liquid and gas phases. Based on the surface renewal theory, the superior contact between the two phases enhances the mass transport rate. Therefore, at higher gas velocities, the dissolved oxygen reaches its saturation concentration (i.e. equilibrium state) sooner. This can be easily deduced from: i) the steeper slope for 𝑈𝐺=18.55 cm/s with respect to that at 0.56 cm/s (or 5.28 cm/s) in Figure 4.1, and ii) the significant difference in the required time to reach the saturation concentration (60, 80, and 130 s for 18.55, 5.28, and 0.56 cm/s, respectively).
![Figure 2.1- Sketch of different types of bubble column reactors. Adapted from reference [24]](https://thumb-eu.123doks.com/thumbv2/123doknet/2329957.31454/20.918.151.769.130.1032/figure-sketch-different-bubble-column-reactors-adapted-reference.webp)
![Figure 2.2- Variables and phenomena affecting the performance of bubble columns. Adapted from reference [25]](https://thumb-eu.123doks.com/thumbv2/123doknet/2329957.31454/21.918.101.795.598.912/figure-variables-phenomena-affecting-performance-columns-adapted-reference.webp)
![Figure 2.3- Schematic of the flow regimes in bubble column reactors. Adapted from [24] The homogeneous flow regime (perfect or bad bubbly flow) is usually seen at low superficial gas velocities, (3-8 cm/s in semi-batch bubble columns) [29]](https://thumb-eu.123doks.com/thumbv2/123doknet/2329957.31454/22.918.143.790.469.822/schematic-reactors-adapted-homogeneous-perfect-usually-superficial-velocities.webp)
![Table 2.1- Experimental study of the transition regime in the bubble columns (Air-Water) [7, 36] Researcher(s) Transition velocity (m/s) Transition gas holdup (%)](https://thumb-eu.123doks.com/thumbv2/123doknet/2329957.31454/25.918.135.783.147.479/experimental-transition-columns-researcher-transition-velocity-transition-holdup.webp)
![Figure 2.6- Gas holdup variation with superficial gas velocity. Adapted from reference [44]](https://thumb-eu.123doks.com/thumbv2/123doknet/2329957.31454/28.918.174.749.176.588/figure-gas-holdup-variation-superficial-velocity-adapted-reference.webp)