HAL Id: hal-02063103
https://hal-amu.archives-ouvertes.fr/hal-02063103
Submitted on 10 Mar 2019
HAL is a multi-disciplinary open access archive for the deposit and dissemination of sci-entific research documents, whether they are pub-lished or not. The documents may come from teaching and research institutions in France or abroad, or from public or private research centers.
L’archive ouverte pluridisciplinaire HAL, est destinée au dépôt et à la diffusion de documents scientifiques de niveau recherche, publiés ou non, émanant des établissements d’enseignement et de recherche français ou étrangers, des laboratoires publics ou privés.
during in vitro degradation of large marine particles
R. Arraes-Mescoff, M. Roy-Barman, L. Coppola, M. Souhaut, K. Tachikawa,
C. Jeandel, Richard Sempere, C Yoro, M Roy
To cite this version:
R. Arraes-Mescoff, M. Roy-Barman, L. Coppola, M. Souhaut, K. Tachikawa, et al.. The behavior of Al, Mn, Ba, Sr, REE and Th isotopes during in vitro degradation of large marine particles. Marine Chemistry, Elsevier, 2001, 73, pp.1 - 19. �hal-02063103�
rlocatermarchem
The behavior of Al, Mn, Ba, Sr, REE and Th isotopes during in
vitro degradation of large marine particles
R. Arraes-Mescoff
a, M. Roy-Barman
a,), L. Coppola
a, M. Souhaut
a,
K. Tachikawa
a,1, C. Jeandel
a, R. Sempere
´ ´
b, C. Yoro
ba
LEGOSrUMR 5566, 14 AÕenue Edouard Belin, 31400 Toulouse, France
bLMM, CNRS
rINSU, Campus de Luminy, F13288 Marseille Cedex 9, France Received 29 September 1999; received in revised form 1 May 2000; accepted 17 July 2000
Abstract
The extent and the time constant of dissolution of a set of inorganic tracers during the decomposition of large marine particles are estimated through in vitro experiments. Large marine particles were collected with in situ pumps at 30 m and 200 m in the Ligurian Sea at the end of summer. They were subsequently incubated under laboratory conditions with their own bacterial assemblage for 20 days in batches under oxic conditions in the dark. Some samples were initially sterilized in
Ž . Ž .
order to observe possible differences between biotic and abiotic samples. Particulate ) 0.2 mm and dissolved - 0.2 mm Ž .
concentrations of Al, Sr, Ba, Mn, Rare Earth Elements REE and Th isotopes were determined over time. We obtain percentages of dissolution in agreement with the general knowledge about the solubility of these tracers: ThfAl-Heavy REE- Light REE- Mn- Ba - Sr. For Mn and Ce, precipitationradsorption occurs at the end of the experiment probably due to their oxidation as insoluble oxides. Particulate residence time of the tracers ranged from less than 1 day to 10–14 days. During the experiment, biological activity has a control on the dissolution process through the remineralization of particulate organic carbon. In the 30 m experiment, the observed dissolution of aragonite indicates that the pH of the incubation solution significantly decreases in response to the CO respiration. Speciation calculations suggest that this pH2
shift leads to a decrease of the complexation of dissolved REE by carbonate ions. Th isotope data are consistent with an irreversible dissolution of Th and they do not support a rapid particle–solution chemical equilibrium. q 2001 Elsevier Science B.V. All rights reserved.
Keywords: Marine particles; Dissolution; Trace elements; Thorium isotopes; Western Mediterranean Sea
)Corresponding author. Tel.: 561332988; fax:
q33-561253205.
Ž .
E-mail address: matthieu.barman@cnes.fr M. Roy-Barman .
1
Present address: CEREGE, Europole de l’Arbois, BP 80, 13545 Aix en Provence, France.
1. Introduction
Ž .
Large ) 50 mm marine particles play a key role in the biogeochemical cycle of the elements in the ocean. These particles have mainly a biological
ori-Ž .
gin organic flocculate, fecal pellets and they repre-sent the main transport pathway between the surface water and the sediment. When they sink toward the
0304-4203r01r$ - see front matter q 2001 Elsevier Science B.V. All rights reserved. Ž .
sediment, they interact with seawater and small suspended particles through physical, chemical and biological processes such as aggregation–disaggrega-tion, dissolution–precipitaaggregation–disaggrega-tion, biodegradaaggregation–disaggrega-tion,
ad-Ž .
sorption–desorption Lal, 1977 . These processes modify the chemical composition of the particles and
Ž
therefore the fluxes of settling matter Schaffer, .
1996 . Various types of models have been developed Ž
to quantify these processes McCave, 1975; Bacon and Anderson, 1982; Murnane et al., 1994;
Ruiz-.
Pino, 1994 . They can be calibrated with thorium
Ž .
data Bacon and Anderson, 1982 or laboratory
ex-Ž .
periments Balistrieri et al., 1981 . However, they are still poorly constrained due to the large number of processes involved and the lack of data for many of them.
This work is a part of the Etude Integree des
´ ´
Ž .
Metaux En Trace dans l’Ocean EIMETO project to
´
´
study the interactions between the various phases in Ž
the oceanic water column seawater, colloids, small .
and large particles . Our aim is to use in vitro experiments to constrain the dissolution of large marine particles in response to bacterial activity. These experiments were accomplished by a colla-boration between marine geochemists and marine biologists to study the possible coupling between biological activity and the behavior of organic and inorganic tracers. In this paper, we present the results obtained for the inorganic tracers. Results obtained for organic tracers and bacterial production are
pre-Ž .
sented elsewhere Yoro, 1998 .
To estimate the extent and the time constant of dissolution of a set of inorganic tracers, we have collected marine particles at 30 m and 200 m in the Ligurian Sea. Aliquots of these particles were incu-bated for different times at constant temperature and then the incubation solutions and the residual parti-cles were analyzed. We have selected a set of tracers that are useful to understand the transport of matter
Ž .
in the ocean. Aluminum Al is a tracer of the Ž lithogenic fraction in the particulate matter Davies
. and Buat-Menard, 1990; Guerzoni et al., 1997 .
´
Ž .
Strontium Sr is a tracer of biogenic particulate phases. It is found in carbonates and in acantharian Žplanktonic protozoan tests that are made of ce-.
Ž . Ž .
lestite SrSO , Bernstein et al., 1992 . Barium Ba4 Ž
is a tracer of exported production Dehairs and .
Goeyens, 1987a; Francois et al., 1995 . The
behav-iors of Sr and Ba have similarities, but celestite is
Ž .
much more soluble than barite BaSO . Manganese4 ŽMn is sensitive to redox conditions Sunda et al.,. Ž
.
1983; Moffett, 1997 . Formation of Mn oxyhydrox-ides induces the scavenging of other trace metals ŽBalistrieri et al., 1981; Tachikawa et al., 1999b and.
Ž .
is mediated by bacterial activity Moffett, 1994 .
Ž .
Rare Earth Elements REE and the isotopic compo-Ž .
sition of Neodymium Nd are used as tracers of water masses and seawaterrparticle interactions ŽJeandel et al., 1995; Henry et al., 1994; Tachikawa
. Ž .
et al., 1999a . Thorium Th is an insoluble element Ž
with isotopes of distinct origins Roy-Barman et al., .
1996, 2000 . In situ produced Th isotopes are com-monly used to calibrate particle related processes ŽBacon and Anderson, 1982 ..
2. Sampling and analytical procedure 2.1. Sampling
The samples were collected at the end of summer at the ADYnamique des Flux Atmospheriques en
´
Ž .
MEDiterraneeB DYFAMED site, 5 nautical miles
´
Ž9 km off Nice in the Ligurian Sea Fig. 1 . The site. Ž . is located in a coastal environment and it receives strong eolian inputs. Large particles were collected
Ž 3 3
by filtration of seawater 17 m at 30 m and 23 m at
. Ž
200 m on Teflon grids diameter: 142 mm, pore size
. Ž .
60 mm with in situ pumps Challenger Oceanic . The particulate matter was shared approximately equally between organic and inorganic analyses. We also sampled seawater at 200 m with Niskin bottles. This water was filtered through 0.2 mm filters to remove bacteria and grazers. Counting by
epifluo-Ž
rescence microscopy after DAPI staining Porter and .
Feig, 1980 indicated that 0.2 mm filtration was an efficient protocol to remove living microorganisms such as flagellates and bacteria. This filtered water was used for particle removal and dilution. There-fore, we assume that marine particles have been degraded mainly by their own bacterial assemblage. For the 30 m samples, optical observations indicated the presence of pteropods and Scanning Electron
Ž .
Microscope SEM observations indicated the pres-ence of a majority of diatoms and of some coccol-ithophorids. For the 200 m samples, optical observa-tions indicated the presence of small crustaceans and
Fig. 1. Sampling site location.
SEM observations indicated the presence of diatoms and silicoflagellates.
2.2. Incubation procedure
A detailed description of the protocol is given
Ž .
elsewhere Sempere et al., 2000 . Immediately after
´ ´
sampling, the largest swimmers were removed from the filters. Then filters were maintained wet by adding few cubic centimeters of 0.2 mm filtered seawater and stored for 24 h in the dark at 48C to minimize bacterial activity until the beginning of the incubation experiments in the laboratory. In Mar-seille laboratory, the particles were removed from the filters by rinsing the filters with 0.2 mm filtered seawater. Particles were distributed in 500-cm3
polypropylene bottles using a high precision
peri-Ž .
staltic pump Perfifill IQ 2000, Jencons while the
initial solution was continuously stirred. Each
sub-Ž .
sample is formed by a large number ) 100 of
3 Ž
2 cm doses supplied by a silicone tubing Heussner .
et al., 1990 . Experimental error calculated from the
Ž .
variability ns 6 of GFrF-particulate organic
car-Ž .
bon POC at the initial time in different bottles after particle dispatching were within 4%. The volume of the solution was adjusted to 200–250 cm3 with
0.2-mm filtered seawater. During the separation pro-cedure, the bottles were maintained in ice in order to reduce bacterial activity. Particles from 200 m were
Ž
separated in eight aliquots hereafter referred as C .
series : each aliquot contains particles filtered from approximately 1.4 m3 of seawater. Particles from 30
m were separated in 10 aliquots: each aliquot con-tains particles filtered from approximately 0.79 m3
Ž .
of seawater hereafter referred as D series .
After separation, the bottles were placed in incu-Ž
. samples and 13" 18C for the 200 m samples and in the dark to prevent photosynthesis. The bottles were gently agitated upside down once a day. Available oxygen in the incubation bottles was calculated from
Ž .
the total organic carbon TOC consumption and from the volume of available air in the incubation bottle. It indicates that the experiments were con-ducted under aerobic conditions. The bacterial growth was measured as bacterial production using leucine
Ž .
incorporation technique Kirchman et al., 1993 . The total bacterial production in the incubation solutions was much larger than in seawater due to the strong particle enrichment. Each bacterium has the activity Žorganic matter consumption, reproduction of a typi-. cal marine bacterium whose development is not
lim-Ž
ited by food at least at the beginning of the incuba-.
tion . Some samples were initially sterilized in order to observe possible differences between biotic and
Ž
abiotic samples C7 was poisoned with sodium azide; D5 and D9 were sterilized by 60Co-gamma
irradia-.
tion of 16 kGy for 2 h . In these bottles, bacterial growth was negligible. Incubations lasted up to 21 days and were stopped by separating the incubation solution from the residual particles. This was done by filtration on 0.2 mm Durapore filters. The incuba-tion time A t B represents the time between the end of the particle sub-sampling with the particle separator and the end of the incubation. The maximum incuba-tion time roughly corresponds to the large particle transit time in the water column of the Western basin of the Mediterranean Sea: large particles have a sinking speed of 100 mrday for a depth of 2000 m
Ž
yielding to a transit time of 20 days Fowler et al., .
1987; Henry et al., 1994 .
2.3. Chemical analysis 2.3.1. Incubation solutions
Ž 3.
For Al, Ba, Mn and Sr, a small aliquot 1.4 cm of the incubation solution was diluted in 20 cm3 of
2% HNO and an Indium–Rhenium internal stan-3 dard was added to the diluted solution. The diluted
Ž
solution was analyzed by ICP-MS ELAN 5000, .
Perkin Elmer, see Valladon et al., 1995 .
The remaining solution was used for Th and REE analysis. 229Th, 150Nd and 174Yb spikes and Fe carrier were added to the solution. After a week of
isotopic equilibration, the pH was raised to 8–9
Ž .
using NH to produce Fe OH . The precipitate was3 3 recovered by centrifugation, dissolved in HNO and3 processed through anionic ion exchange column ŽAG1X8 to separate Th from Fe. qREE. Th was
Ž
further purified Chen et al., 1987; Roy-Barman et .
al., 1996 and run by Thermal Ionization Mass Spec-Ž
trometry Finnigan Mat 261 equipped with a Spec-.
tromat post-counting system . The FeqREE frac-tion was dried and then dissolved in 0.5 cm3 of 6 N HCl. This solution was passed through an anionic
Ž 3 .
ion exchange column 0.5 cm of AG1X8 that fixed Fe and let the REE pass through. REE were eluted completely with 2.5 cm3 of 6 N HCl. The yield of the REE chemistry was ) 80%. Purified REE were diluted in 10 cm3 of 2% HNO , Indium–Rhenium
3
internal standard was added to the solution and the Ž
sample was analyzed by ICP-MS ELAN 6000, .
Perkin Elmer .
2.3.2. Particles
The 0.2 mm filters were placed in a hot 5% HCl solution for a day to detach the particles. The parti-cles were washed out from the filter with distilled water. Then, the particles were dissolved in 1 cm3 of
aqua regia. The solution was dried and the residue was dissolved again in 0.3 cm3 of 16 N HNO . The3
sample was centrifuged to separate the solution from the residual solids. Residual solids were dissolved in HF–HNO –HClO , dried and dissolved in 16 N3 4
HNO . When complete dissolution of these solids3
Ž .
was achieved no residual solid after centrifugation , the supernatant solution and the sink solution were mixed back together. This procedure allowed to use HF for the residual solid dissolution without produc-ing CaF precipitates with the Ca released durproduc-ing the2
5% HCl and aqua regia dissolution steps. The final solution was separated in two splits. One aliquot was dried, diluted in 20 cm3 of 2% HNO , Indium–
3
Rhenium internal standard was added and the sample was analyzed for Al, Ba, Mn, Sr and REE by
Ž .
ICP-MS ELAN 6000, Perkin Elmer . The second aliquot was dried, 229Th spike was added and the sample was processed through anionic ion exchange
Ž
resin to separate Th from the matrix Chen et al., .
1987; Roy-Barman et al., 1996 . Purified Th was run by Thermal Ionization Mass Spectrometry.
2.4. Blanks
In order to estimate the reagent contribution and the possible contamination during the incubation,
Ž .
0.2 mm filtered seawater 200 m was incubated with no prior addition of particles. This water was filtered after incubation and both filtered solutions Žlater referred as Aseawater blanksB. and filters Žlater referred as Aparticle blanksB were analyzed.. For particles, the blank contribution is F1% for Al at 30 m and F23% for Al at 200 m, F4% for Ba, below detection limit for Mn, below detection limit
Ž . Ž .
for REE except for La F30% and Ce F40% at 200 m, F7% for Th at 30 m and F44% for Th at 200 m. For Sr it ranges from 5% to 40%. The particulate concentrations presented in this study are blank-corrected. Concentrations in seawater blanks were similar to Mediterranean seawater for all ele-ments indicating no significant contamination except
Ž .
Al and Th see discussion below .
2.5. Accuracy
Accuracy of the ICP-MS analysis was checked by Ž
running the SLRS standard Institute for Environ-.
mental Chemistry, Ottawa and a standard solution ŽICP-MS grade . Agreement between ICP-MS mea-. surements and recommended values of Al, Ba, Sr, Mn, REE and Th is typically better than 7%. Accu-racy for Th measurement by TIMS was checked by running Th standards. Agreement between measure-ments and the recommended 230Thr232Th value ŽBanner et al., 1990 is typically better than 2%.. 3. Results
Unless stated otherwise, the concentrations of ele-ments in the filtered incubation solutions and in the residual particles are expressed in 10y 9 g of element
Ž .
per gram of incubation solution ngrg . Results are given in Tables 1–3.
For both series, concentrations in the initial
incu-Ž .
bation solutions D0–D1 and C0 are systematically higher than in the seawater blanks indicating that dissolution had started before the beginning of the incubation during the 24 h between the particle pumping and the separation of the different aliquots.
Therefore, in the following, we will consider the evolution of concentrations since the time ts y 24 h Žthat is when the particles have been collected . This. allows us to maintain a timescale which is consistent
Ž .
with the organic tracer study Yoro, 1998 .
At 30 m, concentrations in incubation solutions Ž23–28 ngrg for Ba, 3.6–7.1 ngrg for Mn, 8734–
.
9236 ngrg for Sr are systematically higher than in
Ž .
seawater blanks except for Al 4.7–23 ngrg . At 30 m, concentrations on the residual particles are: 552– 1382 ngrg for Al, 10–21 ngrg for Ba, 4.5–10 ngrg for Mn, 9–80 ngrg for Sr. At 200 m, concentrations
Ž
in incubation solutions 16–26 ngrg for Ba, 2.5–4.3 .
ngrg for Mn, 8000–8300 ngrg for Sr are signifi-cantly higher than in seawater blanks except for Al Ž8.6–16.4 ngrg and Sr 8000–8300 ngrg . At 200. Ž . m, concentrations on the residual particles are: 23– 113 ngrg for Al, 2.5–4.3 ngrg for Ba, 0.6–3.5 ngrg for Mn, 5–15 ngrg for Sr.
Ž . Ž .
Ba 11.2–12.5 ngrg and Sr 8225–8277 ngrg concentrations in seawater blanks are similar to those
Ž .
of Mediterranean seawater Bernat et al., 1972 . REE concentrations in seawater blanks are in good
agree-Ž
ment with Mediterranean seawater Greaves et al.,
. Ž
1991; Henry et al., 1994 . Mn concentrations 1.9– .
2.1 ngrg in seawater blanks are higher than values Ž
reported for Mediterranean seawater 0.03–0.11 .
ngrg, Morley et al., 1997 . However, our samples were collected only 9 km from the shore whereas Morley’s samples were collected at offshore sites. Strong concentration gradients are commonly
ob-Ž served between coastal area and open waters
Land-. 232 Ž
ing and Bruland, 1987 . Th concentrations 0.27– .
0.33 pgrg of seawater blanks are higher than the concentrations measured on the same seawater that
Ž has not followed the incubation procedure 0.206
.
pgrg . This suggests that a slight contamination has occurred during sampling or preparation. However, since concentrations in incubation solutions are sys-tematically higher than in seawater blanks, we con-sider that contamination cannot account for the high Th concentrations in the incubation solutions. Data given in Table 3 are corrected for the chemical separation blank but not for this additional effect. Al
Ž .
concentrations 11.1–11.3 ngrg in seawater blanks are 4–10 times higher than in Mediterranean
seawa-Ž .
ter Chou and Wollast, 1997 and incubation solu-tions are not systematically more concentrated than
Table 1 Ž . Ž . Al, Mn, Ba, Sr ng r g and REE concentrations pg r g in dissolved fractions Ž . Sample Time h Al Mn Ba Sr La Ce Pr Nd Sm Eu Gd Tb Dy Ho Er Tm Yb Lu Ce anomaly 30 m D0 0 11.6 3.6 23.3 8734 n.d. n.d. n.d. n.d. n.d. n.d. n.d. n.d. n.d. n.d. n.d. n.d. n.d. n.d. n.d. D1 0 23.1 3.7 25.9 8917 5.10 6.99 0.97 4.51 1.22 n.d. 1.09 0.17 1.32 0.32 1.09 0.14 0.93 0.1 0.77 D2 6 10.0 4.4 27.5 8917 6.03 8.61 1.12 4.80 1.11 n.d. 1.10 0.17 1. 23 0.30 1.02 0.12 0.85 0.1 0.81 D3 25 10.3 5.8 23.6 8960 6.55 8.91 1.31 6.27 1.51 n.d. 1.47 0.22 1.45 0.34 1.10 0.13 0.89 0.1 0.75 D4 51 7.8 5.2 23.6 8895 7.76 12.2 1.86 7.96 1.62 n.d. 1.70 0.25 1.64 0.38 1.18 0.14 0.93 0.1 0.80 a D5.c 70 10.2 5.7 28.3 9119 5.87 6.92 1.11 6.98 1.32 n.d. 1.30 0.20 1.40 0.30 1.05 0.12 0.76 0.1 0.66 D6 238 4.7 7.1 24.5 9122 16.8 20.2 2.69 11.7 2.61 n.d. 2.59 0.37 2.35 0.47 1.46 0.16 1.04 0.1 0.73 D7 504 9.4 4.6 23.6 9236 n.d. n.d. n.d. n.d. n.d. n.d. n.d. n.d. n.d. n.d. n.d. n.d. n.d. n.d. n.d. D8 504 21.0 4.8 26.2 9133 19.1 13.6 3.16 13.6 2.9 n.d. 2.90 0.40 2.54 0.53 1.57 0.17 1.05 0.1 0.43 a D9.c 504 12.0 6.6 25.6 9060 4.50 5.41 0.84 4.15 1.1 n.d. 1.23 0.17 1.12 0.27 0.93 0.11 0.73 0.1 0.68 200 m C0 0 16.4 2.5 16.0 8078 7.93 13.1 1.51 6.78 1.66 n.d. 1.45 0.24 1.68 0.46 1.45 0.23 1.28 0.3 0.93 C1 25 10.2 2.6 15.8 8165 7.75 12.0 1.29 6.30 1.45 n.d. 1.35 0.21 1.57 0.42 1.33 0.23 1.23 0.2 0.92 C2 27 10.4 2.7 17.4 8142 9.36 15.3 1.57 6.67 1.47 n.d. 1.24 0.20 1.61 0.41 1.38 0.19 1.20 0.2 0.97 C3 49 15.0 2.9 18.5 8166 5. 97 11.1 1.15 5.33 1.29 n.d. 1.24 0.20 1.49 0.39 1.31 0.18 1.18 0.2 1.04 C4 241 10.4 3.4 25.8 8320 5.66 12.7 1.20 5.27 1.13 n.d. 1.11 0.16 1.35 0.29 1.14 0.03 0.91 n.d. 1.20 C5 481 8.6 3.5 18.9 8083 6.48 11.8 1.21 6.74 1.24 n.d. 1.25 0.17 1.44 0.30 1.13 0.03 0.94 n.d. 1.03 C6 481 13.1 3.5 22.2 8330 6.59 11.5 1.26 5.75 1.33 n.d. 1.26 0.18 1.52 0.32 1.21 0.04 1.02 n.d. 0.98 b C7.c 481 15.7 4.3 21.7 8330 11.8 27.6 2.87 12.4 3.09 n.d. 2.57 0.40 2.65 0.56 1.88 0.11 1.49 n.d. 1.17 Seawater Blanks BL1 11.3 2.1 12.5 8225 3.81 4.28 0.82 3.94 1.57 n.d. 1.02 0. 17 1.34 0.35 1.21 0.20 1.14 0.2 0.60 BL2 11.1 1.9 11.2 8277 4.18 4.02 0.81 3.91 1.48 n.d. 1.05 0.16 1.29 0.34 1.21 0.16 1.09 0.2 0.54 n.d. s Not determined. a Irradiated sample. b Poisoned with sodium azide.
Table 2 Ž . Al, Mn, Sr, Ba and REE concentrations of the particulate fraction in the incubation bottles ng r g Ž . Ž . Sample Time h Al Mn Ba Sr La Ce Pr Nd Sm Eu Gd Tb Dy Ho Er Tm Yb Lu Ce La r Yb n anomaly 30 m D0 0 723 7.3 15.3 80.7 0.28 0.58 0.07 0.25 0.05 b.d 0.042 0.006 0.035 0.006 0.019 0.003 0.014 0.002 1.04 1.71 D1 0 971 10.2 19.6 123 0.36 0.75 0.09 0.34 0.06 b.d 0.054 0.009 0.051 0.010 0.028 0.005 0.028 0.004 1.04 1.13 D2 6 1254 9.6 16.8 41.1 0.35 0.87 0.08 0.32 0.06 0.01 0.050 0.007 0.042 0.008 0.023 0.003 0.019 0.003 1.30 1.58 D3 25 979 7.8 16.7 21.1 0.40 0.70 0.09 0.33 0.07 0. 01 0.054 0.009 0.044 0.009 0.025 0.004 0.023 0.003 0.91 1.48 D4 51 845 7.9 15.1 13.5 0.36 0.61 0.08 0.30 0.05 0.01 0.046 0.008 0.044 0.008 0.022 0.004 0.020 0.003 0.88 1.55 a D5.c 70 1382 11.7 20.8 14.1 0.46 0.51 0.11 0.40 0.08 0.02 0.071 0.011 0.058 0.014 0.031 0.005 0.029 0.004 0.55 1.36 D6 238 724 4.5 12.6 9.9 0.26 0.49 0.06 0.21 b.d. b.d 0.041 0.006 0.036 0.006 0.020 0.003 0.017 0.003 0.94 1.28 D7 502 815 7.3 14.4 9.0 0.28 0.68 0.06 0.22 0.04 b.d 0.036 0.006 0.041 0.010 0.021 0.004 0.018 0.004 1.25 1.30 D8 504 522 5.3 9.9 18.4 0.20 0.64 0.05 0.17 0.04 b.d 0.029 0.005 0.027 0.005 0.014 0.002 0.012 0.002 1.63 1.45 a D9. c 504 881 6.8 14.9 10.2 0.31 0.69 0.07 0.24 0.05 0.01 0.049 0.007 0.043 0.007 0.024 0.003 0.020 0.003 1.15 1.32 200 m C0 0 113 2.76 12.4 15.4 0.15 0.38 0.01 0.06 b.d b.d b.d b.d b.d b.d b.d b.d b.d b.d 1.82 n.d. C1 25 105 2.33 9.2 9.21 0.07 0.58 0.01 0.05 b.d b.d b.d b.d b.d b.d b.d b.d b.d b.d 5.03 n.d. C2 27 132 3.52 13.7 13.2 0.08 0.44 0.01 0.06 b.d b.d b.d b.d b.d b.d b.d b.d b.d b.d 3.42 n.d. C3 49 65.5 1.78 7.1 7.27 0.05 0.11 0.01 b.d. b.d b.d b.d b.d b.d b.d b.d b.d b.d b.d 1.17 n.d. C4 241 59.5 0.99 5.0 6.69 0.04 0.14 0. 01 0.02 b.d b.d b.d b.d b.d b.d b.d b.d b.d b.d 1.80 n.d. C5 481 49.2 0.73 4.6 5.17 0.04 0.13 0.004 0.02 b.d b.d b.d b.d b.d b.d b.d b.d b.d b.d 2.34 n.d. C6 481 44.1 0.77 3.6 4.10 b.d. b.d. 0.003 0.01 b.d b.d b.d b.d b.d b.d b.d b.d b.d b.d n.d. n.d. b C7.c 481 22.7 0.56 2.6 7.05 0.02 0.16 b.d. b.d. b.d b.d b.d b.d b.d b.d b.d b.d b.d b.d n.d. n.d. Blank 6.6 b.d. 0.1 2.46 0.01 0.15 b.d. b.d. b.d. b.d. b.d. b.d. b.d. b.d. b. d. b.d. b.d. b.d. n.d. s Not determined, b.d. s below detection. a Irradiated sample. b Poisoned with sodium azide.
Table 3 Concentrations and isotopic ratios of Thorium isotopes Ž . Sample Time h Particules Solutions 23 2 2 3 0 2 3 0 2 3 2 2 3 2 2 3 0 2 3 0 2 3 2 Ž . Th Th Th r Th Th pg r g Th Th r Th y 6 y 6 y 6 y 6 Ž . Ž . Ž . Ž . Ž . pg r g 10 pg r g 10 mol r mol 10 pg r g 10 mol r mol 30 m D0 0 0.53 " 0.03 3.1 " 3.0 5.80 " 5.6 D1 0 121 " 1 550 " 26 4.58 " 0.22 1.78 " 0.05 13.1 " 3 7.4 " 1.6 D2 12 131 " 1 576 " 110 4.45 " 0.85 n.d. n.d. n.d. D3 24 108 " 1 517 " 41 4.82 " 0.39 0.83 " 0.04 4. 7" 3.8 5.6 " 4.6 D4 48 124 " 2 575 " 40 4.69 " 0.34 0.43 " 0.04 10.8 " 7.7 25 " 18 a D5 68.2 89 " 5 385 " 240 4.39 " 2.7 0.59 " 0.03 3.8 " 1.4 6.5 " 2.5 D6 240 91 " 1 412 " 21 4.59 " 0.24 0.86 " 0.04 1.5 " 5.1 1.8 " 6 D7 504 95 " 1 400 " 24 4.26 " 0.27 0.26 " 0.03 2. 7" 1.6 10 " 6 D8 504 60 " 1 250 " 28 4.22 " 0.48 1.27 " 0.04 7.1 " 2.1 5.6 " 1.7 a D9 504 114 " 1 537 " 21 4.74 " 0.19 0.89 " 0.04 9.3 " 2.7 11 " 3 200 m C0 0 14.8 " 0.3 108 " 32 7.30 " 2.2 0.73 " 0.04 6. 8" 1.1 9.3 " 1.6 C1 25 14.2 " 0.2 62 " 15 4.40 " 1.0 0.48 " 0.04 4.3 " 4.0 9.0 " 8.4 C2 25 n.d. n.d. n.d. 0.48 " 0.03 7.1 " 1.9 15 " 4 C3 49 8.9 " 0.3 n.d. n.d. 0.42 " 0.03 3.6 " 1.0 8.6 " 2.6 C4 241 9.5 " 0.3 50 " 17 5.30 " 1.8 0.83 " 0.04 8.6 " 1.5 10 " 1.9 C5 481 4.08 " 0.08 26 " 8 6.40 " 1.9 0.45 " 0.03 4.1 " 0.9 9.2 " 2.0 C6 481 4.7 " 0.3 27 " 19 5.90 " 4.0 0.99 " 0.05 8.8 " 1.1 9.0 " 1.3 b C7 481 1.87 " 0.06 14 " 9 7.70 " 5.1 2.74 " 0.1 22.4 " 1.8 8.3 " 0.7 Seawater Blanks BL1 y 24 0.27 " 0.03 3.19 " 0.7 12 " 3 BL2 y 24 0.33 " 0.02 3.4 " 3.1 10 " 9 Ž . 200 m filtered water analysis of 3 l 0.206 " 0.008 3.38 " 0. 4 13.6 " 1.8 n.d. s Not determined. a Irradiated sample. b Poisoned with sodium azide.
seawater blanks. Therefore, we suspect a strong con-Ž tamination of the solutions with respect to Al micro-biologists wrapped their material and samples in Al
. foil to protect them from carbon contamination .
To compare our particulate matter concentrations with the literature, we express the quantity of
ele-Ž .
ment per mass of seawater ngrg SW . Particulate Ž
Al concentrations in this work 0.16–0.42 ngrg SW . at 30 m and 0.004–0.02 ngrg SW at 200 m are of the same order of magnitude or slightly lower than
Ž .
previous measurements 0.05–0.6 ngrg SW at the
Ž .
DYFAMED site Sarthou and Jeandel, 2000 . Partic-Ž
ulate Ba concentrations 0.003–0.006 ngrg SW at . 30 m and 0.0009–0.002 ngrg SW at 200 m are lower than those determined in the Mediterranean
Ž
Sea 0.169 ngrg SW at 50 m and 0.04–0.06 ngrg
. Ž .
SW at 100–300 m by Dehairs et al., 1987b . In all cases, comparison is made with particles collected on
Ž .
filters with a much smaller pore size f1mm
com-Ž .
pared to our work 60 mm , so that it is not surpris-Ž ing that we obtain different concentrations there is no previously published data for these elements on
.
large particles . The Nd concentrations in filtered
Ž .
large particles ) 50 mm reported for the Sargasso Ž
Sea 0.03 pgrg SW at 40 m and 0.01 pgrg SW at .
200 m, Jeandel et al., 1995 are in agreement with Ž
our values 0.035 pgrg SW at 30 m and 0.015 pgrg .
SW at 200 m .
4. Discussion
4.1. Particulate matter characteristics
The particulate matter is more abundant at 30 m than at 200 m. This is consistent with most biologi-cal activity occurring in the surface waters and eo-lian inputs. The elements in the particulate matter are enriched to various extents compared to crustal ma-terial. This is due to the addition of an authigenic fraction such as organic matter, biominerals, Mn oxyhydroxides precipitates or trace metal adsorption to the lithogenic material. Refractory elements such as Al and 232Th are used as tracers of the lithogenic matter because they are expected to be insoluble in seawater and to present no authigenic enrichment. Nevertheless, Th isotopes raise the possibility of a
232 Ž .
small authigenic fraction of Th see Section 4.7 .
Similarly, the suggestion that Al is present in di-atoms raises the possibility of nonlithogenic Al in
Ž .
the particulate matter Hydes et al., 1988 . Still, we consider that at this shallow coastal site, Al and Th should be mainly lithogenic and that using the bulk Al concentration to estimate the authigenic fraction of soluble elements will have a minor influence on the final result. The percentage of authigenic matter contributing to the total particulate matter, Fa, is given by:
Xc Alp
Fas 1y
ž
ž /
ž /
/
= 100Ž .
1Alc Xp
where X and Al are the average concentrations ofc c
Ž the elements X and Al in the continental crust Taylor
.
and McLennan, 1985 , X and Al are the concen-p p trations of the elements X and Al in the particulate
Ž
sample. Fa is larger at 200 m 95–99% for Sr, . 92–94% for Ba, 50–70% for Mn, 20–37% for Nd
Ž
than at 30 m 57–97% for Sr, 49–68% for Ba, .
F30% for Mn, F8% for Nd . Lithogenic material of eolian origin accumulates in the surface waters before being carried through the water column by
Ž .
rapidly sinking particles Ruiz-Pino et al., 1990 . Therefore, its residence time at 200 m is much shorter than in the surface waters. This is why we collected less lithogenic material at 200 m compared to 30 m and why the relative contribution of the AlocalB authigenic matter is larger at 200 m com-pared to 30 m. In addition, aggregation between 30 m and 200 m of small particles enriched in authigenic component will dilute the lithogenic ma-terial. Specific processes may enhance this general trend: e.g. in surface waters, photo-reduction
pre-Ž vents the formation of Mn oxyhydroxides Sunda
.
et al., 1983 . Lateral advection of particulate material at the sampling site is also possible but we cannot quantify it.
It is often assumed that the authigenic fraction is
Ž .
easily soluble labile while the lithogenic fraction is supposed to be refractory. However, recent works suggest that a substantial fraction of the lithogenic
Ž
matter may be dissolved Henry et al., 1994; .
Tachikawa et al., 1999a . We observe significant authigenic fractions on the residual particles for Mn and Ba. This suggests that a fraction of the authi-genic material is not soluble under the conditions and on the timescale of the experiment.
4.2. Dissolution of tracers from the particulate mat-ter
In order to remove the effect of heterogeneous distribution of particles among the different aliquots,
Ž .
we consider the percentage of dissolution DX of an Ž .
element X in the particulate matter rather than the concentration of this element in the incubation solu-tions or in residual particles, respectively. DX is obtained by dividing the increase of concentration in solution by the total amount of element initially present on particles:
Xsy Xsw
DXs
ž
/
Ž .
2Xsy X qXsw p
where X , X and Xs p sw are the concentrations of the element X in the incubation solution, on residual particles and in seawater blanks. Evolution of D asX
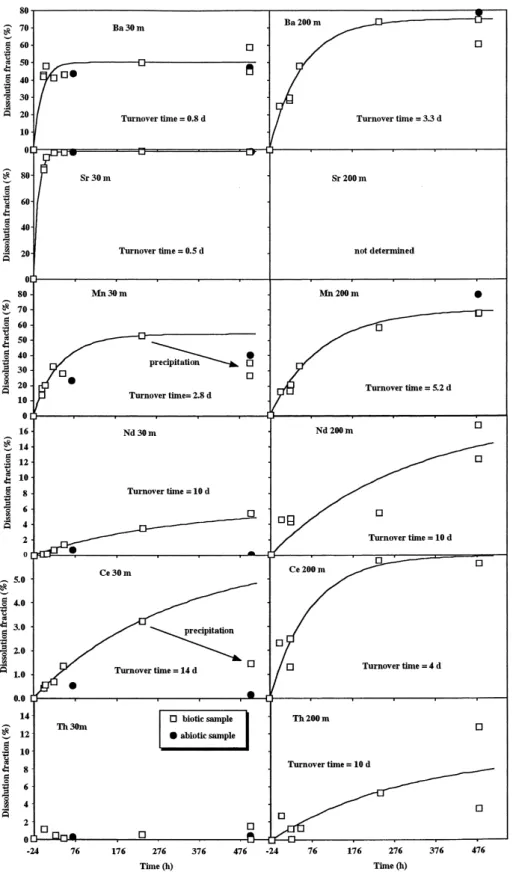
a function of time is shown on Fig. 2. We assume that the dissolution of the labile fraction of the element X on particles follows a first order kinetic law:
dXpy labile
s y k XX py labile
Ž .
3ž
d t/
where Xp-labile represents the concentration of labile particulate element X in the incubation sample. Eq. Ž .3 is used as a proxy in many seawater–particle
Ž
interaction models Bacon and Anderson, 1982;
. Ž .
Ruiz-Pino, 1994 . From Eq. 3 , we derive DX as a function of time: Žtq24. tX max DX
Ž .
t s DXž
1y e/
Ž .
4 and Xinit py labile max DX sž /
XinitŽ .
5 pwhere t is the incubation time as defined previously, tXs 1rk is the residence time of element X onX particles, Dmax is the maximum dissolution fraction
X
of X and the superscript init refers to the time of sample collection. We note that Xinitp s X y X qs sw
X . The curves are fitted by eye by adjusting thep
max Ž .
values of tX and DX Fig. 2, Table 4 . For Mn and Ce at 30 m, we suspect precipitation after 10
Ž .
days of incubation so 1 we do not take D7 and D8 Ž .
into account to adjust the curve and 2 we choose a
max Ž .
value of DX that is lower than D 20 days . ForX Al, Dmax is probably overestimated due to the
con-Al
Ž .
tamination of the solution see Section 3 .
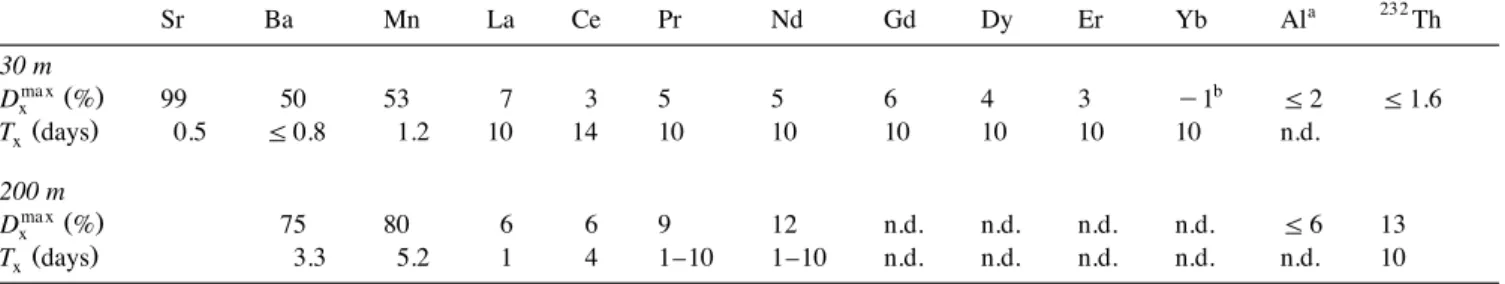
We obtain DmaxX values in agreement with the general knowledge about the behavior of these trac-ers and their relative solubility. At 30 m, Dmax X
Ž . Ž .
increases as follows: Th - 1.6% fAl 2%
-Ž . Ž .
Heavy REE 0–4% - Light REE 5–7% - Mn
Ž53%.- Ba 60% - Sr 100% . At 200 m, the DŽ . Ž . max X
Ž . Ž .
increases as follows: Al - 6% - Th - 13% f
Ž . Ž . Ž .
Light REE 6–12% - Mn 80% fBa 80% . For
all the elements, Dmax values are higher at 200 m X
than at 30 m because the proportion of insoluble lithogenic matter is lower at 200 m than at 30 m. This is in agreement with the higher 230Thr232Th ratio in the particulate matter from 200 m compared
Ž .
to 30 m see Section 4.7 . We obtain values for tX
ranging from less than a day to more than 10 days. For Ba and Mn, the dissolution is faster at 30 m than at 200 m. In the case of Ce, the dissolution seems
Ž
slower at 30 m than at 200 m but the time constants .
are poorly constrained .
4.3. Refractory elements
Ž .
Our study Fig. 2 and Table 4 confirms the Ž
refractory nature of Al, Th and REE Maring and . Duce, 1987; Fisher et al., 1987; Greaves et al., 1994 and it justifies the use of Al and 232Th as tracers of the particulate lithogenic matter. Compared to previ-ous studies, the 30 m results demonstrate that Al, Th and REE, which are mainly lithogenic, remain insol-uble even when strong bacterial activity occurs. At 200 m, the percentage of dissolution increases as a larger authigenic fraction is present on particulate matter.
4.4. Manganese
At 30 m and 200 m, 53% and 80% of the total particulate Mn is dissolved under biotic conditions ŽFig. 2 and Table 4 . The residence time t. Ž Mn.is of the order of 3 days at 30 m and of the order of 5 days at 200 m. For both depths, the concentrations in
Ž .
Fig. 2. Evolution of the percentage of dissolution Dx of Sr, Ba, Mn, Nd, Ce and Th as a function of time. The percentage of dissolution is Ž .
given by Eq. 2 . The curves represent the theoretical evolution of D with time assuming that dissolution follows a first order kinetics lawx Žsee Eq. 4 .Ž ..
Table 4 Dissolution parameters 232 a Sr Ba Mn La Ce Pr Nd Gd Dy Er Yb Al Th 30 m ma xŽ . b Dx % 99 50 53 7 3 5 5 6 4 3 y 1 F2 F1.6 Ž . Tx days 0.5 F0.8 1.2 10 14 10 10 10 10 10 10 n.d. 200 m ma xŽ . Dx % 75 80 6 6 9 12 n.d. n.d. n.d. n.d. F6 13 Ž . Tx days 3.3 5.2 1 4 1–10 1–10 n.d. n.d. n.d. n.d. n.d. 10
aDmax is probably overestimated due to the contamination of the solution with Al foil see Section 3 .Ž . Al
bA negative value corresponds to a net adsorption
rprecipitation.
solution are higher in the sterilized samples than in the nonsterilized samples after 20 days of incubation ŽTable 1 and Fig. 2 . At 30 m, we observe a decrease. of DMn between 10 and 20 days whereas at 200 m dissolution continues over the same period. Under oxic conditions, the behavior of Mn is controlled by
Ž . 2q
the balance between 1 oxidation of dissolved Mn
4q Ž .
to Mn as insoluble Mn oxides Moffett, 1997 and Ž .2 reduction of Mn oxides to Mn2q by dissolved
Ž .
organic compounds Sunda et al., 1983 . The spe-cific rate of Mn2q bacterial oxidation in seawater
Ž .
kox is of the order of 1–2% per day Moffett, 1997 . The specific rate of Mn4q reduction in seawater k
red
is of the order of 20% per day but the value of kred
increases to 40% per day when 5 mgrl of marine
Ž .
humic substances where added Sunda et al., 1983 . Reduction is strongly enhanced by light but we do not consider this effect because our samples were kept in the dark during the incubation. It appears that the residence time of Mn on particles with respect to reduction of Mn4q is 1rk s 2.5–5 days which is
red
close to our tMn value.
What is the implication of this reversible process? If an element is subject to both dissolution and scavenging and if these processes both follow first order kinetics: dXs s k Xy 1 py labiley k X1 s
Ž .
6ž /
d t d Xpy labile s y k Xy 1 py labileqk X1 sŽ .
7ž
d t/
where k is the scavenging rate, k1 y 1 is the dissolu-tion rate, X , X and X the concentradissolu-tions in solu-s l p
tion, of the labile particulate and of the total particu-late. Then, we obtain by integration:
D
Ž .
t s DmaxŽ
1y ey Ž k1qky 1.Žtq24..
Ž .
8 X X with ky 1 init X qX y XŽ
sw py labile.
swž
k1qky 1/
max DX s XinitŽ .
9 p Ž . Ž .If k1<k , Eqs. 8 and 9 become equivalent toy 1
Ž . Ž .
Eqs. 4 and 5 and the adjustment of the residence time based on our data will not change significantly when considering irreversible or reversible dissolu-tion. This is the case for Mn where k1s k <kox red
Ž . max
s k . If k /0 scavenging occurs then Dy 1 1 X F Xinitpy labilerXinitp . In that case, Mn is constantly added to the particles so that a labile authigenic fraction remains on particles even after a long incubation
Ž
time this may be an alternative explanation for the significant Ba, Sr and Mn authigenic fraction found
.
in residual particles . At steady state, we expect to obtain a ratio MnsrMnpy labiles k rk f10–40.y 1 1 Therefore, more than 90% of the non-refractory Mn should be present in solution: this is consistent with our observations. Our experiments suggests domi-nance of reduction at least at the begining of the experiments. At 30 m, the decrease of DMn between 10 and 20 days suggests that oxidation becomes dominant over reduction at the end of the incubation. Other experimental dissolutions of Mn have been
Ž .
proposed. Collier and Edmond 1984 studied
partic-Ž .
ulate matter mainly phytoplankton collected from Ž max
.
tMns 0.3 day agree with our values. These authors stressed the possible effect of filtration in breaking phytoplankton cells and the resulting artificial re-lease of trace metals. Direct dissolution of aerosols ŽSaharan dust in seawater yields comparable D. max Mn
Ž30% but the process is much more rapid t. Ž Mnf
. Ž .
0.003 day Guieu et al., 1994 . This large timescale difference suggests that Mn is not present under the same chemical forms in the aerosols arriving in seawater and in the marine particles.
4.5. Barium and strontium
Particulate Sr is dissolved rapidly and extensively Ž
as expected if it is present as celestite Bernstein et
. Ž .
al., 1992 . A significant fraction 20–30% of the authigenic Ba is not dissolved during the experiment. This authigenic refractory fraction may be well
crys-Ž .
tallized barite BaSO4 that has a slow dissolution
Ž .
kinetics Dehairs et al., 1980 . At 30 m, the dissolu-tion of Ba is less extensive but faster than at 200 m. The lower percentage of Ba dissolution of the 30 m particles can be related to their larger lithogenic fraction because this Ba may be present in poorly soluble minerals such as barite or silicates. The slower dissolution rate may be related to the more extensive crystallization of Ba at 200 m compared to 30 m: in the ocean barite is formed at depths around
Ž .
and below 200 m Dehairs et al., 1980 . The values
Ž .
obtained for tBa F1 day at 30 m, 3 days at 200 m
are very short compared to the particulate Ba resi-dence time of 24 years based on barite dissolution
Ž .
kinetics Dehairs et al., 1980 . This discrepancy sug-gests that in our samples, particulate Ba was not present as well-crystallized barite or that in the natu-ral environment rapid particulate Ba dissolution is balanced by a rapid particle formation that did not occur in our experiment.
The faster Ba dissolution in the 30 m experiment compared to the 200 m experiment is also consistent with the faster mineralization of POC and the larger
Ž .
bacterial production Yoro, 1998 . For the 30 m samples, small pteropods were present on the first
Ž . Ž .
filters D0–D4 and for irradiated samples D5–D9
Ž .
and were absent on the last ones D6–D8 .
Dissolu-Ž .
tion of the pteropod shells CaCO3 may provide a substantial source of labile Ba and Sr. Additional release of Ba and Sr may come from the dissolution
of coccoliths. The pH and the inorganic carbon of the solutions were not measured so that it is not possible to determine precisely the influence of CO2 release on the dissolution of carbonates. However,
Ž . Ž
about 460 mM C at 200 m and 720 mM C at 30 .
m of TOC were consumed by bacteria in the
incuba-Ž .
tion bottles Yoro, 1998 . Then, 244 mM of CO at2 200 m and 421 mM of CO at 30 m could have been2
Ž
produced during the experiment corresponding to .
bacterial growth efficiency of 40–50% and could have acidified the solution. Dissolution of CaCO3 will tend to buffer the pH of the solution.
The effect of CaCO dissolution can be estimated3
from the observation of the incubated material in the 30-m experiment where the largest carbon
mineral-Ž .
ization occurs Table 5 . After 20 days of incubation pteropod shells were completely dissolved whereas some coccoliths were still visible. This suggests that the final incubation solutions are undersaturated with respect to aragonite but that calcite still buffers the
2y Ž
solution. It implies that CO3 ; 40–60 mM Copin-.
Montegut, 1996 . Considering that at the end of the
´
incubation S CO2; 2400 mM, it follows that pH ;
Table 5
Initial seawater and final incubation solution estimated composi-tions Initial D7 and D8 seawater a Ž . ÝCO mM2 2000 2400 y Ž . HCO3 mM 1650 2260 2y Ž . CO3 mM 345 40–60 Ž . pH SWS 8.2 7.2–7.4 3y Ž . b Total PO4 mM 0.1 3.3 3q 2y Fraction of La as La –CO3 - 91% 53% c complexes 3qc Fraction of La as free La 4% 21% 3q 3y Fraction of La as La –SO4 - 3% 17% c complexes 3q 3y Fraction of La as La –PO4 0.3% 2% c complexes a Ž .
Estimated assuming that ÝCO s ÝCO seawater q 4002 2
mM.
b
Estimated from TOC mineralization assuming a PrC Red-field ratio of 1r120.
c
Speciation of the dissolved REE was calculated by taking into account free REE as well as chloride, fluoride, sulfate,
Ž
carbonate, bicarbonate and phosphate complexes Byrne and .
7.2–7.4. This unusually low pH is due to the combi-Ž
nation of the strong carbon mineralization generally .
found in cold deep waters and of the high tempera-ture. Therefore, the high POC content of the incuba-tion soluincuba-tions may have controlled the dissoluincuba-tion process. Such a control may not be as efficient in real seawater. However, such conditions may exist in micro-environments when particulate matter is being degraded.
4.6. Fractionation between REE
Dissolved REE are scavenged by oxygen-donor substance such as Mn–Fe oxyhydroxides and
partic-Ž
ulate organic matter Balistrieri et al., 1981; .
Sholkovitz et al., 1994; Tachikawa, 1999 . The scav-enged REE are redissolved at greater depths by the remineralization of carrier particles. These processes induce fractionations between the different REE in
Ž
both dissolved and particulate fractions Tachikawa .
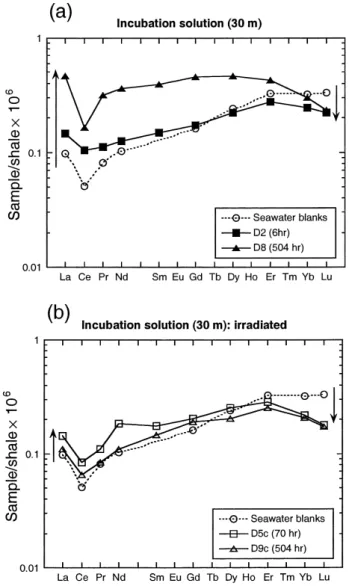
et al., 1999a . Fig. 3 presents shale-normalized REE patterns of the incubation solutions at 30 m. During the incubation, the concentrations of dissolved Light
Ž .
REE LREE: La, Ce, Pr, Nd increase whereas those Ž
of dissolved Heavy REE HREE: Dy, Ho, Er, Tm,
. Ž .
Yb, Lu slightly decrease Fig. 3a . In natural envi-ronments, authigenic LREE are enriched on particles
Ž
compared to HREE Byrne and Sholkovitz, 1996; .
Tachikawa et al., 1999b . Therefore, when dissolu-tion of particulate REE occurs, LREE are more abundantly released to the solution than HREE. Our results are in good agreement with field observations of the preferential LREE release by river particles ŽSholkovitz, 1992 and with the REE patterns of.
Ž
sequentially leached marine particles Sholkovitz et .
al., 1994; Tachikawa et al., 1997 . Fig. 2 presents DNd and DCe as a function of time. At 200 m, both
Ž DNd and DCe are twice higher than at 30 m Table
.
4 . At both depths, tNd is estimated around 10 days.
Ž . Ž
tCe is shorter at 200 m 4 days than at 30 m 14
. Ž .
days . Recently, Tachikawa et al. 1999b demon-strated that the negative Ce anomaly of seawater
Ž .
samples is formed by two processes: 1 microbially Ž
mediated in situ Ce oxidation Ce oxide is insoluble,
. Ž .
Elderfield, 1988; Moffett, 1990 and 2 preferential dissolution of Ce neighbors which increases a rela-tive depletion of Ce. The higher dissolution of La, Pr or Nd compared to Ce observed during the
incuba-Fig. 3. Shale normalized REE patterns of the incubation solutions
Ž . Ž .
at 30 m: a nonirradiated samples and b irradiated samples. The trends of concentration variations of LREE and HREE are indi-cated by upwards and downwards arrows.
tion confirms this mechanism. For the 30 m samples, there is a simultaneous precipitation of Ce and Mn in the biotic samples that is not observed for Nd. Our results are consistent with the mechanism suggested
Ž .
by Moffett 1990 : the oxidation of Ce III to Ce IV is coupled to the microbially mediated oxidation of Mn II to Mn IV. This coupling does not affect Nd Žpresent only as Nd III ..
The behavior of REE in seawater is strongly controlled by REE–CO32y complexes that stabilize REE in solution with a stronger effect on HREE
Ž .
compared to LREE Byrne and Sholkovitz, 1996 . We estimated the speciation of La for the initial
Ž .
seawater and for D8 Table 5 . Due to the strong decrease in CO2y during the incubation, carbonate
3
complexes represent only 53% of the dissolved La in the final incubation solution whereas 91% of the La was present as carbonate complexes in the initial seawater. The increase of dissolved REE when the pH decreases is consistent with previous
observa-Ž .
tions in natural waters Gaillardet et al., 1997 . The REE pattern in the final incubation solution depends on the REE pattern of the initial seawater and of the labile REE on the incubated particles, on the REE fractionation during sorption on Fe–Mn oxyhydrox-ides and organic matter and during phosphate pre-cipitation if it occurred. Due to the large number of unconstrained parameters, we did not try to recon-struct it.
In the 30 m incubation solutions, the increase of LREE concentrations is much smaller for the
irradi-Ž .
ated samples D5c and D9c in Fig. 3b than for the biotic samples. It suggests that the LREE dissolution is enhanced by biotic processes. By contrast, the HREE precipitation may be related to an abiotic process since both irradiated and non-irradiated sam-ples show similar decreases of concentration.
4.7. Dissolution of Th isotopes
Thorium is a very insoluble element. 232Th and
230 Ž
Th have distinct sources in the ocean Roy-Bar-. 232
man et al., 1996 . Th is derived from continental material. 230Th is present in lithogenic matter but in the marine environment, it is also produced by the in situ radioactive decay of234U in seawater and rapidly scavenged by particulate matter. The production of
230
Th at a known rate is used to calibrate scavenging Ž
and marine particle transport models Bacon and .
Anderson, 1982 . One of the most important out-comes of these 230Th studies is that the scavenging of particle reactive metals is reversible.
The230Thr232Th ratio can be used to estimate the fraction a of authigenic Th in the particles:
Rpy Rlitho
as
Ž .
10Rswy Rlitho
where R represents the 230Thr232Th ratio, the sub-script p, litho and sw correspond to particles, lithogenic material and seawater, respectively, Rlitho
y 6 Ž .
s 4.4=10 Andersson et al., 1995 and Rsws
y 6 Ž . y 6
13.6= 10 Table 3 . At 30 m, RpF4.8=10
so that aF4%. At 200 m, R f5–6=10p y 6 so that af6–17%. This increase of a with depth is consis-tent with the uptake of dissolved Th on the particles
Ž
during their transit from 30 m to 200 m Roy-Bar-.
man et al., 2000 .
During the incubations, there is a significant in-crease of dissolved Th. This inin-crease may represent the total quantity of Th that can be potentially re-leased from the particles or it may only represent the net effect between dissolution of particulate matter and scavenging by the residual particles. We can use Th isotopes to investigate the details of these pro-cesses. We take advantage of the fact that marine particles and the seawater in which they are diluted have distinct 230Thr232Th ratios: particulate Th
Ž230 232 y 6 230
Thr Ths 4.5=10 at 30 m and Thr
232 y 6 .
Ths 5–6=10 at 200 m contains a large
frac-Ž230 232 y 6.
tion of lithogenic Th Thr Ths 4–5=10
and dissolved Th is enriched in 230Th due to the in
Ž230 232 y 5.
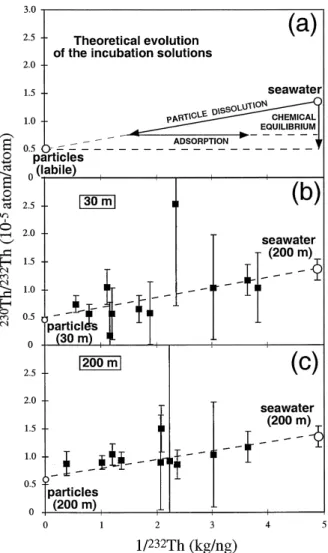
situ production Thr Ths 1.36=10 . Fig. 4 presents the 230Thr232Th ratio versus 1r232Th for the incubation solutions. In the case of a simple
Ž
binary mixing Th in incubation solutions seawater . Thq particle derived Th due to dissolution ,
230
Thr232Th ratio as a function of 1r232Th for the incubation solutions is given by:
C Rsw swy C Rp p Rpy Rsw 1
Rss qC Csw p
Ž .
11Cswy Cp Cswy C Cp s
where C and Cs sw are the232Th concentrations in the incubation solution and seawater blank, C is amountp
of 232Th dissolved from particles divided by the mass of the incubation solution and R , Rs sw and Rp are the230Thr232Th ratios in the incubation solution,
Ž
seawater blank and particles we consider that disso-lution of particulate matter does not change
signifi-.
cantly the mass of the incubation solution . There-fore, the incubation solutions should lie on a straight line between marine particles and seawater blanks ŽFig. 4a . If readsorption occurs, concentration will. decrease but there will be no change of 230Thr232Th ratio so that the sample will be shifted horizon-tally toward the right. If there is a rapid reversible equilibrium between seawater and particles, we
Fig. 4. 230Thr232Th ratio versus 1r232Th for the incubation Ž .
solutions. a Theoretical evolution of the incubations solutions: Ž .1 for simple dissolution, incubation solutions lie on a straight
Ž . line between labile marine particles and seawater blanks; 2 if readsorption occurs the sample will be shifted horizontally toward
Ž .
the right; 3 for rapid reversible equilibrium between seawater and particles, incubation solutions lie on a straight vertical line Žsee text for details . b 30 m data. c 200 m data. The 30 m and. Ž . Ž . 200 m data can be explained by simple dissolution or simple dissolutionqreadsorption but rapid reversible equilibrium be-tween seawater and particles can be ruled out. The straight lines passing through the incubation solutions, the initial seawater and the bulk particles indicate that the bulk particles represent a possible Th source during the simple dissolution of the particulate matter in seawater. However, it is also possible to draw straight lines passing through the incubation solutions, the initial seawater and ending up significantly above the bulk particles, leaving open the possibility that the230Thr232Th ratio of the labile fraction is distinct from the230Thr232Th ratio of the bulk particles.
expect no change of concentrations and the isotopic ratio of the incubation solution will be buffered by
the 230Thr232Th ratio of marine particles because they contain the majority of Th. The data can be explained by simple dissolution or simple dissolution
Ž .
qreadsorption Fig. 4b and c but rapid reversible equilibrium between seawater and particles can be ruled out.
The230Thr232Th ratio of the incubation solutions points towards the 230Thr232Th ratio of the labile fraction of the particles. On Fig. 4b and c, the straight lines passing through the incubation solu-tions, the initial seawater and the bulk particles indicates that the bulk particles represent a possible Th source during the simple dissolution of the partic-ulate matter in seawater. In this case, labile and bulk Th cannot be distinguished isotopically. However, it is also possible to draw straight lines passing through the incubation solutions and the initial seawater, ending up significantly above the bulk particles. This leaves open the possibility that the230Thr232Th ratio of the labile fraction is distinct from the230Thr232Th ratio of the bulk particles.
The small shift between the seawater blanks and the 200 m seawater is consistent with a small amount of contamination of the blanks by crustal material, but it will not change the global correlation obtained for the incubation solutions and the 200 m seawater. It is surprising to obtain an irreversible dissolution for Th because it is a very insoluble element and there is a high particle concentration. However, the degradation of particulate matter may produce a large amount of colloidal matter. These colloids
Ž .
scavenge Th Baskaran et al., 1992 but due to their small size they remain in AsolutionB during the filtration, producing these apparently high dissolved Th concentrations.
4.8. Is there a link between inorganic tracers and organic matter dissolution?
In principle, the influence of biological activity on inorganic tracer behavior should lead to distinct tracer concentrations in sterilized and non sterilized dis-solved samples. However, since the samples were
Ž . Ž
sterilized 24 h 200 m samples to 48 h 30 m .
samples after particle collection at sea, significant concentration changes under biotic conditions may have occurred before the sterilization. For Ba and Sr at 30 m, dissolution occurred before sterilization so
that we have no clue whether it is biotic or abiotic. For Ba at 200 m, the lack of significant difference
Ž . Ž .
between samples C6 biotic and C7 poisoned sug-gests that an abiotic process controls dissolution. For Mn at 30 and 200 m, both concentrations and DMn are significantly higher for poisoned or irradiated
Ž . Ž
samples C7, D9 compared to biotic samples C5– .
C6, D7–D8 , suggesting a biotic control on the reprecipitation of Mn. This process may also control the simultaneous precipitation of Ce. We noted in Section 4.6 that LREE dissolution is enhanced by biotic processes and that HREE precipitation may be related to abiotic processes. At 200 m, REE and Th
Ž .
concentrations are much higher in C7 poisoned
Ž .
than in C5 and C6 not poisoned . This is not due to sample contamination by sodium azide addition. Still, it is not clear if this difference is just due to the lack
Ž
of biological activity in C7 this would imply that biological activity has a very strong influence on the scavenging of these elements and this was not
ob-.
served at 30 m or to sodium azide inducing a larger Ž
extent of REE and Th release for an unknown .
reason . We noted that during these experiments, POC oxidation occurs on timescales of the same
Ž .
order as inorganic tracers Yoro, 1998 and we sug-gested earlier that POC oxidation to CO may trig-2
ger the dissolution of some inorganic phases. The high enrichment of POC in the incubation bottles compared to natural environments enhanced the amount of CO released and the rate of pH change.2
Therefore, it may have produced artificially high DX
and tX values compared to seawater. However, both DX and tX derived from the incubation may be relevant for micro-environment in which particulate matter is degraded. This is particularly interesting with regards to the recent claim that a biologically mediated dissolution of calcium carbonate occurs
Ž .
above the chemical lysocline Milliman et al., 1999 . It was recently suggested that bacterial dissolution of the organic coating of diatom frustules can enhance
Ž .
the dissolution of silica Bidle and Azam, 1999 . Bacterial dissolution of organic coating may also enhance dissolution of some of the tracers presented
Ž .
in this work: 1 it removes a protective coating from Ž .
mineral phases and 2 organic coatings are potential carriers of particle reactive metals such as REE ŽBalistrieri et al., 1981; Sholkovitz et al., 1994;
. Tachikawa et al., 1999a .
5. Conclusion
Inorganic tracers display a wide range of solubili-ties during the degradation of large marine particles. These variations are in agreement with the general knowledge concerning these tracers in the ocean. There are also significant variations in the timescales necessary to achieve this dissolution. These timescales range from less than one day to 14 days. For Mn, the timescale that we obtain is grossly consistent with previous estimates whereas for Ba, the timescale that we obtain is much shorter than what is inferred from dissolution kinetics considera-tions. We suspect that during the experiment, biolog-ical activity has a significant control on the dissolu-tion process. This control may be due in part to the high particulate matter content of the incubation solutions. Therefore, in future studies, an effort should be made to work with less particle-enriched environments. However, this work stresses the possi-bility of rapid dissolution of inorganic tracers in confined environments.
Acknowledgements
We are grateful to J.C. Marty for his support to our project at the DYFAMED station. We thank the captain and the crew of the R.V. Professeur Georges Petit for their assistance and hospitality during the cruise. We thank C. Bournot-Marrec, M. Goutx, F. Van Wambeke, P. Brunet, M. Valladon, B. Reynier, L. Guidi for their help at different stages of the project. We are grateful to F. Dehairs, R. Sherrell and two anonymous reviewers for their fruitful com-ments. The thesis of R.A.-M. was partly financed by the AConselho Nacional de Pesquisa do Brasil ŽCNPq B and by the ASociete de Secours des Amis.
´ ´
des SciencesB.
References
Andersson, P.S., Wasserburg, G.J., Chen, J.H., Papanastassiou, D.A., Ingri, J., 1995. 238U–234U and 232Th–230Th in the Baltic sea and in river water. Earth Planet. Sci. Lett. 130, 217–234.
Bacon, M.P., Anderson, R.F., 1982. Distribution of thorium iso-topes between dissolved and particulate forms in the Deep-Sea. J. Geophys. Res. 87, 2045–2056.
Balistrieri, L., Brewer, P.G., Murray, J.W., 1981. Scavenging residence times of trace metals and surface chemistry of sinking particles in the deep ocean. Deep-Sea Res. 28, 101– 121.
Banner, J.L., Wasserburg, G.J., Chen, J.H., Moore, C.H., 1990.
234
U–238U–230Th–232Th systematics in saline groundwaters from central Missouri. Earth Planet. Sci. Lett. 101, 296–312. Baskaran, M., Santschi, P.H., Benoit, G., Honeyman, B.D., 1992. Scavenging of thorium isotopes by colloids in seawater of the Gulf of Mexico. Geochim. Cosmochim. Acta 56, 3375–3388. Bernat, M., Church, T., Allegre, C.J., 1972. Barium and strontium` concentrations in Pacific and Mediterranean sea water by direct isotope dilution mass spectrometry. Earth Planet. Sci. Lett. 16, 75–80.
Bernstein, R., Bernstein, H., Bernstein, B.R., Betzer, P.R., Greco, A.M., 1992. Morphologies and transformations of celestite in seawater: the role of acantharians in strontium and barium geochemistry. Geochim. Cosmochim. Acta 36, 3273–3279. Bidle, K.D., Azam, F., 1999. Accelerated dissolution of diatom
silica in marine bacterial assemblages. Nature 397, 508–512. Byrne, R.H., Sholkovitz, E.R., 1996. Marine chemistry and geo-chemistry of the lanthanides. In: Gschneider, K.A. Jr., Eyring,
Ž .
L. Eds. , Handbook on the Physics and Chemistry of Rare Earths. Elsevier.
Chen, J.H., Edwards, R.L., Wasserburg, G.J., 1987. 238U–234U and232Th in seawater. Earth Planet. Sci. Lett. 80, 241–251. Chou, L., Wollast, R., 1997. Biogeochemical behavior and mass
balance of dissolved aluminum in the western Mediterranean Sea. Deep-Sea Res. 44, 741–768.
Collier, R.W., Edmond, J.M., 1984. The trace element geochem-istry of marine biogenic particulate matter. Prog. Oceanogr. 13, 113–199.
Copin-Montegut, G., 1996. Chimie de l’eau de mer. Institut´ Oceanographique, Paris, 320p.´
Davies, J.E., Buat-Menard, P., 1990. Impact of atmospheric depo-´ sition on particulate manganese and aluminum distribution in northern Mediterranean surface water. Palaeogeogr., Palaeocli-matol., Palaeoecol. 89, 35–45.
Dehairs, F., Chesselet, R., Jedwab, J., 1980. Discrete suspended particles of barite and the barium cycle in the open ocean. Earth Planet. Sci. Lett. 49, 528–550.
Dehairs, F., Goeyens, L., 1987. Dissolved barium and nutrients in the Southern Ocean: their potential use as tracers for the characterization of the different watermasses. Belgian National Colloquium on Antarctic Research. Ed. Science Policy Office. Dehairs, F., Lambert, C.E., Chesselet, R., Risler, N., 1987b. The biological production of marine suspended barite and the barium cycle in the Western Mediterranean Sea. Biogeochem-istry 4, 119–139.
Elderfield, H., 1988. The oceanic chemistry of the Rare Earth Elements. Philos. Trans. R. Soc. London, Ser. A 325, 105–126. Fisher, N.S., Teyssie, J.-L., Krishnaswami, S., Baskaran, M.,´ 1987. Accumulation of Th, Pb, U and Ra in marine phyto-plankton and its geochemical significance. Limnol. Oceanogr. 32, 131–142.
Fowler, S.W., Buat-Menard, P., Yokohama, Y., Ballestra, S.,´ Holm, E., Van Nguyen, H.V., 1987. Rapid removal of
Cher-nobyl fallout from Mediterranean surface waters by biological activity. Nature 329, 56–58.
Francois, R., Honjo, S., Manganini, S.J., Ravizza, G.E., 1995. Biogenic barium fluxes to the deep sea: implications for paleoproductivity reconstruction. Global Biogeochem. Cycles 9, 289–303.
Gaillardet, J., Dupre, B., Allegre, C.J., Negrel, P., 1997. Chemical´ ` and physical denudation in the Amazon River Basin. Chem. Geol. 142, 141–173.
Greaves, M.J., Rudnicki, M., Elderfield, H., 1991. Rare Earth Elements in the Mediterranean Sea and mixing in the Mediter-ranean outflow. Earth Planet. Sci. Lett. 103, 169–181. Greaves, M.J., Statham, P.J., Elderfield, H., 1994. Rare earth
element mobilization from marine atmospheric dust into sea-water. Mar. Chem. 46, 255–260.
Guerzoni, S., Molinaroli, E., Chester, R., 1997. Saharan dust inputs to the western Mediterranean Sea: depositional patterns, geochemistry and sedimentological implications. Deep-Sea Res. 44, 631–654.
Guieu, C., Duce, R.A., Arimoto, R., 1994. Dissolved input of manganese in the ocean: the aerosol source. J. Geophys. Res. 99, 18789–18800.
Henry, F., Jeandel, C., Minster, J.-F., 1994. Particulate and dis-solved Nd in the Western Mediterranean Sea: sources, fates and budget. Mar. Chem. 45, 283–305.
Heussner, S., Rati, C., Carbonne, J., 1990. The PPS3 time-series sediment trap and the trap sample processing techniques used during the ecomarge experiment. Cont. Shelf Res. 10, 943– 958.
Hydes, D.J., De Lange, G.J., De Baar, H.J.W., 1988. Dissolved aluminum in the Mediterranean. Geochim. Cosmochim. Acta 52, 2107–2114.
Jeandel, C., Bishop, J.K., Zindler, A., 1995. Exchange of Nd and its isotopes between seawater small and large particles in the Sargasso Sea. Geochim. Cosmochim. Acta 59, 535–547. Kirchman, D.L., Keil, R.G., Simon, M., Welshmeyer, N.A., 1993.
Biomass and production of heterotrophic bacterioplankton in the oceanic subarctic Pacific. Deep-Sea Res. 40, 967–988. Lal, D., 1977. The oceanic microcosm of particles. Science 198,
997–1009.
Landing, W.M., Bruland, K.W., 1987. The contrasting biogeo-chemistry of iron and manganese in the Pacific Ocean. Geochim. Cosmochim. Acta 51, 29–43.
Maring, H.B., Duce, R.A., 1987. The impact of atmospheric aerosols on trace metal geochemistry in open ocean surface seawater: I. Aluminium. Earth Planet. Sci. Lett. 84, 381–392. McCave, I.N., 1975. Vertical fluxes of particles in the ocean.
Deep-Sea Res. 22, 491–502.
Milliman, J.D., Troy, P.J., Balch, W.M., Adams, A.K., Li, H.Y., Mackenzie, F.T., 1999. Biologically mediated dissolution of calcium carbonate above the chemical lysocline? Deep-Sea Res. 46, 1653–1669.
Moffett, J.W., 1990. Microbially mediated cerium oxidation in sea water. Nature 345, 421–423.
Moffett, J.W., 1994. A radiotracer study of cerium and manganese up take onto suspended particles in Chesapeake Bay. Geochim. Cosmochim. Acta 58, 695–703.
Moffett, J.W., 1997. The importance of microbial oxidation in the upper ocean: a comparison between the Sargasso Sea and equatorial Pacific. Deep-Sea Res. 44, 1277–1291.
Morley, N.H., Burton, J.D., Tankere, S.P.C., Martin, J.M., 1997. Distribution and behaviour of some dissolved trace metals in the Western Mediterranean Sea. Deep-Sea Res. 44, 675–691. Murnane, R.J., Cochran, J.K., Sarmiento, J.L., 1994. Estimate of particle- and thorium-cycling rates in the northwest Atlantic Ocean. J. Geophys. Res. 99, 3373–3392.
Porter, K.G., Feig, Y.S., 1980. The use of DAPI for identifying and counting aquatic microflora. Limnol. Oceanogr. 25, 943– 948.
Roy-Barman, M., Chen, J.H., Wasserburg, G.J., 1996. 230Th–
232Th systematics in the Central Pacific Ocean: the sources
and the fates of thorium. Earth Planet. Sci. Lett. 139, 351–363. Roy-Barman, M., Coppola, L., Souhaut, M., 2000. Thorium iso-topes in the Western Mediterranean Sea: an insight into the marine particle dynamics. Deep-Sea Res. Submitted for publi-cation.
Ruiz-Puno, D.P., 1994. Modele Colume d’eau au site DY-` Ž .
FAMED. In Rabouille, C. Ed. , Modelisation des cycles biogeochimiques marins: application aux operations de` JGOFS-France, Atelier 1993, Rapport No. 18.
Ruiz-Pino, D.P., Lambert, C.E., Jeandel, C., Buat-Menard, P.,´ 1990. Modelling the biogenic transport of atmospheric parti-cles in the Mediterranean Sea. Global Planet. Change 3, 47–65.
Sarthou, G., Jeandel, C., 2000. Seasonal variations of iron concen-trations in the Ligurian Sea and iron budget in the western Mediterranean Sea. Mar. Chem., accepted for publication. Schaffer, G., 1996. Biogeochemical cycling in the global ocean: 2.
J. Geophys. Res. 101, 3723–3735.
Sempere, R., Yoro, S.C., Van Wambeke, F., Charriere, B., 2000.´ ´ ` Microbial decomposition of large organic particles in the
northwestern Mediterranean Sea. An experimental approach. Mar. Ecol.: Prog. Ser. 198, 61–72.
Sholkovitz, E.R., 1992. Chemical evolution of Rare Earth Ele-ments: fractionation between colloidal and solution phases of filtered river water. Earth Planet. Sci. Lett. 114, 77–84. Sholkovitz, E.R., Landing, W.M., Lewis, B.L., 1994. Ocean
parti-cle chemistry: the fractionation of Rare Earth Elements be-tween suspended particles and seawater. Geochim. Cos-mochim. Acta 58, 1567–1579.
Sunda, W.G., Huntsman, S., Harvey, G.R., 1983. Photoreduction of manganese oxides in seawater and its geochemical and biological implications. Nature 301, 234–236.
Tachikawa, K., Jeandel, C., Dupre, B., 1997. Distribution of Rare´ Earth Elements and neodymium isotopes in settling particulate
Ž .
material of the tropical Atlantic Ocean EUMELI site . Deep-Sea Res. 44, 1769–1792.
Tachikawa, K., Jeandel, C., Roy-Barman, M., 1999a. A new approach to Nd residence time in the ocean: the role of atmospheric inputs. Earth Planet. Sci. Lett. 170, 433–446. Tachikawa, K., Jeandel, C., Vangriesheim, A., Dupre, B., 1999b.´
Distribution of Rare Earth Elements and neodymium isotopes Ž in suspended particles of the tropical Atlantic Ocean EUMELI
.
site . Deep-Sea Res. 46, 733–756.
Taylor, S.R., McLennan, S.M., 1985. The Continental Crust: Its Composition and Evolution. Blackwell.
Valladon, M., Dupre, B., Polve, M., 1995. ICP-MS chemical´ ´ analysis of geological samples: a new method for interferences and shifts corrections. Application to REE determination. EUG8 Strasbourg, Terra abstracts supplement 1 to Terra Nova 7 347.
Yoro, S.C., 1998. Decomposition de la matiere organique et du´ ` flux de carbone a travers le compartiment bacterien en milieu` ´ marin. these, Aix-Maseille II.`