HAL Id: hal-00330786
https://hal.archives-ouvertes.fr/hal-00330786
Submitted on 28 Jul 2005HAL is a multi-disciplinary open access
archive for the deposit and dissemination of sci-entific research documents, whether they are pub-lished or not. The documents may come from teaching and research institutions in France or abroad, or from public or private research centers.
L’archive ouverte pluridisciplinaire HAL, est destinée au dépôt et à la diffusion de documents scientifiques de niveau recherche, publiés ou non, émanant des établissements d’enseignement et de recherche français ou étrangers, des laboratoires publics ou privés.
Hydrological response to different time scales of
climatological drought: an evaluation of the
standardized precipitation index in a mountainous
mediterranean basin
S. M. Vicente-Serrano, J. I. López-Moreno
To cite this version:
S. M. Vicente-Serrano, J. I. López-Moreno. Hydrological response to different time scales of climato-logical drought: an evaluation of the standardized precipitation index in a mountainous mediterranean basin. Hydrology and Earth System Sciences Discussions, European Geosciences Union, 2005, 2 (4), pp.1221-1246. �hal-00330786�
HESSD
2, 1221–1246, 2005 Hydrological response to climatological drought S. M. Vicente-Serrano and J. I. L ´opez-Moreno Title Page Abstract Introduction Conclusions References Tables Figures J I J I Back CloseFull Screen / Esc
Print Version Interactive Discussion Hydrol. Earth Sys. Sci. Discuss., 2, 1221–1246, 2005
www.copernicus.org/EGU/hess/hessd/2/1221/ SRef-ID: 1812-2116/hessd/2005-2-1221 European Geosciences Union
Hydrology and Earth System Sciences Discussions
Papers published in Hydrology and Earth System Sciences Discussions are under open-access review for the journal Hydrology and Earth System Sciences
Hydrological response to di
fferent time
scales of climatological drought: an
evaluation of the standardized
precipitation index in a mountainous
mediterranean basin
S. M. Vicente-Serrano1and J. I. L ´opez-Moreno2
1
Centre d’Etudes Spatiales de la Biosph `ere (CESBIO), 18 avenue Edouard Belin, bpi 2801, 31401 Toulouse cedex 9, France
2
Instituto Pirenaico de Ecolog´ıa, CSIC (Spanish Research Council), Campus de Aula Dei, PO
box 202, Zaragoza 50080, Spain
Received: 3 June 2005 – Accepted: 8 July 2005 – Published: 28 July 2005
Correspondence to: S. M. Vicente-Serrano (sergio.vicente-serrano@cesbio.cnes.fr) © 2005 Author(s). This work is licensed under a Creative Commons License.
HESSD
2, 1221–1246, 2005 Hydrological response to climatological drought S. M. Vicente-Serrano and J. I. L ´opez-Moreno Title Page Abstract Introduction Conclusions References Tables Figures J I J I Back CloseFull Screen / Esc
Print Version Interactive Discussion
Abstract
At present, the Standardized Precipitation Index (SPI) is the most widely used drought index to provide good estimations about the intensity, magnitude and spatial extent of droughts. The main advantage of the SPI in comparison with other indices is the fact that the SPI enables both determination of drought conditions at different time scales
5
and monitoring of different drought types. It is widely accepted that SPI time scales af-fect different sub-systems in the hydrological cycle due to the fact that the response of the different water usable sources to precipitation shortages can be very different. The long time scales of SPI are related to hydrological droughts (river flows and reservoir storages). Nevertheless, few analyses empirically verify these statements or the
use-10
fulness of the SPI time scales to monitor drought. In this paper, the SPI at different time scales is compared with surface hydrological variables in a big closed basin located in the central Spanish Pyrenees. We provide evidence about the way in which the higher (>12 months) SPI time scales may not be useful for drought quantification in this area. In general, the surface flows respond to short SPI time scales whereas the reservoir
15
storages respond to higher time scales (7–10 months). Nevertheless, important sea-sonal differences can be identified in the SPI-usable water sources relationships. This suggests that it is necessary to test the drought indices and time scales in relation to their usefulness for monitoring different drought types under different environmental conditions and water demand situations.
20
1. Introduction
Drought is one of the main natural hazards affecting the economy and the environment of large areas (Obasi, 1994; Bruce, 1994; Wilhite, 2000). Droughts cause crop losses (Austin et al., 1998; Leilah and Al-Khateb, 2005), urban water supply shortages (De Gaetano, 1999), social alarm (Morales et al., 2000), degradation and desertification
25
HESSD
2, 1221–1246, 2005 Hydrological response to climatological drought S. M. Vicente-Serrano and J. I. L ´opez-Moreno Title Page Abstract Introduction Conclusions References Tables Figures J I J I Back CloseFull Screen / Esc
Print Version Interactive Discussion (Pausas, 2004; Flannigan and Harrington, 1988).
Drought is a complex phenomenon which involves different human and natural fac-tors that determine the risk and vulnerability to drought. Although the definition of drought is very complex (Wilhite and Glantz, 1985), it is usually related to a long and sustained period in which water availability becomes scarce (Havens, 1954; Dracup
5
et al., 1980; Redmond, 2002). Drought can be considered to be essentially a climatic phenomenon (Palmer, 1965; Beran and Rodier, 1985) related to an abnormal decrease in precipitation (Oladipo, 1985; McKee et al., 1993).
The delimitation of the surface extent of droughts is very difficult to determine. Com-pared with other hydrological hazards, such as floods, the development of droughts
10
is slow and it is very difficult to identify the moment in which droughts start and finish (Burton et al., 1978). Usually, droughts are only recognised when human activities and the environment are affected.
Important efforts for developing methodologies to quantify different aspects related to droughts have been made, such as the spatial differences in the drought hazard
15
(Vicente-Serrano and Beguer´ıa, 2003; Lana et al., 1998; Beersma and Buishand, 2004), the prediction of droughts by means of the use of atmospheric circulation in-dices (Cordery and McCall, 2000; Lloyd-Hughes and Saunders, 2002), and the mit-igation of drought effects (WMO, 2000). However, more efforts have been made to develop drought indices, which allow an earlier identification of droughts, their intensity
20
and surface extent. During the twentieth century, several drought indices were devel-oped, based on different variables and parameters (Heim, 2002). Drought indices are very important for monitoring droughts continuously in time and space, and drought early warning systems are based primarily on the information that drought indices pro-vide (Svoboda et al., 2002).
25
Together with the problems for clearly establishing the spatial and temporal extent of droughts, other important problems are involved in monitoring droughts, problems which are related to the different time scales of this phenomenon. McKee et al. (1993) indicated that usable water resources include soil moisture, ground water, snowpack,
HESSD
2, 1221–1246, 2005 Hydrological response to climatological drought S. M. Vicente-Serrano and J. I. L ´opez-Moreno Title Page Abstract Introduction Conclusions References Tables Figures J I J I Back CloseFull Screen / Esc
Print Version Interactive Discussion river discharges, and reservoir storages. The time period from the arrival of
precip-itation until usable water is available differs considerably. Thus, the time scale over which precipitation deficits accumulate becomes extremely important and functionally separates different types of drought: hydrological, environmental, agricultural, urban, etc.
5
The majority of drought indices have a fixed time scale. For example, the Palmer Drought Severity Index (PDSI, Palmer, 1965) has a time scale of about 9 months (Guttman, 1998), which does not allow identification of droughts at shorter time scales. Moreover, this index has many other problems related to calibration and spatial com-parability (Guttman et al., 1992; Karl, 1983; Alley, 1984). To solve these problems,
10
McKee et al. (1993) developed the Standardized Precipitation Index (SPI), which can be calculated at different time scales to monitor droughts in the different usable water resources. Moreover, the SPI is comparable in time and space (Hayes et al., 1999; Lana et al., 2001; Wu et al., 2005).
The SPI was developed in 1993 following a careful procedure (Redmond, 2002), but
15
due to its robustness it has already been widely used to study droughts in different regions, among others the USA (Hayes et al., 1999), Italy (Bonaccorso et al., 2003); Hungary (Domonkos, 2003); Korea (Min et al., 2003); Greece (Tsakiris and Vangelis, 2004), and Spain (Vicente-Serrano et al., 2004; Lana et al., 2001), and the SPI has also been included in drought monitoring systems and management plans (Wu et al.,
20
2005).
In general, different studies have indicated the usefulness of the SPI to quantify different drought types (Edwards and McKee, 1997; Hayes et al., 1999; Komuscu, 1999). The long time scales (over 6 months) are considered as hydrological drought indicators (river discharges or reservoir storages) (McKee et al., 1993; Hayes et al.,
25
1999).
Although the SPI is widely used (Wu et al., 2005), there are not many empirical stud-ies that provide evidence about the usefulness of the different time scales for drought monitoring in surface water resources. Among the limited studies on this topic, in
Hun-HESSD
2, 1221–1246, 2005 Hydrological response to climatological drought S. M. Vicente-Serrano and J. I. L ´opez-Moreno Title Page Abstract Introduction Conclusions References Tables Figures J I J I Back CloseFull Screen / Esc
Print Version Interactive Discussion gary Szalai et al. (2000) analysed the relationships between time scales of SPI, river
discharges and reservoir storages, showing important spatial differences.
This paper analyses the usefulness of different SPI time scales to monitor droughts in river discharges and reservoir storages, also considering monthly differences. The study was carried out in a large basin located in the central Spanish Pyrenees where
5
there is a high complexity of hydrological processes with a marked seasonal variabil-ity. The objective was to determine the most adequate time scales of SPI to monitor droughts in two basic water usable sources. This can be very useful for water resource management in mountain areas, which are usually the main source of hydrological resources in the Mediterranean region.
10
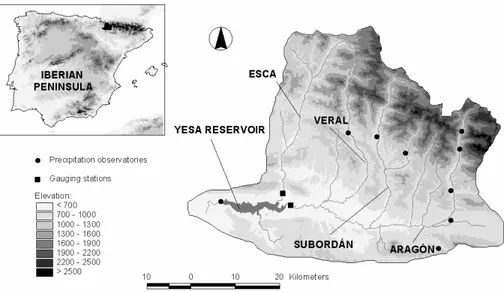
2. Study area and the Yesa reservoir
The study was carried out in the high basin of the Aragon River, in the central Spanish Pyrenees (Fig. 1). The area was selected because it is a delimited hydrological system closed by the Yesa reservoir, which finally retains the water resources that the basin collects. Moreover, two hydrologic variables can be summarised within the basin: river
15
discharges and reservoir storages.
The surface of the basin is 2181 km2, with a wide range of altitudes, from 2886 m in the Collarada peak to less than 500 m in the Yesa reservoir. Relief and lithology are arranged in parallel bands in a NW-SE direction (Soler and Puigdef ´abregas, 1972). In the low elevated areas the mean annual precipitation is 800 mm. This value is
over-20
come in the rest of the basin; above 1500 m, the precipitation is higher than 1500 mm. The annual variability is very high, and the rainy season extends from October to June. Mean temperature is 12◦C in the inner depression. During the cold season (November to April) the isotherm of 0◦C is located at 1.549 m a.s.l. (Garc´ıa-Ruiz et al., 1985). This isotherm explains the great importance of snow accumulation in the availability of
win-25
ter and spring water resources (L ´opez-Moreno and Garc´ıa-Ruiz, 2004). The abundant winter precipitation produces high runoff in the lower sector of the study area. Above
HESSD
2, 1221–1246, 2005 Hydrological response to climatological drought S. M. Vicente-Serrano and J. I. L ´opez-Moreno Title Page Abstract Introduction Conclusions References Tables Figures J I J I Back CloseFull Screen / Esc
Print Version Interactive Discussion the 0◦C isotherm precipitation is retained in solid form and melts from April to June.
Thus, from the end of autumn until June there exists a prolonged period of high inflows to the Yesa reservoir, with a maximum in May and June. In summer the scarcity of precipitation and the exhaustion of the snowpack produce a marked period of low dis-charges. The total annual contribution of the Aragon and Esca rivers for the analyzed
5
period was 1327 hm3(42 m3s−1).
The Yesa reservoir collects all the surface runoff produced in the studied basin. The Yesa dam is 74 m high and was built in 1959 with an original capacity of 470 hm3. The Bardenas Canal, with a maximum capacity of 64 m3s−1, starts from the reservoir to supply water to new irrigated areas in semiarid sectors of northeast Spain. Reservoir
10
management is focused on reaching the maximum stored volume in May or June. This aim is achieved by releasing fewer discharges than inflows from October to June. However, large differences in the rhythm of filling have been found according to the hydro-climatic condition of each year (L ´opez-Moreno et al., in press). In summer, the coincidence of the lowest inflows to the reservoir with the highest water demand to
15
irrigation areas rapidly exhausts the water stored.
3. Methodology
3.1. Precipitation data
To carry out our analysis we used different hydrological variables. The precipitation data used to calculate the SPI was obtained in 8 observatories within the valley (To see
20
spatial distribution in Fig. 1). Data were provided by the National Institute of Meteorol-ogy (Spain) and covers the period between 1950 and 2000. To avoid inhomogeneities in the data (Peterson et al., 1998) we tested the inhomogeneity of series by means the Standard Homogeneity Normal Test (SHNT, Alexandersson, 1986) using relative homogenisation procedure by means of reference series created following Peterson
25
HESSD
2, 1221–1246, 2005 Hydrological response to climatological drought S. M. Vicente-Serrano and J. I. L ´opez-Moreno Title Page Abstract Introduction Conclusions References Tables Figures J I J I Back CloseFull Screen / Esc
Print Version Interactive Discussion ( ˘St`ıp´anek, 2004). From homogeneous precipitation records, we created a regional
pre-cipitation series by means of the weighted average of monthly records. The weight was the surface represented by each observatory by means of Thiessen polygons method, following Jones and Hulme (1996). Regional precipitation series represent the tempo-ral evolution of precipitation in the whole of the basin. Table 1 shows the coefficients of
5
correlation among the monthly precipitation series in each observatory and the regional series. Correlations are high and significant (p<0.001) in all observatories (R>0.84). 3.2. Calculation of the Standardized Precipitation Index
From regional precipitation series the SPI was calculated to determine the evolution and intensity of climatic droughts at different time scales, between 1 and 24 months.
10
The SPI was developed by McKee et al. (1993), and this index only uses precipitation data. Other variables also related to drought occurrence, such as the temperature, evapotranspiration, or atmospheric humidity, were not taken into account. Neverthe-less, numerous papers have indicated that precipitation is the most important vari-able in the drought indices that also include data of temperature or evapotranspiration
15
(Oladipo, 1985; Keyantash and Dracup, 2002). Moreover, precipitation is the vari-able that mainly determines the duration, magnitude, and intensity of droughts (Chang and Cleopa, 1991). The SPI shows a high correlation with the PDSI at time scales about 9 months, which indicates that for drought identification and monitoring, temper-ature does not contribute significantly to drought index (Redmond, 2002). Guttman et
20
al. (1992) has indicated that the effects of temperatures on the PDSI are little in com-parison to the effects of precipitation. Hence, it is preferable to work with a drought index that only uses precipitation data because it is less complex to calculate (Keyan-tash and Dracup, 2002) and also because availability of precipitation data is higher than temperature data, both in time and space.
25
McKee et al. (1993) has used the Gamma distribution to calculate the SPI at different time scales. However, Guttman (1999) has examined the SPI properties and indicated
HESSD
2, 1221–1246, 2005 Hydrological response to climatological drought S. M. Vicente-Serrano and J. I. L ´opez-Moreno Title Page Abstract Introduction Conclusions References Tables Figures J I J I Back CloseFull Screen / Esc
Print Version Interactive Discussion that the Pearson III distribution, which has three parameters, is the best model for SPI
calculation because it is more flexible and robust than Gamma. Moreover, the Pearson III is adapted better than other models to the precipitation frequencies at different time scales (Vicente-Serrano, in press). For SPI calculation we used the Pearson III distri-bution, following Vicente-Serrano (in press). Parameters were calculated by means of
5
the L-moments method (Hosking, 1990). 3.3. River discharges and reservoir storages
Two gauging stations provide information on river discharges between 1953 and 2000. They are located in the Esca and Aragon rivers (See location in Fig. 1). Data was obtained from the Confederaci ´on Hidrol ´ogica del Ebro (C.H.E., Ebro River
Administra-10
tion Office). These gauging stations are located at the entrance of the Yesa reservoir. Both rivers accumulate most of the inflow to the reservoir, except small ravines which drain into the reservoir during intense rainfall events. Monthly flows in the two gauging stations were summed and standardised monthly to be compared to the different time scales of SPI.
15
The water storages in the Yesa reservoir from 1959 were also used. This data was also obtained from the Ebro River Administration Office. The data on reservoir storages was also summed and standardised monthly.
Standardised data of river discharges and reservoir storage were compared with the SPI series at different time scales considering two approaches: continuously
(con-20
sidering all the months as a continuous) and monthly. For comparison the Pearson correlation coefficient was used.
HESSD
2, 1221–1246, 2005 Hydrological response to climatological drought S. M. Vicente-Serrano and J. I. L ´opez-Moreno Title Page Abstract Introduction Conclusions References Tables Figures J I J I Back CloseFull Screen / Esc
Print Version Interactive Discussion
4. Results
4.1. SPI temporal variability at different time scales
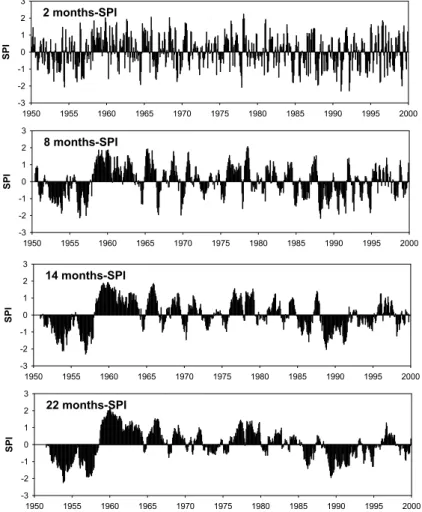
Figure 2 shows the continuous evolution of SPI at different time scales. At shorter time scales (e.g. 2 months) the dry (SPI<0) and moist (SPI>0) periods show a high temporal frequency, whereas when the time scale increases the frequency of dry
pe-5
riods decreases. At the time scale of 22 months only two important dry periods are recognised: the decade of 1950 and the decades of 1980 and 1990.
4.2. Continuous relationships between time scales of SPI and the hydrological vari-ables
Figure 3 shows the Pearson correlation coefficients between the continuous
standard-10
ized series of reservoir storages, river discharges and the SPI series at different time scales. For reservoir storages, correlations are positive, but there are important dif-ferences in regard to time scales. At the shorter time scales, the relationship is poor. On a 1-month time scale, the correlation is only R=0.11. Nevertheless, the correlation increases when the time scale increases, with a maximum of R=0.59 on a time scale of
15
8 months. Considering river discharges, higher correlations have been obtained with the SPI on shorter time scales (1–3 months). The maximum correlation is found on the time scale of 2 months (R=0.63). Results indicate that river discharges are more determined by precipitation of the current month and previous month.
4.3. Monthly relationships between the different time scales of SPI and hydrological
20
variables
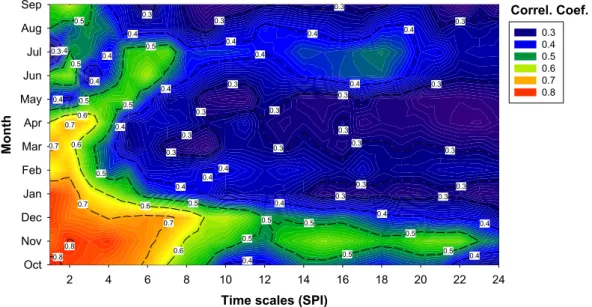
Figure 4 shows the monthly correlations between standardised series of river dis-charges and the SPI at different time scales. There are important seasonal differences in the response of the river discharges to different time scales of SPI. High correlations (R>0.7) are found during autumn and early winter (October–December) considering
HESSD
2, 1221–1246, 2005 Hydrological response to climatological drought S. M. Vicente-Serrano and J. I. L ´opez-Moreno Title Page Abstract Introduction Conclusions References Tables Figures J I J I Back CloseFull Screen / Esc
Print Version Interactive Discussion time scales lower than 6 months. The highest correlations were obtained in October
and November considering time scales of 1 and 2 months, respectively (R=0.83 and
R=0.80). Between February and April, correlations are lower than in winter months
but the higher correlations are also obtained with the shorter time scales of SPI (1–3 months). Between May and July, the absolute values of correlation continue
decreas-5
ing and rarely do the correlation coefficients (r) exceed 0.5. It is interesting to note that from March to July the SPI time scale with the highest correlation with discharge shows a progressive increase. Thus, maximum correlation in March is found at a 1 month time scale and in July the highest correlation is at a time scale of 7 months. In some cases such as June or July, discharge shows high correlations with both: short
10
SPI time scales (1–2 months) and larger scales (5–7 months) with an intermediate time scale range (3–4 months) with lower correlations (less than r=5). In August and September the lower correlations between river discharges and the SPI are identified. In any case, only the shorter time scales (1–3 months) exceed correlations of r=0.5.
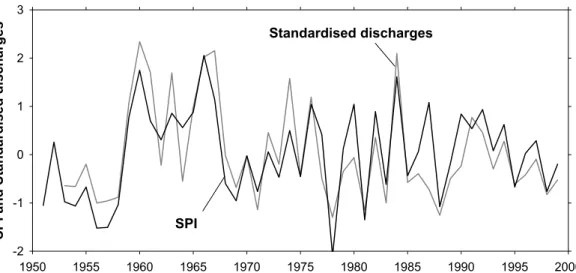
Figure 5 shows the evolution of SPI at the time scale of two months and the
standard-15
ised values of river discharges in November, the month in which the highest correlation between both variables was recorded. The SPI at this time scale allows identification of the main drought periods recorded, such as 1978, 1981 and 1988, years in which the river discharges in the basin were very low.
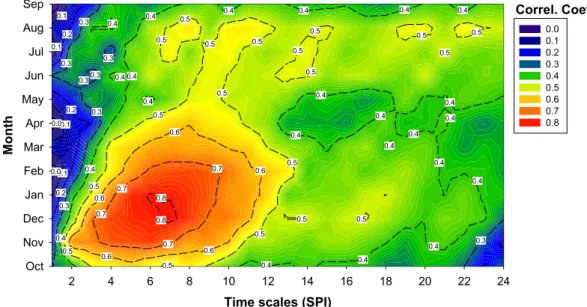
Figure 6 shows correlations between the monthly SPI series at the different time
20
scales and the time series of reservoir storages. Higher correlations than those for river discharges were obtained, but very different patterns were found in relation to the months with the highest correlations and also to the highest time scales of SPI. The highest correlations between the SPI and reservoir storages were found between November and February. In this period, the highest correlated SPI time scales
in-25
creased from 4 to 10 months. During spring, the correlations decreased slightly, espe-cially in the shorter time scales. During the summer months, reservoir storages are less sensitive to the SPI values than in winter and spring. However, significant correlations were found with time scales between 9 and 12 months.
HESSD
2, 1221–1246, 2005 Hydrological response to climatological drought S. M. Vicente-Serrano and J. I. L ´opez-Moreno Title Page Abstract Introduction Conclusions References Tables Figures J I J I Back CloseFull Screen / Esc
Print Version Interactive Discussion Reservoir storages are not sensitive to higher time scales of the SPI in any month
although, in general, correlations are higher considering time scales higher than 10 months than lower than 4 months.
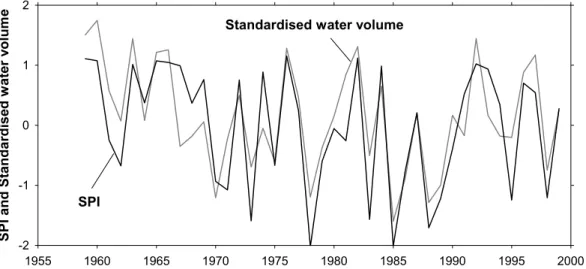
Figure 7 shows the evolution of the standardised water storages in the Yesa reservoir and the 7-months SPI in December, the month in which the correlation between both
5
parameters is higher. The years in which low water volume was recorded in the Yesa reservoir are seen to coincide with SPI values lower than −1.
5. Discussion and conclusions
This paper has analysed the usefulness of the different time scales of the Standardized Precipitation Index (SPI) to identify droughts in different usable water resources. The
10
analysis was done in the central Spanish Pyrenees (Aragon River Basin).
We have shown that droughts have a different frequency according to the time scale used for analysis. At shorter time scales dry and moist periods change with a high frequency. At the longest time scales the droughts are less frequent but their duration is higher. In general, it is accepted that the time scales of the SPI are useful to monitor
15
droughts in the different usable water resources.
Robust relationships were found analysing the role of the time scales of SPI on the river discharges and reservoir storages. In the case of river discharges, correlations higher than 0.6 were found with continuous series of the SPI at time scales between 1 and 3 months. The response of the river discharges to higher time scales of the SPI is
20
very low and the usefulness of higher time scales than 3 months to monitor river flow droughts in the mountain hydrological system studied here is very debatable. Never-theless, we must indicate that this statement could be valid for mountainous areas in which runoff is very intense, precipitation is high and the generation of runoff is quick. In other basins with different characteristics (size, shape, slope, litology, climate, land
25
cover, etc.) different time scales of SPI could be better to monitor droughts. In any case, more research is necessary to establish proper relationships between the
char-HESSD
2, 1221–1246, 2005 Hydrological response to climatological drought S. M. Vicente-Serrano and J. I. L ´opez-Moreno Title Page Abstract Introduction Conclusions References Tables Figures J I J I Back CloseFull Screen / Esc
Print Version Interactive Discussion acteristics between basins characteristics and their response to different time scales of
SPI.
On the other hand, the time scales of SPI useful to analyse droughts in the reservoir storages are longer than for river discharges in the study area. The continuous analysis showed that the higher correlations between standardised data of reservoir storages
5
and SPI were found at the time scales between 7 and 10 months, similar time scales that Szalai et al. (2000) observed in Hungary. Therefore, the reservoirs could not be sensitive to the short dry periods and to be affected by droughts, these must have of a higher duration, identified with the SPI at longer time scales. However, it is necessary to consider that the characteristics of the reservoir (capacity or impounded ratio index),
10
the use which receives (irrigation, hydropower generation, both) and the management pattern applied can produce a large variability in the response of the water stored to SPI at different scales. These results agree with the general theory on the response of the hydrological resources to precipitation deficits of different duration and intensity being the reservoir storages on longer time scales (McKee et al., 1993; Komuscu, 1999).
15
Nevertheless, in the study area we found a limit in the time scale of about 12 months. Time scales of SPI longer than 12 months do not seem useful to monitor any drought type. At higher time scales, the correlation decreases with values around R=0.40 for time scales between 12 and 24 months.
However, a noticeable seasonality was found in the SPI’s usefulness to monitor
20
droughts. There are monthly variations in both the strength of the correlations and the most suitable SPI time scales, resulting from several features of the hydrological behaviour of the basin. Thus, the large hydrological importance of snow accumulation and melting processes in the area (L ´opez-Moreno and Garc´ıa-Ruiz, 2004) determines the progressive increase in the optimum SPI time scale for explaining the river
dis-25
charges and the low importance of the SPI at short time scales, during late winter and spring. At the end of spring and during early summer, the high precipitations registered in the area, when the soil moisture in the basin is still high, produce a fast hydrological response to SPI (time scale of 1–2 months). Also, a new rise is observed in the
cor-HESSD
2, 1221–1246, 2005 Hydrological response to climatological drought S. M. Vicente-Serrano and J. I. L ´opez-Moreno Title Page Abstract Introduction Conclusions References Tables Figures J I J I Back CloseFull Screen / Esc
Print Version Interactive Discussion relation coefficients at large time scales as a consequence of snowmelt and the water
stored in the soils during the previous months. In August and September, the reserve of water in the basin is usually exhausted. Thus, the hydrological response is highly governed by the stormflow (short SPI time scale) and is subject to great uncertainty. The hydrological response of autumn seems to be mainly governed by both the
mois-5
ture conditions found at the beginning of the season and the short scale precipitation conditions. This explains the high correlation coefficients from 1 to 7 month SPI time scales. Finally, during winter wet conditions dominate the catchment, which explains the better response of river flows to shorter SPI time scales.
Seasonal variability in the response of reservoir storages to SPI seems to be related
10
to the fluvial regime received and the annual pattern of reservoir management. In sum-mer the reservoir storages do not show correlations higher than 0.55 with the SPI. On the contrary, however, during the autumn and winter the correlations between the SPI and the hydrological variables are more robust and even higher than 0.8. In summer, the contribution of the rivers with regard to the water supplied for irrigation is very low.
15
Thus, the water volume during this season depends more on the stored level reached at the end of spring, determined by the hydroclimatic characteristics of the previous year (L ´opez-Moreno et al., in press) than to the precipitation conditions during the cur-rent or the previous two or three months. In autumn, the water level depends on the stored volume at the end of the irrigation season (September) and the magnitude of
20
the inflow discharges. The former responds to the hydroclimatic conditions at large scale (L ´opez-Moreno et al., in press), and the latter is highly determined by the SPI at short scales. However, water stored in winter basically depends on the hydroclimatic conditions since the beginning of the filling period. Thus, the SPI at short time scale progressively loses importance and increases the correlation coefficients with the SPI
25
at larger time scales.
The results obtained here reveal the need of testing the usefulness of the drought indicators to monitor different drought types prior to developing monitoring plans. In general, the results agree with theoretical statements about the usefulness of different
HESSD
2, 1221–1246, 2005 Hydrological response to climatological drought S. M. Vicente-Serrano and J. I. L ´opez-Moreno Title Page Abstract Introduction Conclusions References Tables Figures J I J I Back CloseFull Screen / Esc
Print Version Interactive Discussion time scales of drought indices to monitor different drought types. Nevertheless, the
seasonal differences are very important and must be taken into account when drought information is provided. More studies are needed in other areas of different climatic and hydrological characteristics. The area studied here is an example of complex hydrological systems of mountainous regions, and in the Mediterranean region these
5
are the most important sources of water resources.
Acknowledgements. The authors want to acknowledge financial support from the following projects: BSO2002-02743, REN2003-07453, PIRIHEROS (REN2003-08678/HID) and CANOA
(CGL 2004-04919-c02-01), funded by Ministerio de Ciencia y Tecnolog´ıa (Spain) and
UE-FEDER, and ”Programa de grupos de investigaci ´on consolidados” (BOA 48 of 20-04-2005),
10
funded by Aragon Government. Research of the first author was supported by postdoctoral fellowship by the Ministerio de Educaci ´on y Ciencia (Spain).
References
Alexandersson, H.: A homogeneity test applied to precipitation data, J. Climat., 6, 661–675, 1986.
15
Alley, W. M.: The Palmer drought severity index: limitations and applications, J. Appl. Meteorol., 23, 1100–1109, 1984.
Austin, R. B., Cantero-Mart´ınez, C., Arr´ue, J. L., Play´an, E., and Cano-Marcell´an, P.:
Yield-rainfall relationships in cereal cropping systems in the Ebro river valley of Spain, European Journal of Agronomy, 8, 239–248, 1988.
20
Beersma, J. J. and Buishand, T. A.: Joint probability of precipitation and discharge deficits in the Netherlands, Water Resour. Res., 40, W12508 10.1029/2004WR003265, 2004.
Beran, M. A. and Rodier, J. A.: Hydrological aspects of drought, Studies and reports in hidrol-ogy, 39, UNESCO–WMO, Ginebra, 1985.
Bonaccorso, B., Bordi, I., Cancielliere, A., Rossi, G., and Sutera, A.: Spatial variability of
25
drought: an analysis of the SPI in Sicily, Water Resour. Manag., 17, 273–296, 2003.
Bruce, J. P.: Natural disaster reduction and global change, Bulletin of the American Meteoro-logical Society, 75, 1831–1835, 1994.
HESSD
2, 1221–1246, 2005 Hydrological response to climatological drought S. M. Vicente-Serrano and J. I. L ´opez-Moreno Title Page Abstract Introduction Conclusions References Tables Figures J I J I Back CloseFull Screen / Esc
Print Version Interactive Discussion
Burton, I., Kates, R. W., and White, G. F.: The environment as hazard. Oxford University Press, Nueva York, 240, 1978.
Chang, T. J. and Kleopa, X. A.: A proposed method for drought monitoring, Water Resour. Bull., 27, 275–281, 1991.
Cordery, I. and McCall, M.: A model for forecasting drought from teleconections, Water Resour.
5
Res., 36, 763–768, 2000.
DeGaetano A. T.: A Temporal Comparison of Drought Impacts and Responses in the New York City Metropolitan Area, Climatic Change, 42, 539–560, 1999.
Domonkos, P.: Recent precipitation trends in Hungary in the context of larger scale climatic changes, Nat. Hazards, 29, 255–271, 2003.
10
Dracup, J. A., Lee, K., and Paulson, E. G.: On the definition of droughts, Water Resour. Res., 16, 297–302, 1980.
Edwards, D. C. and McKee, T. B.: Characteristics of 20th century drought in the United States
at multiple time scales, Atmos. Sci., Paper No. 634, 1997.
Evans, J. and Geerken, R.: Discrimination between climate and human-induced dryland
degra-15
dation, J. Arid Env., 57, 535–554, 2004.
Flannigan, M. D. and Harrington, J. B.: A study of the relation of meteorological variables to monthly provincial area burned by wilfire in Canada (1953–1980), J. Appl. Meteorol., 27, 441–452, 1988.
Garc´ıa-Ruiz, J. M., Puigdef´abregas, J., and Creus, J.: Los recursos h´ıdricos superficiales del
20
Alto Aragon, Colecci ´on de Estudios Altoaragoneses, Huesca, 224, 1985.
Guttman, N. B., Wallis, J. R., and Hosking, J. R. M.: Spatial comparability of the Palmer Drought Severity Index, Water Resour. Bull., 28, 1111–1119, 1992.
Guttman, N. B.: Comparing the Palmer drought index and the Standardized Precipitation Index, Journal of the American Water Resources Association, 34, 113–121, 1998.
25
Guttman, N. B.: Accepting the standardized precipitation index: a calculation algorithm, Journal of the American Water Resources Association, 35, 311–322, 1999.
Havens, A. V.: Drought and agriculture, Weatherwise, 7, 51–55, 1954.
Hayes, M., Wilhite, D. A., Svoboda, M., and Vanyarkho, O.: Monitoring the 1996 drought using the Standardized Precipitation Index, Bulletin of the American Meteorological Society, 80,
30
429–438, 1999.
Heim, R. R.: A review of twentieth-century drought indices used in the United States, Bulletin of the American Meteorological Society, 83, 1149–1165, 2002.
HESSD
2, 1221–1246, 2005 Hydrological response to climatological drought S. M. Vicente-Serrano and J. I. L ´opez-Moreno Title Page Abstract Introduction Conclusions References Tables Figures J I J I Back CloseFull Screen / Esc
Print Version Interactive Discussion
Hosking, J. R. M.: L-Moments: Analysis and estimation of distributions using linear combina-tions of order statistics, Journal of Royal Statistical Society B, 52, 105–124, 1990.
Jones, P. D. and Hulme, M.: Calculating regional climatic time series for temperature and pre-cipitation: methods and illustrations, Int. J. Climatol., 16, 361–377, 1996.
Karl, T. R.: Some spatial characteristics of drought duration in the United States, J. Clim. Appl.
5
Meteorol., 22, 1356–1366, 1983.
Keyantash, J. and Dracup., J.: The quantification of drought: an evaluation of drought indices, Bulletin of the American Meteorological Society, 83, 1167–1180, 2002.
Komuscu, A. U.: Using the SPI to analyze spatial and temporal patterns of drought in Turkey, Drought Network News, 11, 7–13, 1999.
10
Lana, X. and Burgue ˜no, A.: Spatial and temporal characterization of annual extreme droughts in catalonia (Northeast Spain), Int. J. Climatol., 18, 93–110, 1998.
Lana, X., Serra, C., and Burgue ˜no, A.: Patterns of monthly rainfall shortage and excess in terms of the Standardied Precipitation Index for Catalonia (NE Spain), Int. J. Climatol., 21, 1669–1691, 2001.
15
Leilah, A. A. and Al-Khateeb, S. A.: Statistical analysis of wheat next term yield under previous term drought next term conditions, J. Arid Env., 61, 483-496, 2005.
Lloyd-Hughes, B. and Saunders, M. A.: Seasonal prediction of European spring precipitation from El Ni ˜no-southern oscillation and local sea-surface temperatures, Int. J. Climatol., 22, 1–14, 2002.
20
L ´opez Moreno, J. I. and Garc`Ia Ruiz, J. M.: Influence of snow accumulation and snowmelt on streamflow in the Central Spanish Pyrenees, Int. J. Hydrol. Sci., 49, 787–802, 2004.b L ´opez Moreno, J. I., Beguer`Ia, S., and Garc`Ia-Ruiz, J. M.: The management of a large
mediter-ranean reservoir: storage regimes of the Yesa reservoir, Upper Aragon River basin, Central Spanish Pyrenees, Env. Manag., in press, 2005.
25
McKee, T. B. N., Doesken, J., and Kleist, J.: The relationship of drought frecuency and duration to time scales, Eight Conf. on Applied Climatology, Anaheim, CA, Amer. Meteor. Soc., 179– 184, 1993.
Min, S. K., Kwon, W. T., Park, E. H., and Choi, Y.: Spatial and temporal comparisons of droughts over Korea with East Asia, Int. J. Climatol., 23, 223–233, 2003.
30
Morales, A., Olcina, J., and Rico, A. M.: Diferentes persepciones de la sequ´ıa en Espa˜na:
adaptaci ´on, catastrofismo e intentos de correcci ´on, Investigaciones Geogr ´aficas, 23, 5–46, 2000.
HESSD
2, 1221–1246, 2005 Hydrological response to climatological drought S. M. Vicente-Serrano and J. I. L ´opez-Moreno Title Page Abstract Introduction Conclusions References Tables Figures J I J I Back CloseFull Screen / Esc
Print Version Interactive Discussion
Nicholson, S. E., Tucker, C. J., and Ba, M. B.: Desertification, drought and surface vegetation: an example from the west African Sahel, Bulletin of the American Meteorological Society, 79, 815–829, 1998.
Obasi, G. O. P.: WMO‘s role in the international decade for natural disaster reduction, Bulletin of the American Meteorological Society, 75, 1655–1661, 1994.
5
Oladipo, E. O.: A comparative performance analysis of three meteorological drought indices, J. Climat., 5, 655–664, 1985.
Palmer, W. C.: Meteorological droughts, US Department of Commerce Weather Bureau Re-search Paper 45, 58, 1965.
Pausas, J. G.: Changes in fire and climate in the eastern Iberian Peninsula (Mediterranean
10
basin), Climatic Change, 63, 337–350, 2004.
Peterson, T. C. and Easterling, D. R.: Creation of homogeneous composite climatological ref-erence series, Int. J. Climatol., 14, 671–679, 1994.
Peterson, T. C., Easterling, D. R., Karl, T. R., et al.: Homogeneity adjustments of in situ atmo-spheric climate data: a review, Int. J. Climatol., 18, 1493–1517, 1998.
15
Pickup, G.: Desertification and climate change – The Australian perspective, Clim. Res., 11, 51–63, 1998.
Redmond, K. T.: The depiction of drought, Bulletin of the American Meteorological Society, 83, 1143–1147, 2002.
Soler-Sampere, M., and C. Puigdef ´abregas: Esquema litol ´ogico del Alto Aragon Occidental.
20
Pirineos, 106, 5–15, 1972. ˘
St`ıp´anek, P.: AnClim – software for time series analysis (for Windows), Dept. of Geography,
Fac. of Natural Sciences, MU, Brno, 1.47 MB, 2004.
Svoboda, M., LeCompte, D., Hayes, M., Heim, R., Gleason, K., Angel, J., Rippey, B., Tinker, R., Palecki, M., Stooksbury, D., Miskus, D., and Stephens, S.: The drought monitor, Bulletin
25
of the American Meteorological Society, 83, 1181–1190, 2002.
Szalai, S., Szinell, C. S., and Zoboki, J.: Drought monitoring in Hungary. En Early warning systems for drought preparedness and drought management, World Meteorological Organi-zation, Lisboa, 182–199, 2000.
Tsakiris, G. and Vangelis, H.: Towards a drought watch system based on spatial SPI, Water
30
Resour. Manag., 18, 1–12, 2004.
Vicente Serrano, S. M. and Beguer´ıa, S.: Estimating extreme dry-spell risk in the middle Ebro
HESSD
2, 1221–1246, 2005 Hydrological response to climatological drought S. M. Vicente-Serrano and J. I. L ´opez-Moreno Title Page Abstract Introduction Conclusions References Tables Figures J I J I Back CloseFull Screen / Esc
Print Version Interactive Discussion
Pareto distribution and Annual maxima series with a Gumbel distribution, Int. J. Climatol., 23, 1103–1118, 2003.
Vicente-Serrano, S. M., Gonz ´alez-Hidalgo, J. C., de Luis, M., and Ravent ´os, J.: Drought pat-terns in the Mediterranean area: the Valencia region (eastern Spain), Clim. Res., 26, 5–15, 2004.
5
Vicente-Serrano, S. M.: Differences in spatial patterns of drought on different time scales: an
analysis of the Iberian Peninsula, Water Resour. Manag., in press, 2005.
Wilhite D. A. and Glantz, M. H.: Understanding the drought phenomenon: the role of definitions, Water Int., 10, 111–120, 1985.
Wilhite, D. A.: Drought as a natural hazard: concepts and definitions. En Drought: a global
10
assessment, edited by: Wilhite, D., 1, 3–18, 2000.
WMO, World Meteorological Organization: Early Warning Systems for Drought Preparedness and Drought Management, Lisboa, 2000.
Wu, H., Hayes, M. J., Wilhite, D. A., and Svoboda, M. D.: The effect of the length of record on the standardized precipitation index calculation, Int. J. Climatol., 25, 505–520, 2005.
HESSD
2, 1221–1246, 2005 Hydrological response to climatological drought S. M. Vicente-Serrano and J. I. L ´opez-Moreno Title Page Abstract Introduction Conclusions References Tables Figures J I J I Back CloseFull Screen / Esc
Print Version Interactive Discussion Table 1. Correlation between the regional series and the precipitation series of the different
observatories. Observatory R-pearson Castiello 0.94 Jaca 0.93 Bernues 0.85 Arag. Puerto 0.92 Anso 0.97 Canfranc 0.92 Hecho 0.94 Yesa 0.84
HESSD
2, 1221–1246, 2005 Hydrological response to climatological drought S. M. Vicente-Serrano and J. I. L ´opez-Moreno Title Page Abstract Introduction Conclusions References Tables Figures J I J I Back CloseFull Screen / Esc
Print Version Interactive Discussion Figure 1: Location and relief of the study area and spatial distribution of observatories used
for analysis
Fig. 1. Location and relief of the study area and spatial distribution of observatories used for
HESSD
2, 1221–1246, 2005 Hydrological response to climatological drought S. M. Vicente-Serrano and J. I. L ´opez-Moreno Title Page Abstract Introduction Conclusions References Tables Figures J I J I Back CloseFull Screen / Esc
Print Version Interactive Discussion 1950 1955 1960 1965 1970 1975 1980 1985 1990 1995 2000 -3 -2 -1 0 1 2 3 1950 1955 1960 1965 1970 1975 1980 1985 1990 1995 2000 -3 -2 -1 0 1 2 3 2 months-SPI 8 months-SPI 1950 1955 1960 1965 1970 1975 1980 1985 1990 1995 2000 -3 -2 -1 0 1 2 3 1950 1955 1960 1965 1970 1975 1980 1985 1990 1995 2000 -3 -2 -1 0 1 2 3 14 months-SPI 22 months-SPI
Figure 2. Evolution of the SPI at different time scales in the whole of the study area Fig. 2. Evolution of the SPI at different time scales in the whole of the study area.
HESSD
2, 1221–1246, 2005 Hydrological response to climatological drought S. M. Vicente-Serrano and J. I. L ´opez-Moreno Title Page Abstract Introduction Conclusions References Tables Figures J I J I Back CloseFull Screen / Esc
Print Version Interactive Discussion Time scale 0 2 4 6 8 10 12 14 16 18 20 22 24 Co rrel ati o n (R) 0.0 0.2 0.4 0.6 0.8 Time scale 0 2 4 6 8 10 12 14 16 18 20 22 24 Co rrel ati o n (R) 0.0 0.2 0.4 0.6 0.8 1 2
Figure 3: Correlation between continuous standardized series of hydrological variables and the SPI at different time scales. 1- Reservoir storages, 2- River discharges.
Fig. 3. Correlation between continuous standardized series of hydrological variables and the
HESSD
2, 1221–1246, 2005 Hydrological response to climatological drought S. M. Vicente-Serrano and J. I. L ´opez-Moreno Title Page Abstract Introduction Conclusions References Tables Figures J I J I Back CloseFull Screen / Esc
Print Version Interactive Discussion
Time scales (SPI)
2 4 6 8 10 12 14 16 18 20 22 24 Oct Nov Dec Jan Feb Mar Apr May Jun Jul Aug Sep 0.3 0.3 0.3 0.3 0.3 0.3 0.3 0.3 0.3 0.3 0.4 0.4 0.4 0.4 0.4 0.4 0.5 0.5 0.5 0.5 0.5 0.4 0.4 0.4 0.4 0.4 0.3 0.3 0.3 0.3 0.4 0.4 0.4 0.3 0.3 0.5 0.5 0.5 0.4 0.4 0.3 0.3 0.6 0.6 0.6 0.5 0.5 0.5 0.7 0.7 0.3 0.4 0.5 0.4 0.6 0.5 0.4 0.7 0.8 0.4 0.3 0.7 0.8 0.3 0.4 0.5 0.6 0.7 0.8 Correl. Coef.
Figure 4. Correlation coefficients between the monthly river discharges series and the monthly SPI series at different time scales. Significant correlations (p < 0.05) correspond to R
values higher than 0.29.
Fig. 4. Correlation coefficients between the monthly river discharges series and the monthly
SPI series at different time scales. Significant correlations (p<0.05) correspond to R values
HESSD
2, 1221–1246, 2005 Hydrological response to climatological drought S. M. Vicente-Serrano and J. I. L ´opez-Moreno Title Page Abstract Introduction Conclusions References Tables Figures J I J I Back CloseFull Screen / Esc
Print Version Interactive Discussion 1950 1955 1960 1965 1970 1975 1980 1985 1990 1995 2000 -2 -1 0 1 2 3 SPI Standardised discharges
Figure 5. Interannual evolution of standardised river discharges and the SPI at the time scale
of 2 months in November.
Fig. 5. Interannual evolution of standardised river discharges and the SPI at the time scale of
HESSD
2, 1221–1246, 2005 Hydrological response to climatological drought S. M. Vicente-Serrano and J. I. L ´opez-Moreno Title Page Abstract Introduction Conclusions References Tables Figures J I J I Back CloseFull Screen / Esc
Print Version Interactive Discussion
Time scales (SPI)
2 4 6 8 10 12 14 16 18 20 22 24 Oct Nov Dec Jan Feb Mar Apr May Jun Jul Aug Sep 0.4 0.3 0.5 0.4 0.4 0.4 0.4 0.5 0.4 0.4 0.4 0.5 0.4 0.4 0.4 0.4 0.4 0.4 0.5 0.5 0.5 0.5 0.5 0.5 0.5 0.4 0.5 0.5 0.5 0.5 0.5 0.6 0.6 0.6 0.6 0.6 0.4 0.7 0.7 0.7 0.7 0.5 0.5 0.4 0.8 0.5 0.8 0.4 0.4 0.4 0.4 0.3 0.4 0.3 0.3 0.3 0.3 0.3 0.2 0.2 0.2 0.5 0.4 0.3 0.1 0.1 0.1 0.0 0.1 0.0 0.0 0.1 0.2 0.3 0.4 0.5 0.6 0.7 0.8 Correl. Coef.
Figure 6. Correlation coefficients between the reservoir storages and the monthly SPI series at different time scales. Significant correlations (p < 0.05) correspond to R values higher than
0.31.
Fig. 6. Correlation coefficients between the reservoir storages and the monthly SPI series at
HESSD
2, 1221–1246, 2005 Hydrological response to climatological drought S. M. Vicente-Serrano and J. I. L ´opez-Moreno Title Page Abstract Introduction Conclusions References Tables Figures J I J I Back CloseFull Screen / Esc
Print Version Interactive Discussion 1955 1960 1965 1970 1975 1980 1985 1990 1995 2000 -2 -1 0 1 2 SPI
Standardised water volume
Figure 7. Interannual evolution of standardised reservoir storages and the SPI at the time scale
of 7 months in December.
Fig. 7. Interannual evolution of standardised reservoir storages and the SPI at the time scale