HAL Id: hal-00329175
https://hal.archives-ouvertes.fr/hal-00329175
Submitted on 1 Jan 2001
HAL is a multi-disciplinary open access
archive for the deposit and dissemination of
sci-entific research documents, whether they are
pub-lished or not. The documents may come from
teaching and research institutions in France or
abroad, or from public or private research centers.
L’archive ouverte pluridisciplinaire HAL, est
destinée au dépôt et à la diffusion de documents
scientifiques de niveau recherche, publiés ou non,
émanant des établissements d’enseignement et de
recherche français ou étrangers, des laboratoires
publics ou privés.
isolated substorm: The pseudobreakup phase
A. G. Yahnin, V. A. Sergeev, T. Bösinger, T. I. Sergienko, I. A. Kornilov, N.
L. Borodkova, M. F. Thomsen, R. D. Belian, J.-A. Sauvaud, V. N. Lutsenko,
et al.
To cite this version:
A. G. Yahnin, V. A. Sergeev, T. Bösinger, T. I. Sergienko, I. A. Kornilov, et al..
Correlated
Interball/ground-based observations of isolated substorm: The pseudobreakup phase. Annales
Geo-physicae, European Geosciences Union, 2001, 19 (7), pp.687-698. �hal-00329175�
Correlated Interball/ground-based observations of isolated
substorm: The pseudobreakup phase
A. G. Yahnin1, V. A. Sergeev2, T. B¨osinger3, T. I. Sergienko1, I. A. Kornilov1, N. L. Borodkova4, M. F. Thomsen5, R. D.
Belian5, J.-A. Sauvaud6, V. N. Lutsenko4, and A. A. Skalsky4
1Polar Geophysical Institute, Apatity, Russia
2Institute of Physics, University of St-Petersburg, St-Petersburg, Russia 3Institute of Space Physics, University of Oulu, Oulu, Finland
4Space Research Institute, Moscow, Russia
5Los Alamos National Laboratory, Los Alamos, NM, USA 6CESR/CNRS, Toulouse, France
Received: 12 December 2000 – Revised: 2 April 2001 – Accepted: 26 April 2001
Abstract. We study the isolated substorm that occurred after
a long quiet period, which showed all of the substorm sig-natures except for the first half hour of the expansion phase, which could be characterized as a pseudobreakup sequence, rather than a full-scale substorm onset. During the consid-ered event, the substorm’s instability leads to a current dis-ruption, which starts at the near-Earth plasma sheet and then propagates tailward. Based on auroral observations, the anal-ysis of geosynchronous plasma injections, and the plasma sheet observations at ∼15 REat the meridian of auroral
sub-storm development we show that (1) before and probably during “pseudobreakup phase”, the plasma sheet stayed cold and dense, (2) during the pseudobreakup phase, particle in-jections at 6.6 RE were only seen in unusually low energy
components, and (3) the electron precipitation into the iono-sphere was very soft. We conclude that the basic differ-ence between pseudobreakups and “real” substorm activa-tions was found in the low energy of all manifestaactiva-tions. We suggest that high density and low electron temperature in the plasma sheet are the reasons for low energization in the magnetic reconnection operated on closed field lines in the plasma sheet, as well as the weak field-aligned acceleration, as predicted by the Knight’s relationship. The low Hall con-ductivity could then be the reason for the weak ground mag-netic effects observed. This explanation suggests that the role of the ionospheric conductivity is “passive” as the plasma sheet, rather than the ionosphere, controls the development of the magnetospheric instability.
Key words. Ionosphere (particle precipitation) – Magneto-Correspondence to: A. G. Yahnin
spheric physics (auroral phenomena; plasma sheet)
1 Introduction
A typical substorm consists of a growth phase, multiple on-sets forming the expansive phase, and a poleward leap (e.g. McPherron et al., 1973; Pytte et al., 1976, 1978; Hones, 1979; Rostoker et al., 1980). The ground-based and mag-netospheric signatures of these phases are:
•Quiet auroral arcs move towards the equator during the growth phase; the auroral breakups, occurring at different longitudes and latitudes, form the multiple onsets, and a strong poleward expansion in a wide longitudinal sector oc-curs during the poleward leap phase;
•Sharp negative magnetic bays, and Pi2 and PiB pulsa-tions occur in the auroral zone during the expansive phase, and the disturbance shifts to higher latitudes during the pole-ward leap;
•In the mid-tail (15–20 RE), the impulsive plasma sheet
thinning is associated with the expansive phase onset, and the plasma sheet expansion is associated with the poleward leap of the auroras;
•During a geosynchronous orbit, energetic particle injec-tions and magnetic field dipolarizainjec-tions are observed at the expansive phase onset and during substorm activations.
The most spectacular auroral signature of the substorm is the auroral breakup which is a strong brightening of the pre-exiting homogeneous auroral arc, which breaks into sep-arate rays and fragments. Another class of disturbances, the “pseudobreakups”, is also frequent in the auroral zone. Aka-sofu (1964) used this term to distinguish those auroral arc
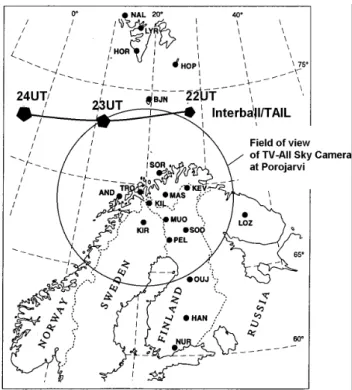
Fig. 1. Map presenting the ground IMAGE network and
field-of-view of the auroral TV camera in Porojarvi (GLat. = 69.17, GLong. = 21.47). Trace of the INTERBALL-1 footprint during the interval 22–24 UT on 16 November 1995 is also shown. Mapping has been done using the model by Tsyganenko (T98, Kp = 1).
flares, which did not follow the auroral expansion and were not associated with significant magnetic disturbances. Today this term is often used in that sense as well (e.g. Pulkkinen, 1996). Typically, pseudobreakups are localized (McPherron, 1991; Nakamura et al., 1994), but Koskinen et al. (1993) presented an example of a longitudinally extended event.
The question disputed is: Do pseudobreakups differ from the substorm breakups in their physical mechanism? Al-though the above mentioned differences between pseudo-breakups and “real” pseudo-breakups are sometimes strongly pro-nounced, the similarity of ground-based signatures was also noted. Yahnin et al. (1984) noted that even during very lo-calized auroral activations, the sensitive magnetometers were able to register weak Pi2 pulsations. The PiB and Pi2 pul-sations were found during the pseudobreakup events stud-ied, for example, by Koskinen et al. (1993) and Aikio et al. (1999).
Sergeev et al. (1986) postulated that localized auroral arc flares with a low repetition rate are pseudobreakups (they do not produce a significant magnetic effect and occur dur-ing calm or growth phase conditions), but the flares grouped into the sequence with a repetition rate of one per 1–3 min-utes form the “real substorm” activations. It was suggested (e.g. Koskinen et al., 1993, Ohtani et al., 1993) that the iono-sphere plays an important role, and the formation of the au-roral bulge and the ground magnetic effects depends on iono-spheric conductivity.
This paper is devoted to the further investigation of pseu-dobreakup and substorm similarities and differences. The study is based on the large set of ground-based and satel-lite observations, which allows one to probe the plasma sheet population in two regions (at geosynchronous orbit and mid-tail), as well as to estimate the characteristics of the electron flux precipitating into the ionosphere. In Sect. 2, we give a general description of the observations on the ground and in the magnetosphere during the pseudobreakup/substorm event on 16 November 1995. Sections 3 and 4 present the data in detail. In Sect. 5, we discuss the obtained results, and in Sect. 6, the summary and conclusions are given.
2 Observations
A very isolated substorm (it had been preceded by several hours of geomagnetic calmness) occurred at 22–24 UT on 16 November 1995. At that time, the ground-based observa-tional campaign related to the Interball satellite mission was in progress. A general description of the geophysical situa-tion during this substorm has been published by Sergeev et al. (1996a, 1999).
During this substorm, the Interball-1 satellite made the measurements in the nightside magnetosphere (X =
−15.0RE, Y = −3.7RE, Z = −1.8RE) in the
lon-gitudinal sector of the intense ground-based observations (Fig. 1). In this study, we present observations by CORALL, ELECTRON, DOK-2 and MIF-M experiments onboard the Interball-1 spacecraft. CORALL is the nearly-hemispheric electrostatic analyzer which measured the ions with ener-gies 0.3–24 keV/q (Yermolaev et al., 1997). ELECTRON (Sauvaud et al., 1997) is a “top-hat” quadri-spherical elec-tron spectrometer that uses the microchannel plates to mea-sure the electrons with energies ranging from 0.01 to 26 keV. The DOK-2 spectrometer (Lutsenko et al., 1998) measures the energy spectra of electrons and ions using four telescopes with solid-state silicon detectors. The energy ranges are: 20– 850 keV for ions and 25–400 keV for electrons. Fluxgate magnetometer MIF-M provides three component measure-ments of the magnetic field (Klimov et al., 1997).
Four LANL geosynchronous satellites 1990–095, 1987– 097, 1991–080, and 1994–084 monitored the charged parti-cles at 19.5, 22.0, 02.6, and 04.9 MLT (the MLT is given for 22 UT). They (except the satellite 1987–097) were equipped with two sets of sensors: the MPA instrument (Bame et al., 1993; McComas et al., 1993) measured particles from some eV up to 40 keV, and the SOPA instrument (Belian et al., 1992) measured particles with energies more than 50 keV (unfortunately, the SOPA energetic proton data were unavail-able for this case at satellite 1990–095). The satellite 1987– 097 carried the CPA instrument measuring the >30 keV elec-trons and >80 keV protons (Higbie et al., 1978).
The ground network used consisted of IMAGE magne-tometers (Viljanen and Hakkinen, 1997), a Finnish chain of pulsation magnetometers, four auroral TV all-sky cameras of Polar Geophysical Institute (PGI), which were situated
Fig. 2. Keogram of auroras observed from Porojarvi. The interval 2307–2336 UT when a series of auroral activations without strong
poleward expansions has been observed is marked as “pseudobreakup phase”.
in Scandinavia (Kiruna, Kilpisjarvi, Porojarvi) and on Kola Peninsula (Lovozero), and the four-channel meridian scan-ning photometer of PGI operated in Kiruna.
3 Ground-based data
Using ground-based magnetic data, Sergeev et al. (1996a, 1999) concluded that the growth phase of this substorm star-ted at around 2220 UT. At that time, a SI-like disturbance in the ground magnetic field had been registered. Simulta-neously, the polar cap index (PC-index) characterizing the intensity of convection started to increase. Such an increase is usually associated with the southward turning of the in-terplanetary magnetic field (this could not be confirmed by the IMF data because they were fragmentary for the time of interest).
The aurora dynamics is illustrated by Fig. 2, which presents a keogram of the auroral TV camera in Porojarvi. The quiet auroral arc moving to the south was registered from 2220 UT until 2307 UT, when the first auroral activation occurred. Between 2307 and 2336 UT, several auroral activations were seen, but they were not followed by any strong and fast pole-ward expansion. Such an expansion took place only after 2336–37 UT, when a new arc appeared poleward of the pre-existing auroras and formed the WTS-like structure west-ward of the meridian of Porojarvi.
The data of the scanning photometer in Kiruna (Fig. 3) show the intensity of the 427.8 and 630.0 nm emissions; here the altitude for the emissions 427.8 and 630.0 nm was taken to be 100 and 180 km, respectively. Before 2307 UT, smooth variations of the luminosity were due to the southward drift of the quiet auroral arc. Sharp spikes accompanied the au-roral flares after 2307 UT. It is clear from Fig. 3 that the averaged I427.7/I630.0ratio, which depends on the hardness
of the energetic spectrum of precipitating electrons, is less for the time interval 2307–2336 UT than for the time after 2336 UT. As seen from the IMAGE data (Fig. 4), before 2307 UT, a weak westward electrojet developed over Scandi-navia. Between 2307 and 2336 UT, weak fluctuations associ-ated with the auroral activations disturbed a smooth increase
Fig. 3. Intensity of emissions 427.8 and 630.0 nm obtained by the
meridian scanning photometer in Kiruna. The emission variations are shown at different distances from Kiruna, assuming the altitude of luminosity as 100 and 180 km for emission 427.8 nm and 630.0 nm, respectively.
of the electrojet. Magnetic field variations exceeding ∼100 nT started only after 2336 UT, simultaneously with the pole-ward leap of the electrojet. At the same time, a magnetic bay developed in a wide longitudinal sector, as evidenced by the magnetograms from the Siberian and Iceland stations (data not shown).
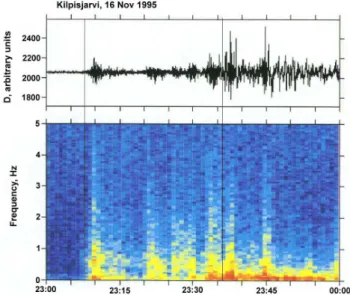
Auroral activations were accompanied by several clear PiB bursts starting at 2307 UT (Fig. 5). The strongest bursts were detected after 2336 UT, although the intensity of the
pulsa-Fig. 4. Magnetograms of the IMAGE stations. Vertical lines mark
the interval 2307–2336 UT.
tions in the bursts did not differ dramatically.
There was no riometer absorption registered at the Finnish riometer meridional chain, except for a weak absorption bay during the last 15 minutes of the day (J. Manninen, Sodankyla Geophysical Observatory, private communication).
4 Satellite data
4.1 Interball-1
During the time interval of interest, the Interball-1 spacecraft was in the mid-tail in the longitudinal sector of the auroral ac-tivations detected from the ground. Both low-energy particle instruments CORALL and ELECTRON registered a rather cold (Te ≈ 0.2–0.4 keV, Ti ≈1–2 keV) and dense (n ≈
1 cm−3) plasma sheet population (β = P
thermal/Pmagnetic>
1) before the substorm. These data, along with simultane-ous measurements onboard the Geotail spacecraft, are pub-lished by Sergeev et al. (1999). The plasma density and temperature measured by Geotail in the central plasma sheet at (X = −22.0, Y = 2.6, Z = −2.7) were almost the same as the measured by Interball-1.
Figure 6 shows the electron flux measured by the ELEC-TRON instrument along with magnetic field data obtained by MIF-M (here the data with time resolution of ∼1 s were
Fig. 5. PiB pulsations registered at Kilpisjarvi: wave-form is shown
at the top, and dynamic spectrum is shown at the bottom. Vertical lines mark the interval 2307–2336 UT.
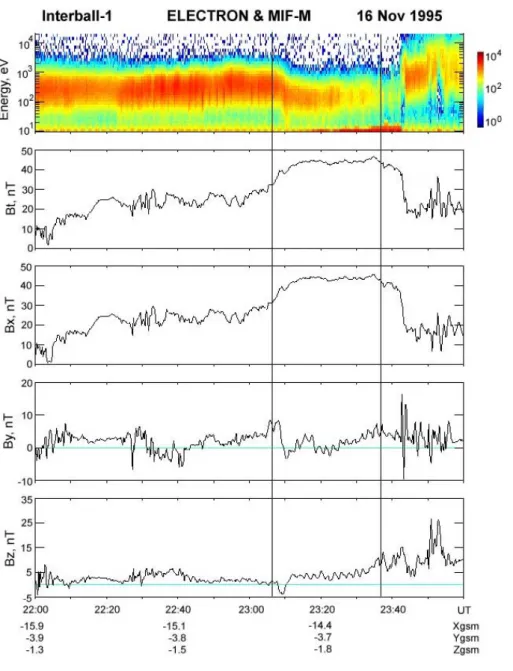
used). A sharp decrease in particle energy and an increase in the Bx-component of the magnetic field, up to some 40
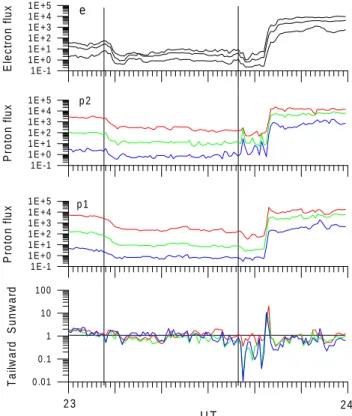
nT, had been detected around 2307 UT, which is in agree-ment with the first auroral and PiB activations. Such be-haviour of the plasma and magnetic field is expected dur-ing the plasma sheet thinndur-ing. Energetic particle fluxes mea-sured by the DOK-2 instrument also dropped sharply around 2307 UT (Fig. 7). One more severe plasma sheet depletion (which we also could interpret as plasma sheet thinning) oc-curred at 2337 UT, when the plasma sheet disappeared at the Interball-1 location. During this thinning the magnetic field magnitude decreased. During most of the time between 2307 and 2337 UT, the satellite was in the outer part of the plasma sheet rather than in the plasma sheet boundary layer (PSBL). In this region, characterized by β = 0.1 − 0.2 (see Fig. 8), no typical PSBL fast plasma flows were detected, and both density and temperature changed smoothly (data not shown). Around 2342 UT, a sharp increase of particle flux occurred simultaneously with a strong decrease in the magnetic field, indicating the plasma sheet expansion. The spacecraft en-tered the central plasma sheet (β > 1), where the measured electrons energized up to ∼10 times in comparison with those detected before 2307 UT (Fig. 6). In Fig. 7, the “streaming index” which is the ratio of the energetic proton flux stream-ing Earthward to the energetic proton flux streamstream-ing tailward is also presented. The strongest plasma anisotropy was found at 2337 UT (tailward flux dominate), and at 2342 UT, the fluxes sharply changed their direction to Earthward.
Both plasma and magnetic data with 2-minute averaging were used to calculate the total (magnetic plus plasma) pres-sure at the Interball-1 position (Fig. 8). The square root of the total pressure is proportional to the lobe magnetic field and the total plasma sheet current. A general increase in the total pressure after ∼2220 UT stopped at around 2307 UT.
Fig. 6. Combined ELECTRON and MIF-M data from INTERBALL-1 for interval 22–24 UT on 16 November 1995. From top to bottom: electron flux observed by the sunward looking detec-tor, total magnetic field magnitude, BX,
BY, and BZ-component of the
mag-netic field. Vertical lines mark the in-terval 2307–2336 UT.
A strong reduction of the total pressure and tail current oc-curred at 2336 UT.
4.2 Geosynchronous satellites
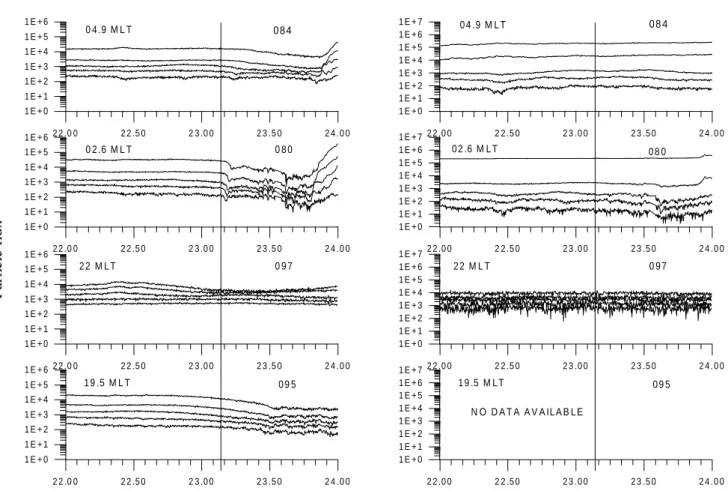
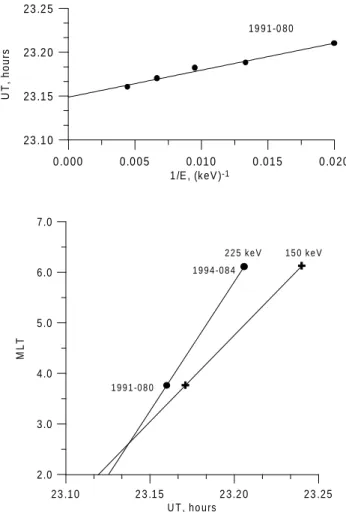
The energetic particle data from four geosynchronous LANL satellites are shown in Fig 9. Although the substorm-like injections were absent, these data show some substorm sig-natures. For instance, after the first auroral activation onset, the satellites 1991–080 and 1994–084 in the morning sector observed the “Drifting Electron Hole” (DEH), which is a re-mote signature of magnetic field dipolarization westward of the satellite (Sergeev et al., 1992). The DEH at the satel-lite 1991–080 has a very distinct dispersion that enables us to estimate the time of dipolarization onset to be 2309 UT (Fig. 10a). Tracing back (in coordinates UT-MLT) the DEHs seen at different locations and different energies gives us the
time of dipolarization to be 2308:15 UT (Fig. 10b). Both es-timates are close to the first pseudobreakup onset. Figure 10b can also be used to locate the eastern edge of the dipolariza-tion region at 2.5 MLT.
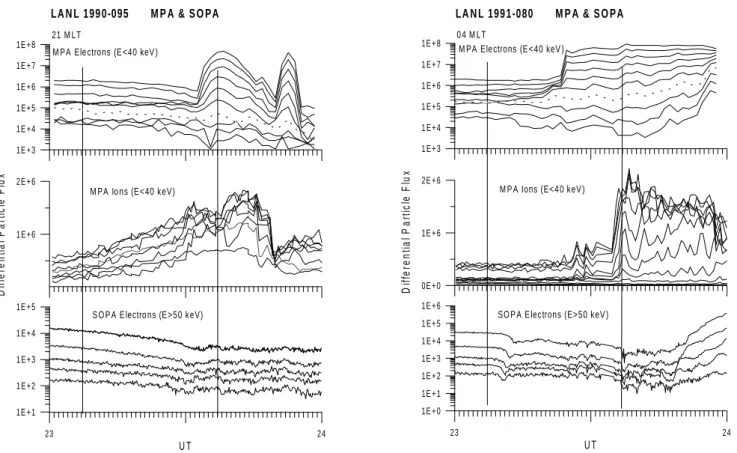
Injection of energetic electrons has been detected at geo-synchronous orbit only after 2345 UT. However, before this time, the injection-like enhancements were observed in the low-energy component measured by the MPA instrument (Figs. 11a and 11b). In the morning sector, 3–4 weak proton enhancements were seen at the 1990–080 spacecraft between 2320 and 2330 UT, in association with small energetic elec-tron flux depletions detected by SOPA, which could be the diamagnetic effect. As for electron enhancements, the first one was very weak and, evidently, it was a low-energy coun-terpart of the above-described DEH. Coexistence of such a dispersed low-energy injection and a high-energy depletion is an intrinsic feature of the DEH phenomena (Sergeev et al.,
1 E -1 1 E + 0 1 E + 1 1 E + 2 1 E + 3 1 E + 4 1 E + 5 P rot on f lux 1 E -1 1 E + 0 1 E + 1 1 E + 2 1 E + 3 1 E + 4 1 E + 5 P rot on f lu x 0 .01 0.1 1 10 100 Tai lw ar d S u nw ar d p 1 p 2 1 E -1 1 E + 0 1 E + 1 1 E + 2 1 E + 3 1 E + 4 1 E + 5 E lect ron f lux e 2 3 24 U T
Fig. 7. INTERBALL-1 energetic particle measurements during the
event. From top to bottom: fluxes of electrons with energy E = 28–32, 44–53, and 79–98 keV; fluxes of protons with energy E = 22–29, 47–61, and 102–133 keV measured by the detector looking sunward, fluxes of protons with energy E = 21–28, 46–60, 102–133 keV measured by the detector looking tailward, and the “streaming index” of energetic protons. Vertical lines mark the interval 2307– 2336 UT.
1992). Typically, the threshold between the DEH-related in-jections and depletions lies in the range of the SOPA instru-ment (E > 50 keV). This and some following enhanceinstru-ments were seen only at energies E < 10 keV.
Westward from the substorm region, the satellites 1990– 095 and 1987–097 detected very little changes in the en-ergetic particle data (Fig. 8). But the MPA instrument on-board 1990–095 detected a smooth increase in the flux of the plasma sheet protons (Fig. 11b). Some proton injection-like enhancements could be discerned in MPA data after 2330 UT; they were also accompanied by depletions in the ener-getic electron fluxes.
5 Discussion
5.1 Pseudobreakup phase (2307–2336 UT)
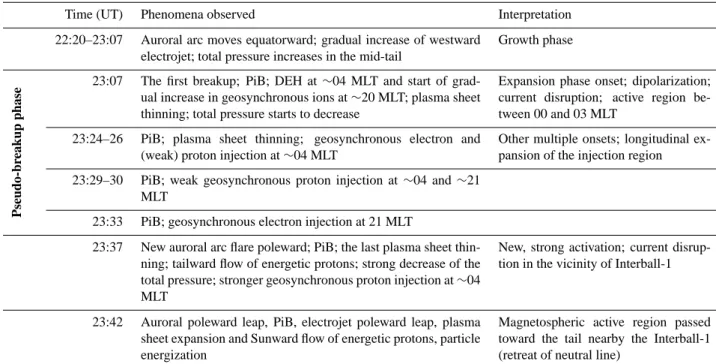
The timeline of the considered event is presented in Table 1. There is no doubt that the event is a substorm. Indeed, a se-quence of the equatorward drift of the auroral arc, the breakup of this arc at 2307 UT, followed by a series of activations (multiple onsets), and the strong poleward expansion are
typ-0 .typ-0 typ-0 0 .4 0 0 .8 0 P res s u re , nP a 2 2 2 3 24 U T 0 .0 3 0 .0 4 0 .0 5 0 .0 6 0 .0 7 0 .0 8 Cr o s s T a il Cu rr e n t, A /m 2 0 3 0 4 0 5 0 Blo be , n T
Fig. 8. At the bottom: behaviour of the magnetic and plasma
pres-sure during the considered substorm. Crosses correspond to elec-tron pressure, line with points to proton pressure, line with squares to magnetic pressure, and thick line is total pressure. At the top: variations of the cross-tail current intensity and magnetic field in the tail lobe deduced from total pressure. Vertical lines mark the interval 2307–2336 UT.
ical for the growth and expansion phases of an auroral sub-storm. This phase categorization agrees with the other ob-servations listed in Sects. 3 and 4. For example, the growth phase is confirmed by the increase in total pressure (tail cur-rent) before 2307 UT. The onset of the expansion phase is consistent with the signatures of the current disruption, the plasma sheet thinning at a distance of ∼15 RE, and the DEH
observation in the near-Earth magnetosphere, which suggests dipolarization. Such dipolarization in the near-Earth tail lo-cation, as well as the plasma sheet thinning in the mid-tail, are basic substorm signatures (e.g. Hones, 1979; Lui, 1991). Plasma sheet expansion in the mid-tail during the poleward expansion (leap) of the auroras is also a well-known phe-nomenon (Pytte et al., 1978; Hones, 1979).
However, the considered event differs from the typical storm. The expansion phase onset as well as a few sub-sequent activations were not associated with the significant ground magnetic field variations (Fig. 5) and the fast pole-ward propagation of the auroras (Fig. 2). The first significant (>100 nT) magnetic disturbance started after 2337 UT when the new poleward arc appeared, thus starting the poleward expansion. Thus, the initial multiple onset stage manifested itself as a series of pseudobreakups. We call this interval a “pseudobreakup phase” in Table 1. The pseudobreakups differ from each other in their localization. The first onset seems to be very localized. The auroral image obtained from the DMSP photometer data, soon after the first auroral acti-vation around 2320 UT, does not show any surge-like
struc-2 struc-2 .0 0 2 2 .5 0 2 3 .0 0 2 3 .5 0 2 4 .0 0 1 E + 0 1 E + 1 1 E + 2 1 E + 3 1 E + 4 1 E + 5 1 E + 6 2 2 .0 0 2 2 .5 0 2 3 .0 0 2 3 .5 0 2 4 .0 0 1 E + 0 1 E + 1 1 E + 2 1 E + 3 1 E + 4 1 E + 5 1 E + 6 2 2 .0 0 2 2 .5 0 2 3 .0 0 2 3 .5 0 2 4 .0 0 1 E + 0 1 E + 1 1 E + 2 1 E + 3 1 E + 4 1 E + 5 1 E + 6 2 2 .0 0 2 2 .5 0 2 3 .0 0 2 3 .5 0 2 4 .0 0 1 E + 0 1 E + 1 1 E + 2 1 E + 3 1 E + 4 1 E + 5 1 E + 6 0 9 5 0 9 7 0 8 0 0 8 4 0 4 .9 M L T 0 2 .6 M L T 2 2 M L T 1 9 .5 M L T 2 2 .0 0 2 2 .5 0 2 3 .0 0 2 3 .5 0 2 4 .0 0 1 E + 0 1 E + 1 1 E + 2 1 E + 3 1 E + 4 1 E + 5 1 E + 6 1 E + 7 2 2 .0 0 2 2 .5 0 2 3 .0 0 2 3 .5 0 2 4 .0 0 1 E + 0 1 E + 1 1 E + 2 1 E + 3 1 E + 4 1 E + 5 1 E + 6 1 E + 7 2 2 .0 0 2 2 .5 0 2 3 .0 0 2 3 .5 0 2 4 .0 0 1 E + 0 1 E + 1 1 E + 2 1 E + 3 1 E + 4 1 E + 5 1 E + 6 1 E + 7 2 2 .0 0 2 2 .5 0 2 3 .0 0 2 3 .5 0 2 4 .0 0 1 E + 0 1 E + 1 1 E + 2 1 E + 3 1 E + 4 1 E + 5 1 E + 6 1 E + 7 0 9 5 0 9 7 0 8 0 0 8 4 0 4 .9 M L T 0 2 .6 M L T 2 2 M L T 1 9 .5 M L T N O D A T A A V A IL A B L E
Pa
rt
ic
le
f
lu
x
Fig. 9. Top-to-bottom: energetic particle data from LANL satellites 084, 080, 097, and 095. Electron data are presented on the left, proton
data are on the right. Presented data show the electron flux with energy E > 30, 45, 65, 95, and 140 keV for spacecraft 097, and with energy
E= 50–74, 74–110, 110–160, 160–240, and 240–340 keV for other spacecraft. Proton channels are >80, 90, 110, 135, 175 and 50–76, 76–113, 113–172, 172–260, 260–500 keV, respectively. The MLTs of spacecraft for 22 UT are shown in each panel on the left. Substorm onset is marked by vertical line. (Note that UT is in decimal units).
tures further to the west of the Iceland meridian, MLT = 23 (the data are available on the web via the SPIDR system – not shown). The eastward edge of the active region is estimated to be at MLT = 2.5–3.0 based on DEH dispersion analysis (Fig. 10). Some of the latest pseudobreakups spread up to MLT = 21 and MLT = 04, according to the low energy par-ticle injections observed there by the geosynchronous satel-lites (Figs. 11a and 11b).
5.2 Possible interpretation of the mid-tail dynamics The available data do not directly support any specific mech-anism of a substorm. We suppose, however, that the Near-Earth Neutral Line (NENL) model (Hones, 1979) provides a framework for interpreting the mid-tail plasma sheet dynam-ics. According to this model, a substorm starts with a recon-nection process in the NENL location. The reconrecon-nection pro-duces the Earthward and tailward plasma flows; dipolariza-tion occurs Earthward of the NENL, while the plasma sheet thinning occurs tailward of the NENL. The reconnection that starts on closed field lines forms the plasmoid, which is
ejec-ted to the tail.
The Interball-1 spacecraft was in the longitudinal sector of the substorm during the onset at 2307 UT. It registered neither Earthward plasma flows nor magnetic field dipolar-ization, expected in the case of the tailward source location. Partial plasma sheet thinning, however, was observed. We interpret this as the result of a magnetic reconnection oper-ating at X > −15RE within the closed plasma sheet flux
tubes. In such a case, the satellite at the plasma sheet periph-ery might be unable to detect the tailward moving plasmoid. Most probably, in our case, the reconnection region remained at X > −15RE during the pseudobreakup phase. The total
pressure slightly decreased due to the current disruption in the NENL vicinity.
The strong activation at 2336–37 UT when the new arc ap-peared poleward has a remarkable difference. At this time, the new complete plasma dropout occurred, but in contrast to the previous one (at 2307 UT), the magnetic field strength at the Interball-1 location decreased (Fig. 6). The total pressure also sharply decreased (Fig. 8). At the same time, the first signatures of the tailward anisotropy of the energetic
pro-0 .pro-0 pro-0pro-0 0.0 0 5 0.01 0 0 .01 5 0 .0 20 1 /E , (k eV )-1 23 .1 0 23 .1 5 23 .2 0 23 .2 5 U T , hour s 1 9 9 1 -0 8 0 23 .10 2 3 .1 5 2 3.2 0 23 .25 U T , ho urs 2.0 3.0 4.0 5.0 6.0 7.0 ML T 1 9 9 1 -0 8 0 1 9 9 4 -0 8 4 2 2 5 k e V 1 5 0 k e V
Fig. 10. Estimates of the time and location of dipolarisation on
geosynchronous orbit. At the top: determination of the onset of dipolarisation using the DEH energy dispersion observed onboard the satellite 1991–080. At the bottom: location and time of the dipo-larisation inferred from the particle drift analysis on two satellites 1991–080 and 1994–084. (Note that UT is in decimal units).
tons had been detected at the plasma sheet/tail lobe bound-ary. These observations are consistent with a strong recon-nection on open field lines occurred close to Interball-1, but still Earthward from it. Together with ground-based signa-tures (step-like poleward expansion of auroras via new arc formation), this suggests a reappearance of the active region further tailward in the magnetosphere. Then, around 2342 UT, the active region shifted further to the tail. This is con-firmed by the observed plasma sheet expansion, the dipolar-ization of the magnetic field, and the Earthward anisotropy of the energetic protons. The Earthward particle burst was rather short; this can be explained by the flow concentration near the plasma sheet boundary.
5.3 Particle energization
Below we show that the pseudobreakup phase differs from the following activations in the particle energy in the mid-tail, at the geosynchronous orbit, and in the precipitation. Some information on the auroral electron precipitation can
be obtained from ground-based photometer measurements. Using the auroral electron transport model by Sergienko and Ivanov (1993), together with the auroral “red line” (630.0 nm) model by Solomon et al. (1988), the dependence of the emission intensity ratio I630.0/I427.8 on the electron
charac-teristic energy, as well as the dependence of the 427.8 nm emission intensity on the electron energy flux has been cal-culated. These results and the measurements of the “red” (630.0 nm) and “blue” (427.8 nm) emissions shown in Fig. 3 were used to estimate the parameters of the auroral electron flux. To avoid the errors related to the ignorance of the real altitude of different emissions, the calculation was done for the zenith of Kiruna. The calculated parameters (character-istic energy and energy flux, Fig. 12, top panel) were used as input to make an estimate of the ionospheric conductiv-ity variations (Fig. 12, middle panel). According to these calculations, both the characteristic energy of precipitating electrons and ionospheric conductivity were low during the pseudobreakup phase, although the electron energy flux was strong enough (>1 erg cm−2s−1) to produce the bright vis-ible aurora. In contrast, all values increased rapidly after 2337 UT. Magnetic disturbance on the ground is proportional to the ionospheric current and, therefore, proportional to the conductivity. In Fig. 12 (bottom), we present the magnetic variations registered in Muonio (the IMAGE station closest to Kiruna) to show good correlation between the observed magnetic variations and calculated conductivity.
Although during the pseudobreakup phase the Interball-1 was in the longitudinal sector of auroral activations, it did not observe any signatures of plasma energization. This might be due to two reasons. First, the energization was localized, and the satellite which was located in the outer plasma sheet was not in a favorable position to monitor the region of energiza-tion. Second, the energization was weak. Indirect confirma-tion of the second possibility comes from the ground optical data. Indeed, as discussed above, photometer data indicate the increased precipitating electron energy (E > 1 keV) af-ter 2337 UT (Fig. 12). During the inaf-terval 2337–2342 UT, the satellite was at the plasma sheet/tail lobe boundary, but when the satellite moved inside the expanding plasma sheet (dipolarization region), it measured an electron temperature increase up to >1 keV. Such correlation suggests that the low (<1 keV) energy of precipitating electrons during the pseu-dobreakup phase may correspond to the low energy in the plasma sheet. Thus, we do not expect that during the pseu-dobreakup phase the electron temperature would increased significantly, in comparison to the electron temperature be-fore the first plasma sheet thinning (0.2–0.4 keV). Note that during the pseudobreakup phase, the Geotail spacecraft did not detect any significant changes in the plasma sheet param-eters. This might be because the spacecraft was outside the substorm activation region (Sergeev et al., 1999).
Very weak energization of plasma during the pseudobreak-up phase is also evident by particle measurements onboard the LANL satellites. During strong substorms, the DEH phe-nomenon (drift-dispersed depletion of fluxes at high ener-gies) is usually observed together with the injection of
elec-23 24 U T 1E +0 1E +1 1E +2 1E +3 1 E+4 1 E+5 1E +6 0E +0 1E +6 2E +6 D if fer en ti al P a rt ic le F lux 1 E+3 1 E+4 1 E+5 1 E+6 1 E+7 1E +8
M PA Ele ctrons (E <40 keV ) 0 4 M LT
M P A Ions (E<4 0 keV )
SO P A E lectrons (E>50 keV )
23 24 U T 1E +1 1 E+2 1 E+3 1 E+4 1E +5 1 E+6 2E +6 D if fe re n tia l P a rt ic le F lu x S O P A E lectro ns (E >50 keV) M PA Io ns (E <40 keV) 1E +3 1E +4 1 E+5 1E +6 1E +7 1E +8
M PA Ele ctrons (E <40 keV ) 21 M LT
Fig. 11. Combined data from MPA and SOPA instruments onboard the satellite 1991–080 situated in the morning sector (a) and 1990–095
in the evening sector (b). Here, the MPA electron data are presented for 10 energy channels from 2 to 24 keV; the MPA proton data are presented for 8 channel from 2 to 13 keV. Dashed lines on the MPA electron plots represent the intensity of ∼10 keV electrons. Vertical lines mark the interval 2307–2336 UT.
trons in the lower energy channels of the SOPA instrument (50–100 keV). The threshold energy between DEH and the injections depends on the radial gradient of the background electron population and on the hardness of the energy spec-trum of the injected electrons (Sergeev et al., 1992). In our case, the signatures of the DEH is found even in the MPA (low-energy) electron data (Fig. 11b) with threshold energy as low as 10 keV. Indeed, the SOPA instrument detects the DEH in all energy channels. The dispersed electron flux de-crease is also seen in the higher energy channels of the MPA instrument (E > 10 keV). In contrast, at energies E < 10 keV, one can see a weak enhancement of the electron flux beginning at 2320 UT, which is in agreement with the DEH dispersion.
In the evening sector, the electron injection was also ob-served at energies less than 10 keV at the late stage of the pseudobreakup phase (Fig. 11a). The low-energy electron and proton enhancements seen in the MPA data in Fig. 11 are a result of the sudden arrival of the accelerated plasma sheet population associated with the inductive electric field and magnetic field dipolarization (e.g. Birn et al., 1997). Indeed, before the substorm activation, the geosynchronous space-craft measured clear signatures of plasmaspheric (<10 eV) ion refilling (data not shown), which disappeared during the plasma sheet particle enhancement. The near-Earth plasma
sheet electron temperature deduced from the MPA measure-ments was <0.5 keV during the pseudobreakup phase, and it increased up to 0.7–1.5 keV after 2337 UT. The high-energy (tens keV) electron injection has been detected at geosyn-chronous orbit only after 2345 UT (Fig. 11b), which is in agreement with the mid-tail energization signatures and those revealed from the ground-based optical measurements.
Hence, the observations indicate that during the pseudo-breakups, the source of the precipitation (plasma sheet) re-mained, consisting of cold and dense plasma, and the soft electron precipitation, i.e. no significant field-aligned ac-celeration, was observed. We suggest two ways how the plasma sheet parameters can influence the electron energiza-tion and precipitaenergiza-tion. First is the magnetic reconnecenergiza-tion pro-cess while it is operating on closed field lines of the plasma sheet. As discussed by Sergeev et al. (1996b), dense plasma depresses both the reconnection rate and the energy gain per particle, which is given as 1W ∼ B2N−1, where B is the magnetic field in the tail lobe and N is the plasma density in the inflow region. A stronger energization, as well as a faster reconnection rate, is expected when reconnection starts to in-volve open field lines (and low-density plasma). In the re-connection models of the substorm, the neutral line is associ-ated with the poleward edge of auroral bulge (e.g. Pudovkin et al., 1991). As the reconnection rate is proportional to
Table 1. Event timing in terms of substorm development.
Time (UT) Phenomena observed Interpretation
22:20–23:07 Auroral arc moves equatorward; gradual increase of westward electrojet; total pressure increases in the mid-tail
Growth phase P seud o-br ea kup p hase
23:07 The first breakup; PiB; DEH at ∼04 MLT and start of grad-ual increase in geosynchronous ions at ∼20 MLT; plasma sheet thinning; total pressure starts to decrease
Expansion phase onset; dipolarization; current disruption; active region be-tween 00 and 03 MLT
23:24–26 PiB; plasma sheet thinning; geosynchronous electron and (weak) proton injection at ∼04 MLT
Other multiple onsets; longitudinal ex-pansion of the injection region 23:29–30 PiB; weak geosynchronous proton injection at ∼04 and ∼21
MLT
23:33 PiB; geosynchronous electron injection at 21 MLT
23:37 New auroral arc flare poleward; PiB; the last plasma sheet thin-ning; tailward flow of energetic protons; strong decrease of the total pressure; stronger geosynchronous proton injection at ∼04 MLT
New, strong activation; current disrup-tion in the vicinity of Interball-1
23:42 Auroral poleward leap, PiB, electrojet poleward leap, plasma sheet expansion and Sunward flow of energetic protons, particle energization
Magnetospheric active region passed toward the tail nearby the Interball-1 (retreat of neutral line)
the velocity of the poleward propagation of auroras, a dense plasma sheet results in the slow and limited poleward motion, whereas low density favors the fast auroral expansion.
A second mechanism is related to the fact that bright auro-ral structures are produced by the field-aligned accelerated electrons. The acceleration is thought to be necessary to support the field-aligned currents in the loss-cone portion of the electron distribution function. According to the Knight relationship (Knight, 1973; see, also, Lyons and Williams, 1984), the field-aligned potential drop (18) required to sup-port the field-aligned current is prosup-portional to Te1/2Ne−1.
Therefore, low Te and large Ne in the plasma sheet during
the pseudobreakup phase suggest a low 18 and a soft en-ergy spectra of the precipitating electrons.
The large plasma density also secures the substantial en-ergy flux of precipitating electrons and, therefore, bright au-roras while the electron energy could be low. The soft spectra of precipitating electrons are responsible for the low level of the ionospheric conductivity and, as result, the weak iono-spheric current and ground magnetic disturbances. In turn, the increase in the energy of precipitating electrons results in the increase in 6H and 6H/6P and, consequently, the
increase in 6C(Cowling conductivity), which causes the
en-hancement of the electrojet.
Terasawa et al. (1997) and Fujimoto et al. (1998) have shown that cold and dense plasma populates the plasma sheet after intervals of northward interplanetary magnetic field, i.e. quiet geomagnetic conditions. This suggests that well isolated substorms which occurred after long calm inter-vals should start with the “pseudobreakup phase” (auroral breakups without significant magnetic disturbances on the
ground). In contrast, the substorm expansion onset which occurred after short quiet intervals or during disturbed con-ditions should also have classical signatures in the magnetic data, i.e. a sharp and strong magnetic bay.
5.4 Comparison with previous observations
Our findings are in agreement with some previous studies of the substorm onset. For example, Sergeev and Yahnin (1979b) have found that initial activations in the course of the two isolated substorms were localized; they did not exhibit strong expansions and had a weak ground magnetic effect. Using the data from several all-sky cameras they made a tri-angulation of auroras and found that the altitude of bright au-roras was about 140 km. This means that these auau-roras were produced by low-energy electron precipitation. Mende and Eather (1976) have noted that the “green” aurora breakups are often preceded by “red” subvisual breakups. This also suggests that the spectra of precipitating electrons are soft at the beginning and become harder during the course of the expansive phase development. Rostoker (1968) concluded that the large negative excursion of the H -component of the magnetic field often follows the weak magnetic disturbance (so-called “trigger bay”). He also noted that the “trigger bay” might be accompanied by the same magnetotail signatures as a typical substorm onset. Nakamura et al. (1994) considered the pseudobreakups as a precursor of the major substorm ex-pansion. Aikio et al. (1999) defined pseudobreakups as ac-tivations with limited (<2 degree) latitudinal auroral expan-sion. Although this definition differs from that used in our paper and some of their “pseudobreakups” had substantial magnetic effects, Aikio et al. (1999) also reported that the
0 1 0 20 30 4 0 50 C o nd uc ti v it y , S -3 0 0 -2 0 0 -1 0 0 0 1 00 M a gn et ic f iel d , n T 22 23 00 0 1 0 2 U T C ow lin g P e de rsen H a ll 0 1 0 00 C h ar a c te ri s ti c en er g y ( 0 5 rgy f lux ( e rg s c m -2 s -1 ) C h a ra cteristic e ne rgy E ne rgy flux M u on io H -com po ne nt
Fig. 12. Characteristic energy, and energy flux of precipitating
elec-trons during the considered event estimated from the data of photo-metric observations in zenith of Kiruna (top). Hall, Pedersen, and Cowling conductivity of the ionosphere calculated from the above parameters of the precipitating electrons (middle). Magnetic field variations at station Muonio (bottom).
weakest activations occurred at the beginning of the substorm sequence.
Many authors suggested that pseudobreakups must be very localized (e.g. Nakamura et al., 1994; McPherron, 1991). Our analysis showed that some pseudobreakups could be lo-calized in latitude, but broad in their longitudinal extent. The extended pseudobreakup event has been already described by Koskinen et al. (1993).
Concerning the role of reconnection and its location, our results agree with those of Petrukovich et al. (1998), who determined the location of the reconnection site during the pseudobreakup to be rather close to the Earth (at ∼16 RE).
Nagai et al. (1998) also reported on the reconnection event which started at X > −15REduring the pseudobreakup.
6 Summary and conclusion
We considered the auroral event, which in many respects, re-peats the typical substorm development. Nevertheless, we found that the onset of the expansion phase, as well as some successive activations are, in fact, pseudobreakups, i.e. auro-ral activations which are not followed by strong poleward ex-pansions and significant magnetic disturbances. Summariz-ing the similarities and differences of PBs and substorm-like activations which occurred in the considered case, we note that ground-based and magnetospheric signatures of PBs and substorms can be similar (auroral activation, PiB, near-Earth
no energetic particle injections, with only very soft (a few keV) particle flux increases at 6.6 RE. Energy spectra of the
precipitating electrons are softer during the pseudobreakup phase in comparison with those found during the “real sub-storm” activations.
We may conclude that in our case, the main difference be-tween the pseudobreakups and “real substorm” activations is a different level of particle energization in the magnetotail and in the auroral acceleration region. If the substorm in-stability (presumably reconnection) develops in the cold and dense plasma, one may expect weak energization. The weak acceleration in the auroral acceleration region (again due to cold and dense precipitating plasma) leads to the low iono-spheric conductivity caused by precipitating electrons and, consequently, to the weak Hall currents and weak ground magnetic effects. In this view, the role of ionospheric (Hall) conductivity is “passive”; it controls primarily the intensity of the ground magnetic disturbance, but it is not the main factor which terminates the magnetospheric instability.
Further investigation is needed to understand if the rela-tionship between the cold/dense plasma sheet and pseudo-breakups is regular and if the above scenario is applicable to other events at the beginning of well isolated (following the prolonged interval of quietness) substorms.
Acknowledgements. We thank all participants of November 1995
auroral campaign in northern Europe and, especially, Dr. Esa Tu-runen, coordinator of the campaign, for efforts in getting the good quality data. We are grateful to Dr. J. Manninen for informa-tion on riometer data and Dr. S. Leontyev for the MSP data ob-tained in Kiruna. The IMAGE magnetometer data are taken from http://www.fmi.fi/image. The work was partly supported by the grant INTAS 99–0078.
Topical Editor G. Chanteur thanks S. I. Ohtani and T. Nagai for their help in evaluating this paper.
References
Aikio, A. T., Sergeev, V. A., Shukhtina, M. A., Vagina, L. I., Angelopoulos, V., and Reeves, G. D., Characteristics of pseu-dobreakups and substorms observed in the ionosphere, at the geosynchronous orbit, and in the midtail, J. Geophys. Res., 104, 12263, 1999.
Akasofu, S. I., The development of the auroral substorm, Planet. Space Sci., 12, 273, 1964.
Bame, S. J., McComas, D. J., Thomsen, M. F., Barraclough, B. L., Elphic, R. C., Glore, J. P., Gosling, J. T., Chavez, J. C., Evans, E. P., and Wymer, F. J., Magnetospheric plasma analyzer for space-craft with constrained resources, Rev. Sci. Instr., 64, 1026, 1993. Belian, R. D., Gisler, G. R., Cayton, T., and Christensen, R., High-Z energetic particles at geostationary orbit during the great solar proton event series of October 1989, J. Geophys. Res., 97, 16897, 1992.
Birn, J., Thomsen, M. F., Borovsky, J. E., Reeves, G. D., McCo-mas, D. J., and Belian, R. D., Characteristic plasma properties during dispersionless substrom injections at geosynchronous or-bit, J. Geophys. Res., 102, 2309, 1997.
Fujimoto M., Terasawa, T., and Mukai, T., The low-latitude bound-ary layer in the tail-flanks, in New perspectives on the Earth’s magnetotail, edited by A. Nishida, D. N. Baker, and S. W. H. Cowley, Geophysical Monograph 105, 33, AGU, Washington D.C., 1998.
Higbie, P. R., Belian, R. D., and Baker, D. N., High-resolution en-ergetic particle measurements at 6.6 RE: 1 Electron
micropulsa-tions, J. Geophys. Res., 88, 4851, 1978.
Hones, E. W., Transient phenomena in the magnetotail and their relation to substorms, Space Sci. Rev., 23, 393, 1979.
Klimov, S. I. et al., ASPI experiment: Measurements of fields and waves onboard the Interball-1 spacecraft, Ann. Geophysicae, 15, 514, 1997.
Knight, S., Parallel electric field, Planet. Space Sci., 21, 741–750, 1973.
Koskinen, H. E. J., Lopez, R. E., Pulkkinen, R. I., Baker, D. N., and Bosinger, T., Pseudo-breakup and substorm growth phase in the ionosphere and magnetosphere, J. Geophys. Res., 98, 5901, 1993.
Lui, A. T. Y., Extended consideration of a synthesis model for mag-netospheric substorms, in Magmag-netospheric substorms, Geophys-ical Monograph 64, AGU, 42, 1991.
Lutsenko, V. N., Kudela, K., and Sarris, E. T., The DOK-2 experi-ment to study energetic particles by Tail Probe and Auroral Probe satellites in the Interball project, Cosmic Research, 36, 93, 1998. Lyons, L. R. and Williams, D. J., Quantitative aspects of
magneto-spheric physics, D. Reidel, Dordrecht, Holland, 1984.
McComas, D. J., Bame, S. J., Barraclough, B. L., Donart, J. R., Elphic, R. C., Gosling, J. T., Moldwin, M. B., Moore, K. R., and Thomsen, M. F., Magnetospheric Plasma Analyzer (MPA): Initial three-spacecraft observations from geosynchronous orbit, J. Geophys. Res., 98, 13453, 1993.
McPherron, R. L., Physical processes during magnetospheric sub-storms and magnetic sub-storms, in Geomagnetism, ed. J. A. Jacobs, Academic, San Diego, 4, 953, 1991.
McPherron, R. L., Russel, C. T., and Aubry, M., Satellite studies of magnetospheric substorms on August 15, 1968. 9. Phenomeno-logical model of substorm, J. Geophys. Res., 78, 3131, 1973. Mende, S. B. and Eather, R. H., Monochromatic all-sky
observa-tions and auroral precipitation patterns, J. Geophys. Res., 81, 3771, 1976.
Nagai, T., Fujimoto, M., Nakamura, R., et al., Geotail observations of a fast tailward flow at XGSM = −15RE. J. Geophys. Res.,
103, 23543–23550, 1998.
Nakamura, R., Baker, D. N., Yamamoto, T., et al., Particle and field signatures during pseudobreakup and major expansion onset, J. Geophys. Res., 99, 207, 1994.
Ohtani, S., Anderson, B. J., Sibeck, D. G., et al., A multisatellite study of a pseudo-substorm onset in the near-Earth magnetotail, J. Geophys. Res., 98, 19355, 1993.
Petrukovich, A. A., Sergeev, V. A., Zeleniy, L. M., et al., Two spacecraft observations of a reconnection pulse during an auroral breakup, J. Geophys. Res., 103, 47, 1998.
Pudovkin, M. I., Semenov, V. S., Starkov, G. V., and Kornilova, T. A., On separation of the potential and vortex parts of the magne-totail electric field, Planet. Space Sci., 39, 563, 1991.
Pulkkinen, T. I., Pseudobreakup or substorm?, Proc. Third Interna-tional Conference on Substorms, ESA-SP 389, 285, 1996. Pytte, T., McPherron, R. L., and Kokubun, S., The ground
sig-natures of the expansion phase during multiple onset substorms, Planet. Space Sci., 24, 1115, 1976.
Pytte, T., McPherron, R. L., Kivelson, M. G., Hones, Jr., E. W., and West, H. I., Multiple studies of magnetospheric substorms: plasma sheet recovery and the poleward leap of auroral zone ac-tivity, J. Geophys. Res., 83, 5256, 1978.
Rostoker, G., Macrostructure of geomagnetic bays, J. Geophys. Res., 73, 4217, 1968.
Rostoker G., Akasofu, S. I., Foster, J., et al., Magnetospheric sub-storms: definitions and signatures, J. Geophys. Res., 85, 1663, 1980.
Sauvaud J.-A. et al., The Interball-Tail ELECTRON experiment: Initial results on the low-latitude boundary layer of the dawnside magnetosphere, Ann. Geophysicae, 15, 587, 1997.
Sergeev, V. A. and Yahnin, A. G., The features of auroral bulge expansion, Planet. Space Sci., 27, 1429, 1979a.
Sergeev, V. A. and Yahnin, A. G., A correspondence of the substorm explosive phase signatures, in: Geomagnetic Research, No. 24, Soviet Radio, Moscow, 78, 1979b (in Russian).
Sergeev, V. A., Yahnin, A. G., Rakhmatulin, R. A., Solovjev, S. I., et al., Permanent flare activity in the magnetosphere during periods of low magnetic activity in the auroral zone, Planet. Space Sci., 34, 1169, 1986.
Sergeev, V. A., Bosinger, T., Belian, R. D., et al., Drifting holes in the energetic electron flux at geosynchronous orbit following substorm onset, J. Geophys. Res., 97, 6541, 1993.
Sergeev, V. A., Bosinger, T., Yahnin, A. G., et al., Coordinated ground-based observation near INTERBALL/TAIL footprint: initial results for plasma sheet passes in 1995/1996, Proceedings of ISC-3, Versailles, France, 585, 1996a.
Sergeev, V. A., Pulkkinen, T. I., and Pellinen, R. J., Coupled-mode scenario for the magnetospheric dynamics, J. Geophys. Res., 101, 13047, 1996b.
Sergeev, V. A., Vagina, L. I., Zeleniy, L. M., et al., An event of plasma sheet heating observed by INTERBALL-1 and GEOTAIL spacecraft, Cosmic Research, 37, 115, 1999.
Sergienko, T. I. and Ivanov, V. E., A new approach to calculate the excitation of atmospheric gases by auroral electrons, Ann. Geo-physicae, 11, 717, 1993.
Solomon, S. C., Hays, P. B., and Abreu, V. J., The auroral 6300 A emission: Observation and modeling, J. Geophys. Res., 93, 9867, 1988.
Terasawa T., Fujimoto, M., Mukai, T., et al., Solar wind control of density and temperature in the near-Earth plasma sheet: WIND-GEOTAIL collaboration, Geophys. Res. Lett., 24, 935, 1997. Viljanen, A. and Hakkinen, L., IMAGE magnetometer network, in:
Satellite-Ground Based Coordination Sourcebook (eds. M. Lock-wood, M. N. Wild and H. J. Opgenoorth), ESA publications SP-1198, p. 111, 1997.
Yahnin, A. A., Sergeev, V. A., Ievenko, I. B., et al., Characteristics of the phenomena accompanying the localized auroral flares. In: Magnetospheric Research, No. 5, Nauka, Moscow, 93, 1984 (in Russian).
Yermolaev, Yu. I., Fedorov, A. O., Vaisberg, O. L., Balebanov, V. M., Obod, Yu. A., Jimenez, R., Fleites, J., Llera, L., and Omelchenko, A. N., Ions distribution dynamics near the Earth’s bow shock: first measurements with the 2 D ion energy spec-trometer CORALL on the Interball/Tail-probe satellite, Ann. Geophysicae, 15, 533, 1997.