UNIVERSITÉ DE MONTRÉAL
FIRST EMTP-RV BENCHMARK FOR OFF-LINE SIMULATION OF RAPID TRANSIT TRAIN DC AUXILIARY SYSTEMS
MAXIME BERGER
DÉPARTEMENT DE GÉNIE ÉLECTRIQUE ÉCOLE POLYTECHNIQUE DE MONTRÉAL
MÉMOIRE PRÉSENTÉ EN VUE DE L’OBTENTION DU DIPLÔME DE MAÎTRISE ÈS SCIENCES APPLIQUÉES
(GÉNIE ÉLECTRIQUE) DÉCEMBRE 2015
UNIVERSITÉ DE MONTRÉAL
ÉCOLE POLYTECHNIQUE DE MONTRÉAL
Ce mémoire intitulé :
FIRST EMTP-RV BENCHMARK FOR OFF-LINE SIMULATION OF RAPID TRANSIT TRAIN DC AUXILIARY SYSTEMS
présenté par : BERGER Maxime
en vue de l’obtention du diplôme de : Maîtrise ès sciences appliquées a été dûment accepté par le jury d’examen constitué de :
M. KARIMI Houshang, Ph. D., président
M. KOCAR Ilhan, Ph. D., membre et directeur de recherche
M. MAHSEREDJIAN Jean, Ph. D., membre et codirecteur de recherche M. LAVERTU Carl, B. Ing., membre
DEDICATION
To my parents who always believed in me and… …will probably not read this thesis.
ACKNOWLEDGEMENTS
First, I would like to thank M. Jacques Belley and Mme. Isabelle Provost from Bombardier Transportation who believed in me from the first day I announced my wish to pursue a master research project with them. I will never forget the amazing opportunity they gave me.
I would also like to thank M. Carl Lavertu from Bombardier Transportation for all his support and technical advices. I consider myself very privileged to learn from him every day. Carl has been more than available for me anytime I needed him. It was an honour to share this experience with him.
A special thanks also to M. Stéphane Goulet, M. Dany Lévesque, M. Herman Lévesque, M. Pierre Miclette and M. Jean-Pierre Magalhaes Grave from Bombardier Transportation for all their help and support in different ways.
I will also always be grateful to my advisor Prof. Ilhan Kocar who believed in me the first time I came in his office to expose him my plan to apply for graduate studies at Polytechnique Montreal. From our first discussion regarding the definition of the research project at Bombardier’s office to the writing of a scientific paper and this master thesis, he has been very supportive, available and provided me all the guidance and advices I needed within the best of his knowledge and experience.
Moreover, I can’t pass over the unbelievable collaboration with Prof. Jean Mahseredjian. He gave me the opportunity to enter the EMTP-RV family and I consider myself very fortunate of being a small part of this amazing story.
Despite the distance, I will always be thankful to my parents, Céline and Sylvain, for their unconditional support and encouragement that allowed me to chase my dreams. They are an important part of what I became and I could never thank them enough for what they have been and still are for me.
Last but not least, I would like to thank my lovely Brigitte for all her encouragement during the best and harder moments of this adventure. She has been and still is more than understanding being also my best confidant. It will be difficult for me to give her back everything she have done for me during her own master. I wish you all the best. I am proud of you.
This project has been financially supported by Bombardier Transportation, FRQNT, and CRSNG through the Industrial Innovation Scholarship Program.
RÉSUMÉ
Les exigences de performance opérationnelle optimale dans l’industrie ferroviaire du transport de passagers nécessitent le développement continu de solutions innovatrices. Le défi principal des manufacturiers est de fournir des véhicules toujours plus efficaces, plus légers et à un coût moindre tout en offrant de bonnes performances en matière de fiabilité, disponibilité, maintenabilité et sécurité. La distribution auxiliaire DC est ciblée dans ce projet de recherche en raison de son haut potentiel d’améliorations majeures. Le niveau de tension est un enjeu majeur. Les distributions actuelles sont généralement à des tensions très basses variant entre 24 V et 110 V. Les récents développements dans les distributions DC à 380 V sont prometteurs et intéressants pour les manufacturiers de matériel roulant; la distribution auxiliaire DC d’une rame de métro n’étant ni plus ni moins qu’un micro-réseau DC intelligent. Toutefois, le passage à des tensions plus élevées mène inévitablement à de nouveaux enjeux techniques et soulève des questionnements sur les aspects de sécurité.
Par ailleurs, le développement de nouvelles architectures ainsi que l’intégration de nouvelles technologies doivent nécessairement se faire en considérant l’environnement ferroviaire dans son ensemble et les pratiques et normes actuelles de l’industrie. L’analyse par simulation combinée aux pratiques, aux normes et à l’expérience de l’industrie peut s’avérer un outil efficace pour réduire les risques inhérents associés aux changements majeurs.
Dans ce projet, un modèle complet de distribution auxiliaire DC typique d’une rame de métro est développé dans le logiciel de simulation EMTP-RV en se basant sur les données de Bombardier Transport. Chaque composante du réseau est modélisée et validée individuellement. Le modèle est orienté vers les besoins et les objectifs d’analyse de l’industrie. Il permet de faire des études complètes et détaillées dans le but de développer de nouvelles architectures et valider différents concepts qui ne peuvent être expérimentés à la phase de conception. Le modèle permet également d’étudier plusieurs scénarios rapidement.
Les possibilités et les performances du modèle de simulation sont finalement démontrées par la réalisation de différentes études de réseaux électriques : protection de court-circuit, mise à la terre et protection de défaut à la terre, étude de surtension transitoire et protection contre les surtensions, dimensionnement des batteries d’urgence, stabilité de tension et courant d’appel. Les analyses sont basées sur des observations expérimentales ainsi que sur des études de cas réelles présentées dans la littérature.
ABSTRACT
In the rapid transit industry, market interest toward optimal operational performance requires innovative solutions. The main challenge for vehicle manufacturers is to increase the efficiency and reduce the weight and the cost of its vehicles while keeping high levels of reliability, availability, maintainability, and safety. Vehicle DC auxiliary systems are targeted in this master thesis because they offer a high potential of major improvements. Voltage level is a major challenge. Actual distribution are at very low voltages ranging between 24 V to 110 V. Recent developments in 380 V DC systems are promising and interesting for vehicle manufacturers. DC auxiliary systems in railway vehicles are in fact no other than rolling smart DC microgrids. The shift toward higher voltage DC auxiliary systems inherently leads to new technical challenges and safety concerns.
Moreover, the development of new architectures and the integration of new technologies must be done with an appropriate knowledge of the rail environment and the actual practices and standards. Analysis using simulation models combined with established industry practices, standards and past experiences is an efficient tool to reduce the inherent risk exposure with major changes.
In this project, a complete generic rapid transit train DC auxiliary system model is developed in EMTP-RV based on Bombardier Transportation data. Models of the network components are developed and validated individually based on the available information. The developed train model is highly oriented toward the industry specific needs and provides sufficient level of details for design purpose and architecture development of railway vehicle DC auxiliary systems. The simulation model can be a useful tool at the design phase to investigate design concerns which cannot be tested at early project stage.
The capabilities of the simulation model are finally demonstrated for different power system studies such as: overcurrent protection, grounding and ground fault analysis, transient overvoltage and insulation coordination, emergency battery sizing, voltage stability, and inrush current. Phenomena, and events observed during field testing and presented in the literature are reproduced using the developed model and the influence of network parameters is investigated.
TABLE OF CONTENTS
DEDICATION ... III ACKNOWLEDGEMENTS ... IV RÉSUMÉ ... V ABSTRACT ... VI TABLE OF CONTENTS ...VII LIST OF TABLES ... XI LIST OF FIGURES ...XII LIST OF SYMBOLS AND ABBREVIATIONS ... XVI LIST OF APPENDICES... XVIII
CHAPTER 1 INTRODUCTION ... 1
1.1 Context ... 1
1.2 Objectives ... 4
1.3 Simulation Tool Selection ... 5
1.3.1 Off-Line vs On-Line Simulation ... 5
1.3.2 Circuit Equation Formulation ... 5
1.3.3 EMTP-type, SPICE-type and General Purpose Tools ... 6
1.3.4 The Final Choice: EMTP-RV ... 7
1.4 Methodology ... 7
1.5 Thesis Structure ... 8
CHAPTER 2 LITERATURE REVIEW ... 9
2.1 Fault Protection ... 10
2.2 Stability ... 12
2.4 Grounding and Bonding ... 15
2.5 Safety ... 18
CHAPTER 3 DC POWER SYSTEM ANALYSIS ... 21
3.1 Stability ... 21
3.1.1 Sokal Criterion ... 22
3.1.2 Emadi et al. Criterion ... 23
3.1.3 Stability Analysis ... 23 3.2 Current Transient ... 25 3.2.1 Overload ... 25 3.2.2 Inrush ... 26 3.2.3 Short-Circuit ... 28 3.2.4 Arcing Fault ... 33
3.3 Voltage Switching Transient ... 37
3.3.1 Theoretical Review of Voltage Switching Transient ... 38
3.3.2 Arc Voltage ... 41
3.3.3 Transient Recovery Voltage (TRV) ... 42
CHAPTER 4 MODEL DEVELOPMENT ... 44
4.1 Introduction ... 44
4.2 Sources of Power ... 44
4.2.1 Auxiliary Power Supply (APS) ... 44
4.2.2 NiCd Battery ... 48
4.3 Wiring ... 56
4.3.1 Conductor ... 56
4.4 Overcurrent Protective Devices ... 59
4.4.1 Circuit Breaker ... 59
4.4.2 Fuse ... 69
4.5 Load Front-End ... 73
4.5.1 Overvoltage Protective Devices ... 74
4.5.2 Reverse Blocking Diode ... 77
4.5.3 On/Off Voltage-Controlled Circuit ... 77
4.5.4 Input Filter ... 78
4.5.5 Hold-up Circuit ... 79
4.5.6 Inrush Limitation ... 80
4.6 Complete Load Model ... 82
4.6.1 Constant Power Load ... 82
4.6.2 Constant Current Load ... 85
4.7 Complete Train DC Auxiliary System Model ... 87
4.7.1 Low Voltage Bus (LVB) – 110 V ... 87
4.7.2 Intermediate Voltage Bus (IVB) – 380 V ... 87
CHAPTER 5 CASE STUDY ... 89
5.1 110 V Bus Case Study ... 89
5.1.1 Overcurrent Protection ... 89
5.1.2 Ground Fault Detection ... 94
5.1.3 Transient Overvoltage (TOV) ... 98
5.1.4 Emergency Battery Sizing ... 101
5.2 380 V Bus Case Study ... 107
5.2.2 Inrush ... 112 CHAPTER 6 CONCLUSION AND RECOMMENDATIONS ... 115 BIBLIOGRAPHY... 119
LIST OF TABLES
Table 1.1: Targeted Power System Analysis ... 4
Table 3.1: Symbols used for Stability Analysis ... 21
Table 4.1: Battery Model Symbols and Units ... 49
Table 4.2: Conductor Parameters used in the Train Model ... 58
Table 4.3: Bolted-joint Connection Test Conditions ... 59
Table 4.4: Bolted-joint Connection Test Results ... 59
Table 4.5: Circuit Breaker Model Symbols and Units ... 61
Table 4.6: Circuit Breaker Model Validation Parameters ... 66
Table 4.7: Fuse Non-Linear Resistance Model Parameters ... 72
Table 4.8: TVS Model Parameters ... 75
Table 5.1: Transient Overvoltage Bus Filter Parameters ... 99
LIST OF FIGURES
Figure 1.1: Train Supplied by Multiple Substations ... 1
Figure 1.2: DC Traction Power System ... 2
Figure 1.3: Overview of a Railway Vehicle Power System ... 3
Figure 2.1: Typical Low Voltage Auxiliary Load Distribution in Rapid Transit Train ... 13
Figure 2.2: Voltage Quality Requirements in Railway Vehicles from IEC 60571 ... 14
Figure 2.3: Voltage Quality Requirements in Data Centers from EPRI, PSL and NTT ... 15
Figure 2.4: Conductor Arrangements in DC Systems from IEC 60364 ... 17
Figure 2.5: High Resistance Grounding DC Systems through a Ground Fault Detector... 18
Figure 2.6: US Injury Risk Profile in Rail Transit: 2003-2008 [70] ... 19
Figure 2.7 Passenger Injuries by Mode in Rail Transit: 2003-2008 [70] ... 19
Figure 3.1 Sokal Criterion System Configuration ... 22
Figure 3.2 Sokal Equivalent Load Model for Negative Resistance (Rin) Definition... 22
Figure 3.3 Emadi et al. Criterion System Configuration with Constant Current Load ... 23
Figure 3.4 Series RLC-Circuit for Capacitor Inrush Current Calculation ... 26
Figure 3.5 Inrush Current Typical Waveforms ... 28
Figure 3.6 Series RLC-Circuit for Capacitor Discharge Current Calculation ... 29
Figure 3.7 Simple RL Battery Model for Short-Circuit Current Calculation ... 30
Figure 3.8 Simple and Detailed Battery Models Short-Circuit Current Comparison ... 31
Figure 3.9 General VI Characteristic of Auxiliary Converter ... 32
Figure 3.10 Auxiliary Converter Output Current Typical Waveform ... 33
Figure 3.11 Current Level of Series and Parallel Arcing Faults in Home Circuit [78] ... 35
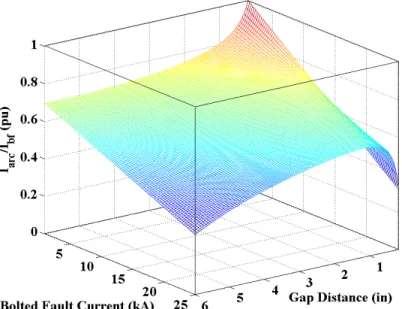
Figure 3.12 Arcing Current against Bolted Fault Current and Gap Distance ... 37
Figure 3.14 Circuit Parameters Impact on Transient Overvoltage ... 40
Figure 3.15 Trapped Charge when Opening at Peak Capacitor Overvoltage ... 41
Figure 3.16 RL-Circuit for Arcing Voltage Study ... 42
Figure 3.17 Current Breaking Process by Electric Arc ... 42
Figure 3.18 Final Current Interruption Transient Recovery Voltage (TRV) [42] ... 43
Figure 4.1 Train Configuration for Simulation Case Study ... 44
Figure 4.2 General Auxiliary Power Supply (APS) System ... 45
Figure 4.3 Converter Model Schematic Representation ... 46
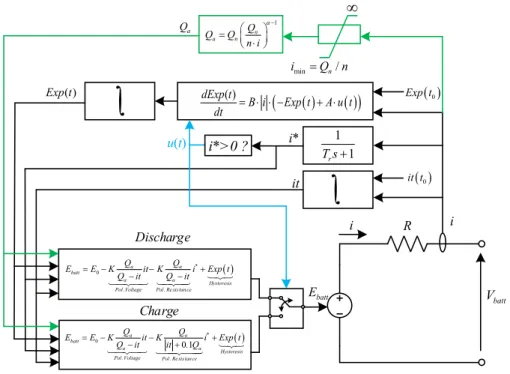
Figure 4.4 Battery Model Schematic Representation ... 49
Figure 4.5 Theoretical Peukert Effect for Different Peukert Coefficient ... 52
Figure 4.6 NiCd Battery Discharge Curve Validation ... 53
Figure 4.7 NiCd Battery Voltage Validation in Train Emergency Condition ... 53
Figure 4.8 Train (Test) and Averaged (Simulation) Current in Emergency Condition ... 54
Figure 4.9 Battery Current in Short-Circuit Condition ... 54
Figure 4.10 Battery Voltage in Short-Circuit Condition ... 55
Figure 4.11 Fault Voltage in Short-Circuit Condition ... 55
Figure 4.12 Two (2) Conductors Equivalent Model ... 57
Figure 4.13 Bolted-joint Connection Example ... 59
Figure 4.14 Thermomagnetic Circuit Breaker Time-Current Curve Model ... 62
Figure 4.15 Thermomagnetic Circuit Breaker Detection Model Diagram ... 63
Figure 4.16 ABB Tmax T5 400A Thermomagnetic Circuit Breaker Time-Current Curve ... 66
Figure 4.17 Case A: Validation of the Circuit Breaker Model in the Thermal Region ... 67
Figure 4.18 Case B: Validation of the Circuit Breaker Model in the Magnetic Region ... 68
Figure 4.20 Fuse Melting Time-Current Curves ... 71
Figure 4.21 Fuse Model Validation for Three (3) Different Fuse Current Ratings ... 72
Figure 4.22 Fuse Model Validation – Arcing of the 160 A Fuse ... 73
Figure 4.23 Typical Auxiliary Load Front-End in Railway Vehicle ... 74
Figure 4.24 VI Characteristic of the TVS Model ... 75
Figure 4.25 Breakdown Voltage Tolerance on TVS VI Characteristic ... 76
Figure 4.26 Voltage Envelope Implemented in EMTP-RV for Load Model Disconnection ... 78
Figure 4.27 EMI Filter General Configuration ... 79
Figure 4.28 Simple Hold-up Circuit ... 79
Figure 4.29 Pre-Charge Resistor Inrush Limiting Circuit ... 81
Figure 4.30 Inrush Limiting Circuit using NTC Resistor ... 81
Figure 4.31 Inrush Limiting Circuit using NTC Resistor Model in EMTP-RV ... 81
Figure 4.32 Inrush Experimental Validation using the NTC Resistor Model (cold) ... 81
Figure 4.33 Complete Load Model Schematic Representation ... 82
Figure 4.34 Constant Power Load Model Schematic Representation ... 84
Figure 4.35 Complete Constant Power Load Model Simulation Validation ... 84
Figure 4.36 Validation of the Complete Constant Power Load Model Current Equation ... 85
Figure 4.37 Constant Current Load Model Schematic Representation ... 86
Figure 4.38 Complete Constant Current Load Model Simulation Validation ... 86
Figure 4.39 IVB (380 V) Constant Power Load Model Schematic Representation ... 88
Figure 5.1 Total Fault Current and Sources Contribution (F1-Fault) ... 90
Figure 5.2 Circuit Breaker Travel, Load Voltage and Load Current (F1-Fault) ... 91
Figure 5.3 Total Fault Current and Sources Contribution (Zoom #1) ... 92
Figure 5.5 Overvoltage at Opening of BCB2-B2 (Zoom #2) ... 93
Figure 5.6 Ground Fault Detector (GFD) Schematic Representation ... 94
Figure 5.7 Single-Pole Interruption with Double-Fault-to-Ground ... 95
Figure 5.8 Double-Fault-to-Ground (F2-F3) GFD Signals ... 96
Figure 5.9 Double-Fault-to-Ground (F2-F3) Fault Current ... 97
Figure 5.10 Double-Fault-to-Ground (F2-F3) Circuit Breaker Single-Pole Interruption ... 97
Figure 5.11 Transient Overvoltage Bus Filter (BF) Schematic Representation ... 98
Figure 5.12 Fault Current for a Fault in F4 ... 100
Figure 5.13 Impact of Surge Protective Devices on Transient Overvoltage ... 100
Figure 5.14 MOV Energy Absorbed from the Surge ... 101
Figure 5.15 Load Set-Point Profile in Emergency Condition ... 102
Figure 5.16 Battery and Load Current Profiles (Q5=65 Ah) ... 104
Figure 5.17 Battery and Load Voltage Profiles (Q5=65 Ah)... 105
Figure 5.18 Available Battery Capacity and State-of-Charge (Q5=65 Ah) ... 105
Figure 5.19 Battery and Load Voltage Profiles (Q5=85 Ah)... 106
Figure 5.20 Available Battery Capacity and State-of-Charge (Q5=85 Ah) ... 106
Figure 5.21 Load Filter Capacitor Voltage in the B2- and B4-car ... 109
Figure 5.22 M7-Load Filter Capacitor Voltage for Different Filter Inductance (LF) ... 110
Figure 5.23 Loads Impact on M7-Load Filter Capacitor Voltage Stability (LF=1 mH) ... 110
Figure 5.24 FFT of M7-Load Filter Capacitor Voltage (LF=1 mH) ... 111
Figure 5.25 Impact of M7-Load Filter Capacitor ESR on Voltage Stability ... 111
Figure 5.26 Impact of M7-Load Behavior on Voltage Stability ... 112
Figure 5.27 Inrush Current Analysis in Normal Operating Mode (2 IVPS) ... 113
LIST OF SYMBOLS AND ABBREVIATIONS
AC Alternative Current
AFCI Arc Fault Circuit Interrupter
AWG American Wire Gauge
BC Bypass Contactor
CC Charging Contactor
CPL Constant Power Load
CSC Current Source Converter
DC Direct Current
DPS Distributed Power System EMT Electromagnetic Transient
EMTP-RV Electromagnetic Transient Program – Restructured Version ESL Equivalent Series Inductance
ESR Equivalent Series Resistance
ETSI European Telecommunications Standards Institute FFT Fast Fourier Transform
FMEA Failure Mode and Effects Analysis
FMECA Failure Mode and Effects Criticality Analysis FTA Fault Tree Analysis
GFD Ground Fault Detector
GMR Geometric Mean Radius
HSCB High Speed Circuit Breaker HVDC High Voltage Direct Current LVDC Low Voltage Direct Current
MCCB Molded-Case Circuit Breaker MOV Metal Oxide Varistor
MTDC Multi-Terminal Direct Current MVDC Medium Voltage Direct Current NEC National Electrical Code
NTC Negative Temperature Coefficient PEC Power Electronic Converter
RF Radio Frequency
RMS Root Mean Square
SOC State-of-Charge
SPICE Simulation Program with Integrated Circuit Emphasis
TCC Time-Current Curve
TOV Transient Overvoltage TRV Transient Recovery Voltage TVS Transient Voltage Suppressor UAV Unmanned Aerial Vehicle VFD Variable Frequency Drive VSC Voltage Source Converter
LIST OF APPENDICES
Appendix A – Proof of Amedi et al. Stability Criterion ... 126
Appendix B – Complete Train Power System for Case Study ... 128
Appendix C – 110 V Bus Simulation Parameters ... 129
CHAPTER 1
INTRODUCTION
1.1 Context
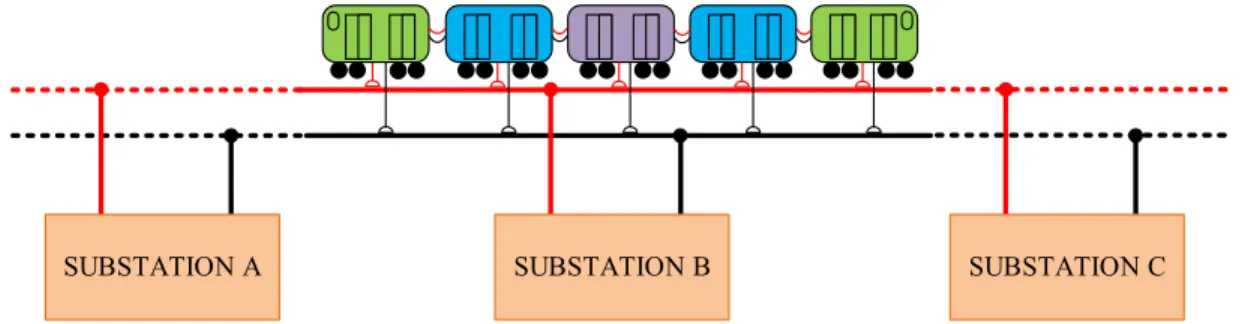
Heavy Rail (e.g. subway, metro, rapid transit or rapid rail) operating on DC electric railway systems are widely used in North America for high volume and rapid passenger transportation. Heavy Rail systems are composed of passenger vehicles operating generally as multi-vehicle trains on a separate rights-of-way rail system which is supplied by a dedicated electric traction system (Figure 1.1) [1].
Modern DC traction systems are equipped with 6- and 12- pulse diode rectifiers but the trend is now to use 12-pulse parallel rectifiers [2]. The DC output voltage varies between 600 V to 1500 V with 600 V and 750 V being widely used in North America [3]. A typical DC traction power system using a 12-pulse uncontrolled parallel bridge rectifier is shown in Figure 1.2.
Bombardier Transportation is a world leader in rail vehicles manufacturing, maintenance and fleet management. As a vehicle manufacturer, the main objective is to provide vehicles with optimal operational performance. It is defined by high levels of reliability, availability, maintainability, safety, environmental performance, and by cost-efficiency solutions [4]. Market appetite for optimal operational performance requires innovative solutions. Vehicle power systems are targeted in this master thesis because they offer a high potential of major improvements, the main objectives being to increase the efficiency and reduce the weight and the cost of the manufactured vehicles.
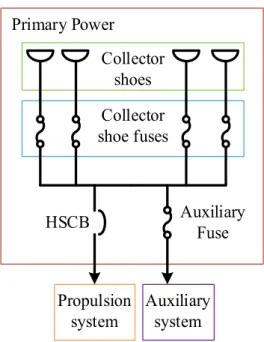
A single line diagram of a typical railway car on-board power system is shown in Figure 1.3. Vehicle power system can be divided into three (3) subsystems: the vehicle primary power, the propulsion system, and the auxiliary system.
SUBSTATION A SUBSTATION B SUBSTATION C
Rails FEEDER + + -Running rails (-) SUBSTATION Positive rails (+) ELECTRIC UTILITY
SUBSTATION TRANSIT PROPERTY
DC TRACTION POWER SYSTEM
Figure 1.2: DC Traction Power System
The power from the traction system substations is first delivered to the moving train by third-rail, fourth-rail or catenary systems [5][6]. In the primary power, collector shoe fuses are used to protect the primary power cables and equipment. The propulsion High Speed Circuit Breaker (HSCB) is used to protect the propulsion system equipment while the auxiliary fuse is used to protect the auxiliary converter [7].
The propulsion system of each vehicle is generally composed of one (1) or two (2) traction inverters connected each to one (1) or two (2) AC traction motors. A rheostatic braking system based on a buck converter topology is also generally added to dissipate extra braking energy in case of non-receptivity of the DC traction system during dynamic braking operation [8].
The train auxiliary subsystems are supplied by an auxiliary converter which converts the DC traction power system supply into lower galvanically isolated DC and three-phase AC supplies. Examples of train auxiliary subsystems are: lighting, communication, automatic control systems, surveillance systems, doors, propulsion/brake control, and heating ventilation air conditioning (HVAC) systems. The DC auxiliary system also includes backup batteries to support essential loads under degraded or emergency operation. A load shedding scheme is also present to improve the train survivability. In this master thesis, only the DC auxiliary systems will be covered. DC primary power protection analysis has also been performed during this master thesis project but the results are presented in a dedicated paper [7].
HSCB Auxiliary Fuse Collector shoes Collector shoe fuses Propulsion
system Auxiliary system
Primary Power
Figure 1.3: Overview of a Railway Vehicle Power System
DC auxiliary systems voltage varies between 24 V to 110 V with 37.5 V being widely used in North America and 110 V being popular in Europe [9][10]. One of today’s main advantage of using DC over AC for auxiliary systems is the ease to distribute variable frequency drives (VFD) near the loads directly connected on a single DC bus without any AC to DC conversion stage [11]. The reduction of conversion stages increases the overall efficiency and reliability of the system. The use of DC over AC also offers a direct connection of the energy storage systems being mainly backup batteries in the railway industry.
Standardization of power system architectures and technologies is also necessary to stay competitive. In their effort to standardize railway vehicle on-board auxiliary system architecture, the European R&D Working Group MODTRAIN defines several system and operational requirements in the design of auxiliary systems: the train type, the architecture of the propulsion system, and specific customer requirements such as primary power voltage, the performance, the level of redundancy, and the interface between various sources [12].
Transit authorities and vehicle manufacturers are generally conservative in integrating new technologies. Train power systems are complex and it may be difficult to evaluate the benefits of new architectures and new technologies while predicting with precision the impact on the power system operational performance.
The development of new architectures and the integration of new technologies in train power systems must also be done with an appropriate understanding of the rail environment and the actual standards. Analysis using simulation models combined with established industry practices and standards can significantly reduce the risks in applying new technologies [13]. For example, behavioral analysis using simulation models as part of academic research projects have been done in the last few years to study new architectures for aircraft [14],[15], shipboard [16], and DC microgrid [17].
1.2 Objectives
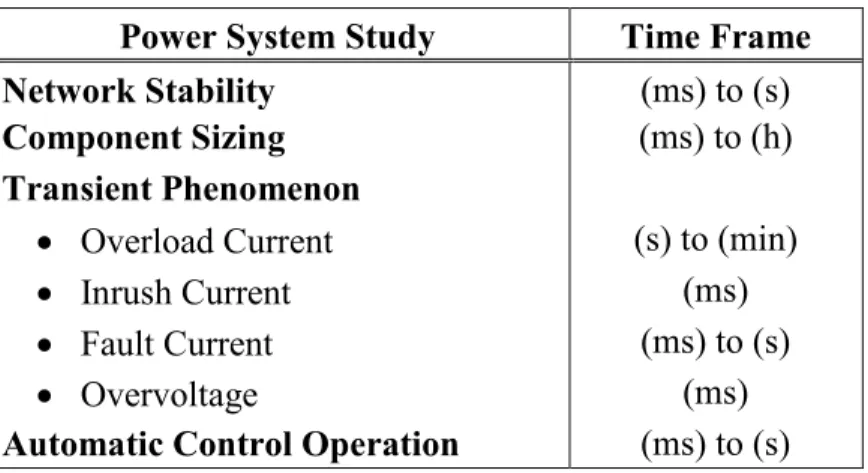
The main objective of this project is to develop a complete train DC auxiliary systems simulation model with sufficient details for design purpose, architecture development and standardization of railway vehicle power systems. The model should be highly oriented toward the industry specific needs. The targeted power systems studies and their associated time frame are presented in Table 1.1.
From this main objective, three (3) specific objectives are then defined:
1. Develop and validate a complete train DC auxiliary systems simulation model based on existing designs.
2. Identify important design considerations for new DC distribution systems.
3. Demonstrate the capabilities of the simulation model for various power systems studies based on railway industry experiences with DC systems and a literature survey.
Table 1.1: Targeted Power System Analysis Power System Study Time Frame
Network Stability (ms) to (s)
Component Sizing (ms) to (h)
Transient Phenomenon
• Overload Current (s) to (min)
• Inrush Current (ms)
• Fault Current (ms) to (s)
• Overvoltage (ms)
1.3 Simulation Tool Selection
The selection of the simulation tool must be done by taking into account the targeted power system studies, the frequency range of the transient events and the characteristics of the available simulation tools on the market. This section presents an overview of the characteristics of the available simulation tools which will lead to the final choice.
1.3.1 Off-Line vs On-Line Simulation
EMT-type (Electromagnetic Transient - type) simulation tools are widely used for load flow, electromechanical and electromagnetic transient phenomenon studies in large power systems such as electric utility generating plant and transmission and distribution networks. Simulation can be Off-Line or On-Line.
Simulations are said to be Off-Line when there is no physical link between the simulation tool and the power systems. Off-Line simulation tools have no time constraints and can be very precise. On-Line simulation tools are synchronized with a real-time clock and can be interfaced with physical devices. The main drawback is the precision constraints due to the synchronism required with the real-time clock [18].
On-Line simulation requires important initial investment. It is useful for testing hardware equipment during testing phases. For design analysis during early project phases, Off-Line simulation is better suited. Therefore, Off-Line simulation is used in this master thesis.
1.3.2 Circuit Equation Formulation
Transient simulation tools must formulate circuit equations and solve them to provide the waveform of the power system state variables to the user. The most commonly used methods are
nodal analysis and state-space method. These methods can be formulated in the
frequency-domain and in the time-frequency-domain. Nodal analysis in power systems results in solving sparse matrices which enhance the capabilities to solve very large scale network. Solving nonlinearities is generally not a problem using nodal analysis formulation. State-space equations generation in large power systems is not an easy task. For large power systems, the computation time required for the formulation of the state-space equations can become very high. It is also not simple to include and to solve nonlinearities using the state-space method [18].
1.3.3 EMTP-type, SPICE-type and General Purpose Tools
Three (3) types of simulation tools are presented in [18] : EMTP-type, SPICE-type and General Purpose Tools.
EMTP-Type tools are based on nodal analysis. EMTP-RV, ATP and PSCAD are examples. All these tools use fixed time-step trapezoidal method to solve the circuit system of equations in the time-domain. EMTP-type tools are designed for power systems application because of the availability of complex models such as machine models, surge arrester, frequency-dependent transmission line models, transformer models with core saturation, and circuit breaker arc models. EMTP-type tools are not intended to study detailed switching behavior in power electronics application [18]. Semiconductors such as diodes, thyristors, and transistors can be modeled using ideal switch and/or their equivalent VI relationships which can provide a smooth switching response and reduce simulation discontinuities leading to unrealistic numerical current or voltage spikes. Some extra components may also be added to take into account losses or the presence of snubber circuits.
type tools (e.g. PSPICE, LTSPICE) are also based on nodal analysis. Most SPICE-type tools also use trapezoidal integration method but unlike EMTP-SPICE-type program they can use a variable integration time-step. It provides an important advantage in solving high level of nonlinearities but can become computer-time consuming. SPICE-type tool are mostly designed for electronic circuits simulation because there is a large amount of device libraries available from manufacturers which can help to avoid the development of user-defined models [18].
MATLAB/Simulink is the most popular general purpose tool. It was not intended to simulate power system transient at first but it have been developed for this application with the SimPowerSystems toolbox. It is flexible and it provides a high level of customization to build user-defined models. The increasing number of users is also an advantage in using MATLAB/Simulink with the SimPowerSystems toolbox because it provides an important community of available models and knowledge. However, it is based on the state-space formulation which is currently a limitation to solve large scale power systems especially with non-linear elements.
For power electronics simulation, both SPICE-type and EMTP-type can be used. Because of the availability of semiconductor device models, SPICE-type is generally selected for application where detailed representation of the device switching behavior is necessary. However, EMTP-type can be used to analyze power electronics converters from a power system standpoint when detailed switching models are not necessary [19].
1.3.4 The Final Choice: EMTP-RV
Despite the fact that EMTP-RV is mainly developed for AC power systems, it has been selected to model railway vehicle DC power systems for the following reasons:
• EMTP-RV provides high capabilities of simulating very large scale power system networks with detailed models [20]: It is suitable to model each vehicle with a sufficient level of details and perform simulation on a train level with the required precision and within an acceptable simulation time.
• Work has already been performed by the Bombardier Aerospace division with EMTP-RV in [14]. Its capabilities have been demonstrated on a first Global Express aircraft benchmark.
• Subcircuit, masking and scripting provide powerful ways to develop user-defined models, calculate parameters automatically and perform parametric studies.
1.4 Methodology
In order to meet the general and the specific objectives, the following steps are followed: 1. Literature Review: A survey of the design issues, available technologies and
solutions in both industry and academic researches on DC power systems is first performed. Railway vehicle DC power systems are in fact not very different as other DC networks and researches related to other DC power systems application can be used as reference for railway application.
2. DC Power System Analysis Review: Based on the literature, standards, field experiments, and railway industry experiences in developing and testing DC systems, a set of power system phenomenon is established and studied from a theoretical standpoint. The investigation on power system behavior using simulation tools
should always be done with an appropriate understanding of the theoretical influence of network parameters.
3. Development of the Simulation Model: Models of the network components are first developed and validated. For each component, an individual literature review is performed to determine model assumptions and to develop accurate models for the application. The validation process is performed based on the expected theoretical model behavior, applicable standards, manufacturer’s data, or field measurements depending on the available information and data in each case. The models are then used to develop different single vehicle models. The complete train model is built by connecting multiple vehicle model blocks.
4. DC Power System Integration Analysis using the Simulation Model: Using the complete train simulation model, multiple power system studies are presented to demonstrate the capabilities and the advantages of the developed train model to investigate different power system phenomena under different operating scenarios. The influence of the network parameters is also analyzed.
1.5 Thesis Structure
The thesis structure is mainly oriented to follow the methodology defined previously. A survey of the literature is first presented to introduce the trend in DC distribution architectures and technologies, and identify major technical integration and operational issues encountered with DC distribution (Chapter 2). Then, power system phenomena are established and studied from a theoretical standpoint to provide an understanding of the influence of network parameters for a proper analysis of the simulation results (Chapter 3). A description of each individual DC auxiliary systems network components is then presented along with the development and the validation of each component models. Three (3) vehicle models and a complete train DC auxiliary systems simulation model are also developed (Chapter 4). Then, the capabilities of the complete train model are demonstrated with multiple examples such as overcurrent protection, ground fault analysis, overvoltage protection, battery sizing, stability, and inrush current analysis (Chapter 5). Recommendations on important simulation integration analysis and guidelines for architecture improvements are finally provided. Further improvements to extend the application of the developed simulation model are also presented (Chapter 6).
CHAPTER 2
LITERATURE REVIEW
There is a clear trend in the industry and into academic researches toward the development of novel DC distribution systems. They are classified here into three (3) categories depending on the network nominal voltage level [21][22]:
• Low Voltage Direct Current (LVDC): Below 1.5 kV • Medium Voltage Direct Current (MVDC): 1.5 kV to 35 kV • High Voltage Direct Current (HVDC): Over 35 kV
It is important to mention here that this is not a standardized classification because there is in fact no standard yet on voltage levels for DC power systems [23].
DC distribution in aircrafts [24][25], unmanned aerial vehicles (UAV) [26], shipboards [27][28], commercial and industrial buildings [29][30][31] as well as in data centers [32][33] are being widely developed. Aircraft, UAV, commercial and industrial buildings, and data center industries are working toward LVDC networks while shipboard industry is mainly developing MVDC power systems. HVDC is used by electric utility for long distance power transmission.
There is currently worldwide effort in standardization of LVDC power systems for data centers and commercial buildings. The European Telecommunications Standards Institute (ETSI) and EMerge Alliance association are both working on the standardization of 380 V DC distribution [33]. According to [32], 380 V is in fact the optimum voltage level for equipment standardization, safety, efficiency, and cost balance for application in data centers.
These new developments are interesting for standardization of on-board DC auxiliary distribution in railway vehicles. Among the topics covered in the literature, a particular attention is paid to technical integration and operational considerations for higher voltage LVDC systems such as fault protection, stability, power quality, grounding/bonding, and safety. Although these considerations will be covered separately, systems integration requires the knowledge of the interrelationship between these considerations.
2.1 Fault Protection
Fault protection in DC systems has been over the past an issue for many power system designers due the lack of general protection and grounding standards compared to AC power systems [34]. Based on the litterature review performed, the problems associated with the detection and isolation of fault in DC systems are divided into three (3) categories: architectural, behavioral, and technological.
Architectural issues are related to the topologies of the DC distribution. MTDC (Multi-Terminal DC) systems (or meshed systems) are widely developed and their protection schemes need to be designed carefully to enhance the system operational performance [35][36][37]. Railway vehicle DC auxiliary distribution can be considered as a MTDC system. The various operating conditions (eg. Normal, Temporary, or Degraded) and the location of the sources and loads should be also considered in protection studies. As for AC systems, both system grounding and bonding considerations should also be included in complete protection analysis [38][39].
Behavioral issues mainly refer to DC system behavior under abnormal conditions. From field testing in railway vehicles and literature review, these power system events have been classified into three (3) categories: slow, medium and fast front transients. Slow front transients (0 – 10 Hz) are voltage and current variations caused by voltage dependent loads, load shedding, converter control, and battery charging and discharging cycles. These are important to be considered for appropriate sizing of the protective devices. Medium front transient (10 Hz – 5 kHz) may be referred mainly as short circuit current and charging (inrush) or discharging current of the filter capacitors [11][26]. Medium front transients should be considered when selecting the settings of protective devices. For example, when backup batteries are directly connected on the DC system, protection study should consider the high level of current provided by the batteries during a short circuit as well as the decay of the current over the time as the battery is discharging [40]. Converter current-limiting behavior is also important to be considered [11]. Fast front transients (5 – 20 kHz) are switching overvoltages [41] and transient recovery voltage at the opening of protective devices [42]. Arcing faults are difficult to classify but should also be considered. At any fault location the arc current from an arcing fault is expected to be smaller than the available bolted fault current for a fault at the same location [43].
Technological problems in protection mainly refer to the commercialy available protection technologies, their limitations and their characteristics in DC systems. Protective devices such as conventional fuses and circuit breakers have been used in railway vehicles auxiliary distribution for the last decades. DC standards for fuses and circuit breakers do exist and DC ratings can upon request be provided in many cases by the manufacturers [44][45]. The detection and arcing mechanisms of these protective devices depend on the circuit parameters (voltage, time-constant and available fault current). As an example, the impact of the circuit time-constant on fuse Time-Current Curve (TCC) is well shown in Fig. 3 of [46]. Time-Current-limiting and non-current-limiting protective devices also exist. Non-current-limiting devices are likely to break the fault current during a steady-state condition while current-limiting devices are likely to break the fault current during a transient condition. Traditional assessment of protective devices performance using AC RMS time-current curves and AC peak let-through curves are limited practices with current-limiting devices in DC systems [44][47]. In fact, selectivity determination of current-current-limiting fuses and current-limiting circuit breakers should be performed by taking into account the energy limitation of the downstream device on the energy seen by the upstream device [47][48]. Since there is no natural zero-crossing, breaking DC current requires to also increase the arc voltage beyond the system operating voltage to quickly force the current towards zero [45]. By looking into the details of [49][50][51], it can be seen that the mechanisms behind DC protective devices are similar to AC current-limiting devices because the latter are built to break the current inside the first half-cycle of the AC waveform.
As of today, there is no standard related to protection analysis in on-board railway DC auxiliary distribution even though DC distribution has been used for many decades. Going with higher voltage auxiliary DC distribution will required the definition of standardized practices because of the inherent safety aspect. For fault analysis, Chapter 16 of the IEEE Std 399 (Brown Book) [52] can be used in reference even if it is not intended at first for railway application. In particular, they recommend the use of simulation tools to perform fault calculation because of the increasing complexity of the industrial and commercial DC power systems.
Finally, secondary effects such as transient overvoltage at fault clearing should be quantified and compared to IEC 60571 [53] standard which specifies voltage tolerance in DC auxiliary system of railway vehicles.
2.2 Stability
Power system stability must be guaranteed under a large number of contingencies [27]. Power system stability is defined as the system ability to reach a new stable operating state after being subjected to a disturbance. In AC power systems, stability is classified into three (3) categories: Rotor Angle Stability, Frequency Stability, and Voltage Stability [54].
In DC systems, rotor angle and frequency stability do not make any physical sense. However, voltage stability should be considered. Voltage stability in DC systems must be treated differently from AC systems because reactive power flow and phase voltage angle do not exist. The active power flow between two (2) nodes in DC systems can be controlled by the voltage magnitude difference between these two (2) nodes or by controlling the current circulating from one node to the other [55].
Power Electronic Converters (PEC) such as Voltage Source Converter (VSC) and Current Source Converter (CSC) can be used to control both the voltage and the current in DC systems. The two commonly used dc bus voltage control schemes are the master-slave method and the droop control. In master-slave control the master is responsible of controlling the voltage and giving the power set-point to the slave converters. Communication between the converters is required in this case. In droop control, all the converters share the power demand from the loads by controlling individually their output voltages. The output voltage of each converter is controlled such as it decreases linearly as the output current increases providing a sharing mechanisms between the converters [56]. Droop control emulates a series resistance at the output of the converters [57].
In DC Distributed Power System (DPS), large Constant Power Load (CPL) supplied by tightly regulated power electronics converter can yield to negative resistance behavior [58]. In railway vehicle, DC loads are classified according to the variation in current demand when their input voltage fluctuates. These are defined in IEEE Std 1476 as constant power, resistive and constant current loads [9]. A survey of different projects shows that as an average 50% of the loads in low voltage auxiliary systems are constant power while 33% are constant current and 17% are resistive loads (Figure 2.1).
The negative resistance behavior of CPL does not mean that the resistance seen is negative (i.e, V/I < 0) but means that the incremental resistance is negative (dV/dI < 0) [59]. Because of the presence of LC filters, the system can oscillate and may become unstable if the negative resistance seen at the input of the equipment cancels the positive resistive losses of the circuit [60]. The destabilizing effect of CPL can also bring the system into a breakdown condition because CPL act as a positive feedback following a disturbance [59].
Researches have been performed to determine stability criteria for both small and large disturbances as well as to develop converter stable control schemes [56][59][61]. For large multi-converter DC power systems, simulation provide a good way to assess stability under small and large disturbances and under multiple contingency scenarios.
Constant Power (50%) Resistive (17%) Constant Current (33%)
Figure 2.1: Typical Low Voltage Auxiliary Load Distribution in Rapid Transit Train
2.3 Power Quality
Power Quality is highly related to power system availability. Power quality is defined in [62] as the combination of voltage and current quality. This definition is not unanimously recognized in the industry but it is somehow what makes the most sense. In DC systems, it is defined here as the deviation of the voltage and the current magnitude from their nominal or ideal values.
Current quality phenomena such as overload, inrush and fault currents have been introduced in section 2.1 because they are all part of protection studies. Harmonic current distorsion should also be added to the list of current quality phenomena. Harmonics will not be considered in this project but the influence of the Electromagnetic Interference (EMI) filters on power system transients will be studied. Only voltage quality is covered in this section. Voltage quality phenomena can be divided into two (2) categories: variations and events [62].
• Voltage Variations: Voltage magnitude variation refers to slow voltage deviation while voltage fluctuation refers to fast voltage deviation from their ideal values. Harmonic distorsion, ripples and high frequency noise are also categorized as voltage variations.
• Voltage Events: A voltage event is generally sporadic. It is characterized by a deviation magnitude, a duration and a Vt-integral value which combines both the magnitude and the duration of the event in a single indicator. Voltage events examples are: interruption of the supply voltage, undervoltage, voltage magnitude steps, overvoltages, impulsive voltage transients (eg. Lightning), and oscillatory transients (eg. switching transients).
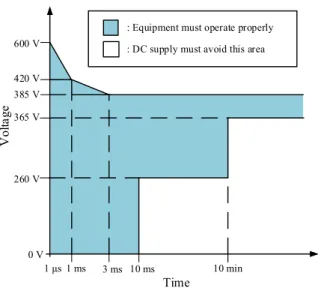
Voltage quality requirements can be represented by a voltage against time curve. In railway vehicles auxiliary distribution, the voltage tolerance envelope used is depicted in Figure 2.2. It is a personal representation of the most restrictive voltage tolerance described in the IEC 60571 standard [53]. The voltage tolerance envelope proposition of the Electric Power Research Institute (EPRI), Power Standards Lab (PSL) and NTT Facilities for new 380 V distribution system in data centers is also shown in Figure 2.3 [33]. No interruption is allowed and only fast voltage transient lasting less than 3 ms can exceed 385 V (1.01 pu). Therefore, the voltage must be tightly controlled around the nominal voltage of 380 V.
1.0 0.9 0.8 0.7 0.6 0.5 0.4 0.3 0.2 1.1 1.2 1.3 1.4 100 ms 1 s 10 s 100 s 30 ms V olta ge (p .u .) Time 10 ms
: DC supply must avoid this area : Interruption Zones (depend on load class) : Equipment must operate properly
0.1
600 V 10 ms 10 min 3 ms V olta ge Time 1 ms
: Equipment must operate properly : DC supply must avoid this area
1 μs 420 V 385 V 365 V 260 V 0 V
Figure 2.3: Voltage Quality Requirements in Data Centers from EPRI, PSL and NTT
2.4 Grounding and Bonding
The main reasons for grounding and bonding is to ensure human safety and reduce fire-hazards. Other reasons include improving system tolerance to electrostatic and lightning discharges, reducing radiated and conducted electromagnetic emissions and system susceptibility, improving system availability, and reducing equipment damage under fault [63]. Grounding and bonding definitions are however often confused. According to [38], grounding is in fact bonding to earth. Grounding gives a reference to ground. From a human safety standpoint, grounding reduces the touch-potential between equipment and the ground while bonding reduce the potential difference between different equipment especially under fault conditions. Both grounding and bonding also have an impact on the available type of fault and fault magnitude. This in turn influences the speed of operation of the overcurrent protective devices which is important to consider in both human and equipment protection analysis [38][39].
Grounding and bonding concept definition in railway vehicles must be done by considering the DC traction system grounding techniques which differ between transit authorities. In modern DC traction systems, the return is virtually never grounded but in old installations it can be grounded directly or through a diode. The trend is to keep the system ungrounded under normal conditions in order to minimize stray current between running rails (or vehicles) and the ground. However, when the rail-to-ground voltage is considered unsafe (typically around 60 V to 90 V), the negative lead is grounded automatically using protective relays and switching devices [6].
The definition of a new higher DC voltage standard in railway vehicle auxiliary distribution must consider grounding and bonding concepts carefully as it is done for the new 380 V distribution systems in data centers [63][64]. There is actually no standard for grounding and bonding in railway vehicles. However, even if standard IEC 60364-1 [65] is not intended to cover rolling stock electrical systems, the type of system and equipment grounding presented in this standard can be considered for grounding design within rail environment operational considerations. Depending on design considerations and particularities to transit authorities, the reference may also be provided by a grounding plane systemand/or the vehicle chassis itself.
Before to present system and equipment grounding and bonding concepts, general characteristics of DC systems should be introduced. DC systems may be composed of multiple conductors having the following functions: line conductor(s) (L+ or L-), midpoint conductor (M), and protective conductor (PE). PEL and PEM conductors are the combination of protective/line and protective/mid-point conductors respectively. IEC 60364-1 defines two (2) conductors arrangement for DC systems: Two-Wire and Three-Wire (Figure 2.4) [65].
The choice of the conductor arrangement leads to the second step which is the selection of grounding and bonding methods. The grounding point may be at one pole or at the mid-point and in both cases can be directly connected to the ground or through a high resistance. The system can also be floating or isolated from the ground [63]. It leads to the definition of multiple types of grounding/bonding methods according to IEC 60364-1. The main three (3) types are [65]:
• TN: System direct connection of one point to ground (T) and equipment direct connection to the system grounding point (N).
• TT: System direct connection of one point to ground (T) and equipment direct connection to a dedicated grounding point (T).
• IT: System floating or high impedance connection of one point to ground (I) and equipment direct connection to a dedicated grounding point (T).
It has been found in the literature that authors do not agree on the safest choice of grounding/bonding methods for DC systems. For example, the authors in [63] state that the high resistance mid-point grounding (mid-point IT) should be used in new 380 V distribution system because it increases personal safety by reducing the touch potential and eliminating the arc-flash
hazard for a first fault to ground. At the opposite, the authors in [64] state that negative pole TT and TN systems should be used in new 380 V distribution system because IT grounding method requires the use of a ground fault detector to detect the first ground fault.
Another grounding method in DC system which is not directly covered in IEC 60364-1 is shown in Figure 2.5. This grounding scheme is widely used in DC auxiliary power systems for generating station [66]. System grounding is done through high resistances connected to the positive and negative leads and a Ground Fault Detector (GFD). This configuration is interesting because it uses only two wires and provides a connection point to detect ground fault. High resistance grounding can enhance the system availability because it allows the operation under a single fault to ground condition. A similar but not identical configuration is proposed by EPRI and Emerson Network Product for ±190 V (380 V) DC distribution in data centers [32].
In high resistance grounding networks, the detection of the first fault to ground is mandatory because a second fault to ground can lead to undesired high fault energy conditions. Two-pole circuit breakers interrupting capability is generally not guaranteed under such condition because the location of the two (2) faults may lead to a single pole interruption of the circuit breaker while it is rated to break the fault current using its two (2) poles [67].
It is finally important to mention that grounding and bonding architecture should ensure that the touch potential in fault condition is below the maximum human safety level of ventricular fibrillation as defined in IEC 60479-1 [68].
L+ L- or PEL L+ M or PEM
L-(a) Two-Wire System (b) Three-Wire System
L+
L-GFD
Figure 2.5: High Resistance Grounding DC Systems through a Ground Fault Detector
2.5 Safety
Safety is the number one priority of vehicle manufacturers. Two (2) important terms must be understood in safety: Hazard and Risks. Risks identification requires to translate hazards into risks. Hazard refers to “a condition or circumstance that could lead to an unplanned or undesired event”. Risk is defined as the “expression of the impacts of an undesired event […] in terms of severity and likelihood” [69].
The United States Federal Transit Administration provides in their 2009 rail safety statistics report interesting data on safety in rail transit (heavy and light rails) for the period of 2003 to 2008 [70]. Figure 2.6 shows the US injury risk profile in rail transit for this period. The inner circle “Risk to” represents who is affected by the injury risk while the outer circle “Risk from” shows who is responsible for causing the risks.
This report is analyzed here by taking into account the risks that can be related to railway vehicle electrical system failures. First, the risks related to vehicles are most likely to affect passengers and workforce. On this, Figure 2.6 shows that 55% of all the injury risks are to passengers while 5% are to workforces. Of all the injury risks to passengers, 49% are related to workforce behavior which includes poor maintenance and 9% is related to equipment failure. Among the 55% of all passenger injury risks, 255 cases are the consequence of fires (Figure 2.7).
The safety in electrical system is highly related to appropriate grounding and protection practices [34]. Equipment and human protection should both be part of protection studies [71]. Equipment should be protected against abnormal operating conditions which could lead to equipment failures, potentially fires, and human safety hazards. For example, overcurrent, overvoltage, and arcing fault may lead to equipment failure and possibly fires which can in turn
cause service interruption or in worst cases human injuries or fatalities. Arc-flash and touch-potential (shock) hazards are also direct causes of human injuries or fatalities.
Figure 2.6: US Injury Risk Profile in Rail Transit: 2003-2008 [70]
Figure 2.7 Passenger Injuries by Mode in Rail Transit: 2003-2008 [70]
Electrical safety hazards must be “analyzed, assessed, prioritized, and resolved, accepted or tracked” [69]. In order to identify and mitigate the risks, vehicle manufacturers perform Failure Mode and Effects Criticality Analysis (FMECA), Failure Modes and Effects Analysis (FMEA) and Fault Tree Analysis (FTA). FMECA is done to guarantee safe and reliable operation of the manufactured vehicles. It is based on the assumption that any piece of hardware or software will sooner or later fail which will affect the operation of one of the train system or in worst cases the complete train consist. FMEA is performed to ensure that the design will execute the required functions. It is based on the assumption that eventually design errors will impact the required functions. FTA is finally performed to identify the sequence of events that may lead to the loss of a pre-determined system function.
In accident analysis research, FTA is classified as a non-systemic accident analysis approach or more precisely as a sequential (or cause-effect) accident modeling method [72]. Sequential accident models represent the sequence of events leading to an accident where the links between the cause and the effect are simple and deterministic. Other models such as epidemiological accident models and systemic accident models have been developed with different objectives to overcome the limitations of the sequential approach [73].
Sequential accident models are widely used in engineering because they are easy to represent graphically. Nevertheless they should be analyzed within the knowledge of their limitation especially for complex dynamic systems. Detailed simulation models can be used as an efficient complementary tool to identify, analyze, assess, and resolve safety hazards at an early design stage such as it reduces the cost of the mitigation process. The main advantages of simulation is the ease to observe the evolution of the electrical state variables at any location in the power system.
CHAPTER 3
DC POWER SYSTEM ANALYSIS
In this chapter a set of DC power system phenomenon is established and studied from a theoretical standpoint. The investigation on power system behavior and problem mitigation using simulation tools should consider the theoretical influence of network parameters. The power system transient phenomena presented in this section are based on railway industry experience in manufacturing and testing DC systems, field experiment as well as a literature review related to other DC system applications.
3.1 Stability
The general concept of stability in DC systems has been introduced in section 2.2. The stability is now studied from a mathematical standpoint. Stability criteria are presented to understand the various parameters behind stability as well as to introduce simple criteria which can be used to reduce the potential of instability at the design phase but also to analyze the simulation results. The symbols used in this section are presented in Table 3.1.
Table 3.1: Symbols used for Stability Analysis
Description Symbol
Equivalent Negative Resistance of the Load Rin
Output Power of the Power Electronic Converter PL
Constant Power Load (CPL) Power Set-Point PCPL
Resistive Load Power PR
Constant Current Load (CCL) Power Set-Point PCCL
Source Current iin
Constant Current Load (CCL) Equivalent Current Set-Point ICCL
Power Electronic Converter Efficiency ηc
Load Voltage vo
Source Voltage vs
Equivalent Circuit Resistance (Source, Cable and Inductor ESR) Req
Equivalent Filter Inductance Leq
Equivalent Filter Capacitance Ceq
Capacitor ESR Rceq
3.1.1 Sokal Criterion
The Sokal Criterion [60] has been developed in 1973 and is the first DC voltage stability criterion found in the literature. It is based on the equivalent circuit of Figure 3.1. The negative resistance (Rin) is defined by (3.1) using Figure 3.2 and by taking the following assumptions:
• The load power (PL) at the output of the power electronic converter (PEC) does not
depend on the PEC input voltage (vo).
• The input power of the PEC (PCPL) is also independent of the PEC input voltage (vo).
• The converter efficiency (ηc) is independent of vo (generally a weak coupling).
2 2 c o o in L CPL v v R P P η = = (3.1)
From [60] oscillations will not occur if:
(
)
2 o eq ceq eq CPL eq eq eq ceq v R R C P L C R R + < + (3.2) vo -Rin Rceq Ceq vs Req Leq PCPLFigure 3.1 Sokal Criterion System Configuration
v
oP
CPLP
L3.1.2 Emadi et al. Criterion
The approach presented by Emadi et al. [74] has been introduced in the context of the development of vehicular DC power systems. In their definition of voltage stability, the authors neglect the capacitor ESR (Equivalent Series Resistance) but they add the influence of what they call “constant voltage loads”. The use of the term “resistive load” is preferred here to the use of the term “constant voltage load” because the power of resistive load is voltage-dependent.
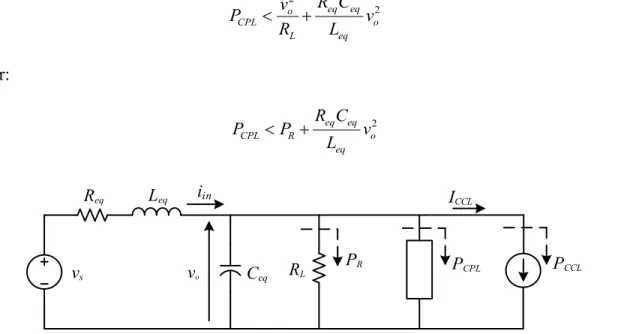
The circuit used to establish this criterion is shown in Figure 3.3. It can be demonstrated (ref. Appendix A) that necessary and sufficient condition for small-signal stability is given by [74]:
2 2 eq eq o CPL o L eq R C v P v R L < + (3.3) Or: 2 eq eq CPL R o eq R C P P v L < + (3.4) iin PCPL PCCL ICCL Req Leq vs vo Ceq RL PR
Figure 3.3 Emadi et al. Criterion System Configuration with Constant Current Load
3.1.3 Stability Analysis
By analyzing and comparing the Sokal [60] and Emadi et al. [74] criteria, design considerations for DC voltage stability margin improvements are established:
• For CeqReqRceqsmall compared to Leq, increasing capacitor ESR (Rceq) enhance stability
margin according to (3.2). However, filter effectiveness will be reduced. For example, changing an old electrolytic capacitor with a high ESR by a new film capacitor with low ESR should be done by keeping in mind that stability margin will be reduced. This case has already been observed experimentally in the past.
• According to (3.4), increasing Req improves stability margin. Adding a series
resistance is not desirable because it increases losses, generates heat and reduces system efficiency. However, increasing Req by increasing the converter internal droop
as presented in section 2.2 can enhance stability without inserting extra losses. Nevertheless, the internal droop cannot be increased infinitely. The maximum droop value depends on the minimum load voltage and maximum power transfer requirements [61].
• According to (3.4), increasing Ceqor decreasing Leq improves stability margin. This is
often the easiest solution but it is important to keep in mind that Ceq and Leq both
determine the filter cutoff frequency. Increasing Ceq can also lead to high inrush
current which may have to be managed by adding extra components.
• Increasing the system voltage (vo) according to (3.4) can also improve system
stability. However, it is a design choice only available at the beginning of a project. This is generally not an option.
• Adding resistive loads (PR) improves system voltage stability. As can be seen in (3.4)
the presence of PR increases the amount of constant power loads (PCPL) that can be
connected on the system thus improving system voltage stability margin. However, this is also not really an option especially if resistive loads are not necessary for system functionalities.
• Controlling the internal power electronic converter of the load such as it does not behave as a pure constant power load seen from the DC power system is also a solution which is often preferred in late design phases. An example of control strategy to eliminate the negative impedance behavior over a specified bandwidth of a three-phase synchronous machine drive can be found in [75].
Finally, constant current loads (CCL) are not considered because they do not impact small-signal stability under linear assumptions. Appendix A shows how the CCL term vanishes into the mathematical formulation of the small-signal stability problem. However, during simulation in section 5.2.1, it will be observed that it is not the case in the presence of non-linear series resistive elements such as diode or converter variable output droop resistance.
3.2 Current Transient
Current transients are very important during components sizing. Moreover, overcurrent protection system design must consider current transients to avoid power system blackout, undesirable trip and poor coordination. Four (4) major types of current transient events are generally recognized: overload, inrush current, short-circuit, and arcing fault. This section covers each of these individually.
3.2.1 Overload
Overload condition refers to low and slow increase in the load demand. It can be controlled or not. For example, a controlled overload can occur when a major load or multiple loads are voluntarily increased to perform the required system functionalities. An uncontrolled overload can occur during degraded operating mode such as the loss of one or multiple sources or during long duration voltage drops due to the increase of the current of constant power loads.
Overload conditions need to be taken into account in battery and converter sizing. These overloads can also lead to undesired trip of the protection system if the load voltage dependency is not considered during protection system design.
From a theoretical standpoint, overloads from constant power loads are the most interesting to study. In fact, the current drawn by these loads increases/decreases when the voltage decreases/increases. Analytically, these loads react to voltage fluctuation following:
P i
v
= (3.5)
Resistive loads will act at the opposite of constant power loads following Ohm’s law:
v i
R
= (3.6)
Constant current loads simply draw a constant current value independently of the voltage magnitude.
3.2.2 Inrush
Inrush current is typically a very fast transient with time-constant less than few milliseconds. Inrush current is likely to happen when filter capacitors are energized.
Important inrush current due to the load front-end LC filters has been observed in railway vehicle DC auxiliary systems when simultaneously switching ON multiple DC loads. Undesired circuit breaker trips have also been observed during field testing. Analytical equations based on simple circuit equations can be derived to provide a better understanding of the inrush current in DC systems. All the equations presented in this section have been validated with EMTP-RV.
The simple series RLC-circuit of Figure 3.4 is used to study analytically capacitor inrush current when the switch (S) is closed. The initial inductor current (iL(0)) is neglected. The initial
capacitor voltage (vC(0)) is not neglected in order to consider capacitor trapped charge.
R
S
v
C(0)/sLi
L(0)L
C
i
V
SFigure 3.4 Series RLC-Circuit for Capacitor Inrush Current Calculation The inrush current can be defined in the Laplace domain by:
( )
(
( )
)
2 0 1 S C V v L I s R s s L LC − = + + (3.7)The roots (λ1,2) of this system are the zeros of the characteristic equation:
1 2, 2RL
λ = − ± ∆ (3.8)
With ∆ being calculated by (3.9) and defines the inrush current dynamic response which can be critically damped (3.10), damped (3.11), or oscillatory (3.12).