HAL Id: hal-00331080
https://hal.archives-ouvertes.fr/hal-00331080
Submitted on 2 Feb 2005
HAL is a multi-disciplinary open access
archive for the deposit and dissemination of
sci-entific research documents, whether they are
pub-lished or not. The documents may come from
teaching and research institutions in France or
abroad, or from public or private research centers.
L’archive ouverte pluridisciplinaire HAL, est
destinée au dépôt et à la diffusion de documents
scientifiques de niveau recherche, publiés ou non,
émanant des établissements d’enseignement et de
recherche français ou étrangers, des laboratoires
publics ou privés.
Distributed under a Creative Commons Attribution| 4.0 International License
On the generation of solitary waves observed by Cluster
in the near-Earth magnetosheath
J. S. Pickett, L.-J. Chen, S. W. Kahler, O. Santolík, M. L. Goldstein, B.
Lavraud, Pierrette Décréau, R. Kessel, E. Lucek, G. S. Lakhina, et al.
To cite this version:
J. S. Pickett, L.-J. Chen, S. W. Kahler, O. Santolík, M. L. Goldstein, et al.. On the generation of
solitary waves observed by Cluster in the near-Earth magnetosheath. Nonlinear Processes in
Geo-physics, European Geosciences Union (EGU), 2005, 12 (2), pp.181-193. �10.5194/npg-12-181-2005�.
�hal-00331080�
SRef-ID: 1607-7946/npg/2005-12-181 European Geosciences Union
© 2005 Author(s). This work is licensed under a Creative Commons License.
Nonlinear Processes
in Geophysics
On the generation of solitary waves observed by Cluster in the
near-Earth magnetosheath
J. S. Pickett1, L.-J. Chen1, S. W. Kahler1, O. Santol´ık1,2, M. L. Goldstein3, B. Lavraud4, P. M. E. D´ecr´eau5, R. Kessel3, E. Lucek6, G. S. Lakhina7, B. T. Tsurutani8, D. A. Gurnett1, N. Cornilleau-Wehrlin9, A. Fazakerley10, H. R`eme11, and A. Balogh6
1Department of Physics and Astronomy, The University of Iowa, Iowa City, IA, USA 2Faculty of Mathematics and Physics, Charles University, Prague, Czech Republic 3NASA Goddard Space Flight Center, Greenbelt, MD, USA
4Los Alamos National Laboratory, Los Alamos, NM, USA 5LPCE et Universit´e d’Orl´eans, Orl´eans, France
6The Blackett Laboratory, Imperial College, London, UK 7Indian Institute of Geomagnetism, Colaba, Mumbai, India
8Jet Propulsion Laboratory, California Institute of Technology, Pasadena, CA, USA 9CETP/UVSQ, V´elizy, France
10Mullard Space Science Laboratory, University College London, Holmbury St. Mary, UK 11CESR, 9 ave. du Colonel Roche, 32018 Toulouse C´edex 4, France
Received: 18 October 2004 – Revised: 19 January 2005 – Accepted: 20 January 2005 – Published: 2 February 2005 Part of Special Issue “Advances in space environment turbulence”
Abstract. Through case studies involving Cluster waveform
observations, solitary waves in the form of bipolar and tripo-lar pulses have recently been found to be quite abundant in the near-Earth dayside magnetosheath. We expand on the re-sults of those previous studies by examining the distribution of solitary waves from the bow shock to the magnetopause using Cluster waveform data. Cluster’s orbit allows for the measurement of solitary waves in the magnetosheath from about 10 REto 19.5 RE. Our results clearly show that within
the magnetosheath, solitary waves are likely to be observed at any distance from the bow shock and that this distance has no dependence on the time durations and amplitudes of the solitary waves. In addition we have found that these same two quantities show no dependence on either the ion veloc-ity or the angle between the ion velocveloc-ity and the local mag-netic field direction. These results point to the conclusion that the solitary waves are probably created locally in the magnetosheath at multiple locations, and that the generation mechanism is most likely not solely related to ion dynam-ics, if at all. To gain insight into a possible local genera-tion mechanism, we have examined the electron differential energy flux characteristics parallel and perpendicular to the magnetic field, as well as the local electron plasma and
cy-Correspondence to: J. S. Pickett
(pickett@uiowa.edu)
clotron frequencies and the type of bow shock that Cluster is behind, for several time intervals where solitary waves were observed in the magnetosheath. We have found that solitary waves are most likely to be observed when there are counter-streaming (∼ parallel and anti-parallel to the magnetic field) electrons at or below about 100 eV. However, there are times when these counterstreaming electrons are present when soli-tary waves are not. During these times the background mag-netic field strength is usually very low (<10 nT), implying that the amplitudes of the solitary waves, if present, would be near or below those of other waves and electrostatic fluctua-tions in this region making it impossible to isolate or clearly distinguish them from these other emissions in the waveform data. Based on these results, we have concluded that some of the near-Earth magnetosheath solitary waves, perhaps in the form of electron phase-space holes, may be generated lo-cally by a two-stream instability involving electrons based on the counterstreaming electrons that are often observed when solitary waves are present. We have not ruled out the pos-sibility that the solitary waves could be generated as a re-sult of the lower-hybrid Buneman instability in the presence of an electron beam, through the electron acoustic mode or through processes involving turbulence, which is almost al-ways present in the magnetosheath, but these will be exam-ined in a more comprehensive study in the future.
1 Introduction
The multi-spacecraft Cluster mission is providing insight into numerous geophysical processes occurring in the vicin-ity of Earth (e.g., refer to Ann. Geophys., special issue Vol-ume 19, Nos. 10/12, 2001 and VolVol-ume 22, No. 7, 2004 fo-cused on Cluster). Among the new results provided by Clus-ter are those devoted to or including observations of electro-static solitary waves in the near-Earth magnetosheath, auro-ral zone/near-Earth plasma sheet and magnetopause (Pickett et al., 2003, 2004a, b; Cattell et al., 2003), and in association with SLAMS (Short Large Amplitude Magnetic Structures) observed in the quasi-parallel foreshock region (Behlke et al., 2004). The magnetosheath solitary waves are of partic-ular interest because their pulse time durations are signifi-cantly shorter than those found in the other regions around Earth (Pickett et al., 2004b). These isolated pulses, primarily bipolar (one positive peak and one negative peak) and tripolar (two positive peaks and one negative peak, or vice versa), are of the order of tens to a few hundreds of µs in duration in the near-Earth magnetosheath. This is in contrast to the distant magnetosheath where the solitary waves observed by Geotail were found to have pulse widths of order 1–2 ms (Kojima et al., 1997). However, it is doubtful that the plasma wave instrument on Geotail would have measured solitary waves with time durations of 10 s to 100 s of µs since the instru-ment had a sampling frequency of 12 kHz and a bandwidth of only 10 Hz to 4 kHz .
The generation of solitary waves and the role of solitary waves in other geophysical processes taking place in the magnetosheath have not been explored in depth. Under-standably, it is extremely difficult to untangle all of the wave modes observed in the magnetosheath because the spectra, both at low and high frequencies, are usually dominated by turbulence or turbulent-like features, both in the wave electric and wave magnetic fields. Some progress on uncovering the wave modes in the magnetosheath low frequency measure-ments has led to some quite surprising results using the wave telescope and k-filtering techniques, e.g., see Glassmeier et al. (2001) and Sahraoui et al. (2003). The latter have found that at any one frequency, there can be a superposition of more than one mode, e.g., dominant mirror mode and Alfv´en and slow modes.
At higher frequencies, the magnetosheath spectrum is usu-ally dominated by what was previously termed Broadband Electrostatic Noise (BEN). Rodriguez (1979) used plasma wave measurements from the Imp 6 satellite to characterize BEN observed in the magnetosheath at RE<30 (similar to
Cluster) as being almost continuously present with broad-band (20 Hz to 70 kHz) rms field intensities. They found that the BEN usually consisted of three components: 1) a high frequency (≥30 kHz) component peaking at the plasma frequency, 2) a low frequency component with a broad in-tensity maximum below the nominal ion plasma frequency, and 3) an intermediate component in the range from the ion plasma frequency up to the electron plasma frequency. We now know that part of the BEN, at least some of the higher
frequency part extending up to as much as 40–60 kHz, which is also near or higher than the typical electron plasma fre-quency in the magnetosheath, is a result of the isolated soli-tary waves imbedded in the wave field as detailed in Pickett et al. (2003). The remainder of the wave electric field usu-ally consists of waves with frequencies around 1–3 kHz, the mode identification of which has still not been made, as well as short bursts of lion roars around a few Hundred Hz (also clearly seen in the wave magnetic field data) (Tsurutani et al., 1982; Maksimovic et al., 2001) and electron cyclotron waves around the local electron cyclotron frequency.
The primary purpose of this paper is to report the results of a survey in which we characterize the solitary waves ob-served by Cluster within the magnetosheath from the bow shock to the magnetopause in terms of numbers, amplitude and time duration. Complementary to this we look at these same quantities in relation to the local ion velocity and the angle of the ion velocity to the magnetic field direction. By analyzing these characterizations, we will be in a position to argue whether these solitary waves are being locally pro-duced and whether their generation is controlled by ion dy-namics. The outline of our paper is as follows. The primary instrumentation involved in making the measurements perti-nent to this study will first be discussed. This will be fol-lowed by the presentation of a sample event in which many solitary waves are observed in the magnetosheath, with sup-porting wave, electron density, ion, electron and magnetic field data also being provided. The results of the survey dis-cussed above from a few magnetosheath passes are given in the next section. This is followed by an analysis of the survey results and a discussion of the implications of those results. We end with a summary of our results and conclusions.
2 Instrumentation
In order to observe the short time duration bipolar and tripo-lar pulses (solitary waves) in the near-Earth magnetosheath, we require a waveform receiver with wide bandwidth and high time resolution. Cluster’s Wideband (WBD) Plasma Wave Receiver (Gurnett et al., 1997, 2001) is particularly well-suited for these measurements since one of its modes is a 77 kHz bandpass filter with a sampling frequency of 219.5 kHz which is achieved primarily through the use of downlinking the data directly to a receiving station on the ground. In this mode the waveforms are continuously sam-pled for ∼9.9 ms, followed by a gap of 69.5 ms, comprising a total cycle time of 79.4 ms. Because of viewing limitations of the receiving ground stations, the typical measurement pe-riod for any WBD operation is on the order of 1–4 h. Thus, WBD data are not usually obtained from bow shock to mag-netopause in one data interval.
WBD’s measurements are made along one axis only, that being within the spin plane of the spacecraft. Cluster WBD was hard wired to measure only the average potential be-tween the two spheres on one antenna, thus preventing the possibility of making interferometry measurements on just
one spacecraft. Interferometry measurements are typically made by comparing the two waveforms obtained by mea-suring the potential between each sphere and the spacecraft where the spheres are located at or near the end of a single electric field antenna boom. Since WBD cannot be operated in an interferometry mode, this means that the instrument on one spacecraft is unable to provide velocities of the solitary waves, and thus their parallel widths, as has been done for several studies found in the literature (e.g., Franz et al., 1998; Ergun et al., 1998; Cattell et al., 1999). On the other hand, most waveform receivers that make interferometry measure-ments in the magnetosheath do not have the capability of the wider bandwidth required to see such short time duration pulses, or if they do, take them in short duration bursts that do not allow for continuity of measurement across large ex-panses of the magnetosheath. Although Cluster WBD could carry out an interferometry measurement by using two sepa-rate spacecraft and noting the propagation time of a solitary wave from one spacecraft to the next, we believe the dis-tances between the two spacecraft are far too great based on our initial attempts to do this. The reader is referred to Pick-ett et al. (2004a) for a discussion of a study where limited success was achieved in doing this in the auroral zone.
The WBD instrument employs an AGC (automatic gain control), implemented in hardware, which provides 75 dB of selectable gain in addition to the 48 dB of instantaneous dy-namic range for its measurements. Gain updates are made, as necessary, in order to keep the wave amplitude in the mid-range of the instantaneous dynamic mid-range. Gain is automat-ically added or subtracted in steps of 5 dB, with a possible 15 steps (0 to 75 dB). The gain update rate is always set at the fastest rate, i.e., every 1/10 of one second, in the magne-tosheath where short duration waves, such as solitary waves are often dominant. Receiver saturation can occur at the input at the 2 V level, providing a maximum peak-to-peak measurement of about 73 mV/m, with 0 dB gain added and assuming an effective antenna length equal to the physical length of 88 m, before clipping occurs at the output. To min-imize nonlinear effects due to saturation of the amplifiers, the amplifiers were designed so that their maximum ampli-tude range is greater than the maximum range of the digi-tized signal output by the A/D converter. Thus waveforms may be clipped (not fully resolved by the 8 bits available) even though the receiver is not in saturation. The lowest am-plitude measurement possible is on the order of 0.001 mV/m peak-to-peak. However due to the ever present electrostatic fluctuations that are found in the magnetosheath, the lowest possible solitary wave that could be resolved in the magne-tosheath is usually on the order of 0.01 mV/m peak-to-peak. The filters employed in the 77 kHz bandwidth mode allow for the detection of pulses up to at least their RC-constant around 500 microseconds without confusing filter effects, such as slow responses to pulses, ringing of filters caused by pulses, and relaxation of filters after the pulse has passed, which have been thoroughly tested on the ground in order to substantiate that the pulses observed in space are geophys-ical (D. Kirchner, personal communication, 2004). Since
the magnetosheath pulses are usually of the order of 0.01 to 1 mV/m (Pickett et al., 2004b, Fig. 3a), the likelihood that many pulses will be missed due to clipping or saturation of the receiver is relatively low. On the other hand, several pulses could be missed because of a low amplitude near the level of other electrostatic fluctuations, but we will discuss this point further when describing the actual measurements.
Supporting data for the WBD measurements are provided by the Cluster Fluxgate Magnetometer, FGM (Balogh et al., 1997), the Spectrum Analyzer of the Spatio-Temporal Anal-ysis of Field Fluctuation experiment, STAFF (Cornilleau-Wehrlin et al., 1997), the Whisper Sounder (D´ecr´eau et al., 1997), the Plasma Electron And Current Experiment, PEACE (Johnstone et al., 1997), and the Cluster Ion Spec-trometry experiment, CIS (R`eme et al, 2001). We use the magnetic field vector provided by the FGM experiment at spin resolution (∼4 s) to obtain total magnetic field strength, the value of the electron cyclotron frequency and the angle between the electric field antenna and the magnetic field. In its normal mode, the STAFF-SA experiment provides the 3-axis magnetic (from tri-axial search coil magnetometers) and 2-axis electric (from the EFW electric field antennas) spec-tral matrix every 4 s in the frequency range 8 Hz to 4 kHz. From these data the wave normal and Poynting vectors can be obtained, as well as the ellipticity and planarity of the waves. The Whisper Sounder provides the electron plasma frequency, and thus electron density, every 52 s in the range of 2 kHz to 80 kHz by means of a relaxation sounder.
The CIS instrument consists of a Hot Ion Analyzer (HIA) and a time-of-flight COmposition and DIstribution Function analyzer (CODIF), which together provide the full three-dimensional ion distribution with one spacecraft spin (about 4 s) resolution. HIA has large energy and angular resolutions adequate for ion-beam and solar wind measurements, but without mass resolution. CODIF measures the distributions of the major ions with energies from about 0 to 40 keV/e with medium angular resolution. The PEACE instrument provides the electron distribution function in the energy range from 0.6 eV to ∼26 keV with an integration time of one satellite spin period (∼4 s). The PEACE instrument consists of two sensors: LEEA (Low Energy Electron Analyser) is designed to specialize in coverage of the very lowest electron ener-gies (0.6–9.45 eV) and HEEA (High Energy Electron Anal-yser) is specialized in the upper end of the electron energy spectrum, although both sensors can cover the full energy range. In certain circumstances, PEACE can obtain a 3-D phase space distribution of particles at one-half spin reso-lution (∼2 s); however, the normal mode is spin resoreso-lution. Because the resolution of the electron and ion data are not sufficient to investigate the generation of the solitary waves at the micro scale (time scale of the solitary waves), we will take the macro scale approach to investigate their generation, i.e., analyze data over several minutes or hours duration from several events and look for consistent patterns.
Finally, interplanetary magnetic field and plasma data along with a 3-D bow shock model are used to determine quasi-perpendicular and quasi-parallel regions of Earth’s
20 40 60 80 F re q u e n c y ( k H z ) 10-17 10-16 10-15 10-14 10-13 10-12 S C 3 S a m b a Cluster WBD: 26 March 2002 V2 m-2 Hz-1 20 40 60 80 F re q u e n c y ( k H z ) 03:15 03:20 03:25 03:30 03:35 03:40 03:45 03:50 10-17 10-16 10-15 10-14 10-13 10-12 S C 4 T a n g o RE MLAT MLT L 14.94 14.04 10.48 15.90 14.99 13.78 10.48 15.90 15.04 13.53 10.49 15.90 15.08 13.28 10.50 15.90 15.13 13.04 10.50 15.90 15.18 12.81 10.51 16.00 15.23 12.58 10.51 16.00 15.27 12.36 10.52 16.00 0.0008 0.0016 0.0024 0.0032 0.0040 -0.8 -0.6 -0.4 -0.2 0 0.2 0.4 E le c tr ic F ie ld ( m V /m ) Start: 2002-03-26 03:26:22.181 UT
Seconds After Start
0 6 7 8 9 10 11 12 B -E z A n g le (d e g ) SC4 Bipolar Pulse Duration ~ 80 :s Bipolar Pulse Duration ~ 155 :s (b) (a)
Fig. 1. (a) WBD spectrogram of plasma waves observed on 26
March 2002 as Cluster spacecraft 3 (top panel) and 4 (bottom panel) crossed into the magnetosheath at about 03:19 UT. Broad-band waves up to and greater than the electron plasma frequency (white line) are observed in the magnetosheath on both spacecraft.
(b) A 4 ms portion of the waveforms from which the spectrograms
in (a) were produced. Note the short duration bipolar pulses seen throughout the 4 ms interval. These bipolar pulses are the primary reason for the broadbands seen in (a).
bow shock. Magnetic field data from the Wind MFI (Lep-ping et al., 1995) and ACE MAG (Smith et al., 1998) exper-iments were propagated to Earth using a delay time simply given by t=d/vsw, where d is the distance between Wind or
ACE and Cluster and vswis the average solar wind speed in
the x-direction over the intervals of solitary waves from Wind SWE (Ogilvie et al., 1995) or ACE SWEPAM (McComas et al., 1998). A 3-D bow shock model was constructed from the original Fairfield (1971) 2-D model corrected for pres-sure and with axial symmetry assumed. If the angle, θBn,
between the local shock normal and IMF is <45◦(>45◦)the region is quasi-parallel (quasi-perpendicular).
3 Sample event
Figure 1a shows a 35-min spectrogram of data obtained by WBD on 26 March 2002 on two of the four Cluster space-craft (SC3 and SC4) as they crossed the bow shock at about 03:19 UT from the solar wind into the magnetosheath at
Cluster 4 2002-03-26 STAFF-SA UT: 0315 0320 0325 0330 0335 0340 0345 0350 XGSE (RE): 12.79 12.85 12.92 12.98 13.05 13.11 13.17 13.23 YGSE (RE): -2.49 -2.53 -2.58 -2.62 -2.66 -2.70 -2.74 -2.78 ZGSE (RE): 7.34 7.31 7.29 7.26 7.23 7.20 7.17 7.14 (a) 10-7 10-6 10-5 10-4 10-3 m V 2 m -1 H z -1 10 100 1000 f (H z ) (b) 10-9 10-8 10-7 10-6 n T 2 H z -1 10 100 1000 f (H z ) (c) -1.0 -0.5 0.0 0.5 1.0 EB 10 100 1000 f (H z ) (d) 0 30 60 90 K B o 10 100 1000 f (H z ) (e) -1.0 -0.5 0.0 0.5 1.0 S|| / S|| 10 100 1000 f (H z ) 2 F
Fig. 2. STAFF-SA data for spacecraft 4 for the same time period
as shown in Fig. 1. (a) sum of the electric power spectral density from the orthogonal electric field antennas, (b) sum of the magnetic power spectral density from the three orthogonal magnetic field an-tennas, (c) estimate of the ratio of lengths of the minor and major axes of the magnetic field polarization ellipse (see text for details),
(d) angle between the wave vector and the ambient magnetic field,
and (e) parallel component of the Poynting flux normalized by its standard deviation. White or black lines overplotted on the spectro-grams show the local electron cyclotron frequency.
about 15 RE, 13–14◦geomagnetic latitude, and 10:30
Mag-netic Local Time (MLT). This spectrogram has increasing time, in UT, plotted on the horizontal axis and frequency, in kHz, on the vertical axis with color indicating power spectral density, in V2/m2/Hz. The spectrogram was created by tak-ing 1024 samples of the time series and transformtak-ing these data to the frequency domain by using a Fast Fourier Trans-form. The local electron cyclotron frequency was around 1 kHz as determined from FGM data and the plasma fre-quency as determined from the Whisper sounder was 35 kHz (shown as an overplotted white line in Fig. 1a, both pan-els). Thus Cluster is in a weakly magnetized region of space. Figure 1b shows a 4 ms line plot of the waveforms begin-ning at 03:26:22.181 UT. These waveforms were obtained by WBD on SC4 during the 35-min interval seen in the spec-trogram (Fig. 1a, bottom panel). The line plot in Fig. 1b has increasing time, in seconds from 03:26:22.181 UT, plotted on the horizontal axis and electric field amplitude, in mV/m, plotted on the vertical axis. The total angle of the electric field antenna used by WBD to the local magnetic field us-ing transformed FGM data, in degrees, is shown on the right vertical scale. During the time interval in Fig. 1b, we see that the antenna was nearly aligned with the magnetic field direction. The spectrogram at the time of the waveform in Fig. 1b shows only a broadband signal ranging in frequency from the lower cutoff of the filter around 1 kHz, where its greatest intensity is observed, up to about 50 kHz, where a
much lower intensity is observed. The broadband signal re-sults from the fact that the pulses observed in the waveforms in Fig. 1b contain all frequencies. When one or more of these pulses are dominant in a 1024 point sample and are trans-formed to the frequency domain via Fast Fourier Transform, the expected result is a broadband signal as observed. Thus, the broadbands seen in Fig. 1a throughout the magnetosheath interval (∼03:20–03:50 UT) indicate that solitary waves are present continuously after crossing the bow shock.
In order to better appreciate the context in which the soli-tary waves are observed, below we present some Cluster lower frequency wave, particle and magnetic field data for the event highlighted in Fig. 1. We start by showing the wave data in the frequency range of 8 Hz to 4 kHz obtained by the STAFF-SA instrument on SC4 on 26 March 2002 in Fig. 2. The various panels contain the following: (a) the sum of the power spectral densities of the two orthogonal elec-tric components in the spin plane of the spacecraft, (b) sum of the power spectral densities of the three orthogonal mag-netic components, (c) estimate of the ratio of lengths of the minor and major axes of the magnetic field polarization el-lipse obtained using the SVD analysis (Santol´ık et al., 2003), where the sign reflects the sense of polarization with respect to the ambient magnetic field, negative being left-hand and positive right-hand, (d) angle between the wave vector and the ambient magnetic field obtained from polarization of the magnetic field fluctuations using the SVD method, and (e) parallel component of the Poynting flux normalized by its standard deviation. White or black lines overplotted on the spectrograms show the local electron cyclotron frequency. Note that the seeming lack of data above about 100 Hz in panels (c) through (e) is related to the fact that the analysis is being done with only the magnetic components and a thresh-old has been set near the noise floor of the receiver to prevent confusing results associated with the analysis of background noise. Panels (a) and (b) clearly show that there are broad-band waves, both electric and magnetic, up to about 100 Hz after the bow shock is crossed at 03:19 UT. Using only the magnetic components from panel (b), there is no consistent polarization of these waves as shown by panel (c), nor is there a consistent wave normal angle (panel d) or propagation di-rection (panel e), clearly suggesting that these waves are not whistler mode. Not surprisingly, this also suggests that the spacecraft are immersed in a very turbulent medium. On the other hand, short duration whistler mode lion roars begin to appear at about 03:37 UT, identified by their polarization being right-handed and in the frequency range 200–400 Hz (0.2–0.4 fce). They are at lower wave normal angles (∼30◦),
consistent with the results of Maksimovic et al. (2001), but these angles may be artificially increased by fluctuations of
Bo. In addition we can see in panel (c) that they are
propa-gating with a significant parallel component of the Poynting vector. We note that the presence of lion roars may indi-cate that an electron anisotropy exists (Thorne and Tsurutani, 1981).
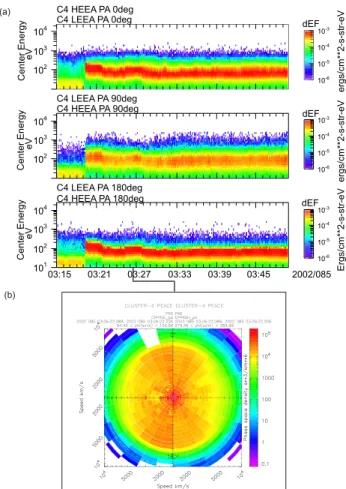
We now look at the particle data, beginning with the elec-trons. Figure 3a covers the same time period as Figs. 1 and
C4 LEEA PA 0deg C4 HEEA PA 0deg 10-6 10-5 10-4 10-3 e rg s /c m ** 2 -s -s tr -e V dEF C4 HEEA PA 90deg C4 LEEA PA 90deg 10-6 10-5 10-4 10-3 e rg s /c m ** 2 -s -s tr -e V dEF C4 HEEA PA 180deg C4 LEEA PA 180deg 10-6 10-5 10-4 10-3 E rg s /c m ** 2 -s -s tr -e V dEF 102 103 104 102 103 104 2002/085 101 102 103 104 03:15 03:21 03:27 03:33 03:39 03:45 C e n te r E n e rg y e V C e n te r E n e rg y e V C e n te r E n e rg y e V (a) (b)
Fig. 3. (a) PEACE energy-time-differential energy flux
spectro-gram from Cluster 4 showing the flux parallel to the direction of the magnetic field (top panel), perpendicular (middle) and anti-parallel (bottom) for the same time period as Fig. 1. The fluxes in each panel include data from both the LEAA and HEAA sensors. Note the counterstreaming (to B) electrons observed in the top and bot-tom panels at energies around 100 eV and less. (b) Phase-space distribution function collected over a single (∼10 ms) sweep of the sensors obtained from a single spin starting around 03:26:22 UT, the same approximate time as the bipolar solitary waves shown in Fig. 1b. The left and right hand sides of the polar representation of the distribution function come from the LEAA and HEAA sensors, respectively. This representation as a distribution function assumes gyrotropy. Note that the counterstreaming electrons are observed at velocities on the order of 5000–6000 km/s (energies ranging from 10–100 eV).
2 with PEACE electron data shown only for SC4. In Fig. 3a, the panels, from top to bottom, are the differential energy fluxes according to the color bars on the right observed par-allel to B, perpendicular to B, and anti-parpar-allel to B, respec-tively, form both the LEAA and HEAA sensors of PEACE. The vertical axis contains the center energy scale from 10 eV to 25 keV, with time plotted on the horizontal scale. It is evident that the bow shock is crossed at bout 03:19 UT. Once the spacecraft enters the magnetosheath, electrons are seen to be counterstreaming (the top and bottom panels at 0 and 180◦ to B, respectively) at energies primarily at or
Table 1. Magnetosheath solitary wave events included in Fig. 6.
Date Time Period1 Cluster Bipolar Pulses Detected Tripolar Pulses Detected Distance from Earth Geomagnetic Latitude MLT
(UT) Spacecraft (Number) (Number) (RE) (◦) (hh:mm)
29 Jan. 2002 10:59–11:15; 1, 3, 4 1188 196 12.9–11.1 −56.4 to −60.4 13:28–13:02 11:32–12:15; 12:20–13:15 8 Feb. 2002 01:15–03:04 4 478 15 11.5–9.9 −60.5 to −75.0 14:33–15:36 6 Mar. 2002 02:13–04:20 4 792 8 13.8–12.3 −55.9 to −67.1 12:20–12:00 26 Mar. 2002 03:20–03:50 3, 4 5050 111 15.0–15.3 13.8 to 12.4 10:29–10:30 2 Apr. 2002 00:00–00:42 1, 2, 4 324 24 10.0–10.7 45.0 to 39.6 09:33–09:42 22 Apr. 2002 15:55–17:30 3, 4 1637 22 13.8–12.7 −40.3 to −48.8 09:15–09:42 13 May 2002 15:50–15:56; 1, 2, 3, 4 79 11 18.3–17.9 −17.9 to −24.1 07:41–07:55 16:03–16:24; 17:02–17:15 TOTAL 9548 387
15 s sampled out of every 52-s time period
Fig. 4. CIS data (top two panels) and FGM data (bottom panel)
from spacecraft 3 for the same time period as Fig. 1 showing the differential energy flux for all ions covering a wide range of ener-gies from about 10 eV up to 10 keV (top panel), the three compo-nents of the ion velocity in GSM coordinates (middle panel), and the three components of the magnetic field in GSM coordinates (bottom panel). Note that the direction of the magnetic field changes at about 03:37 UT, but that this has little or no effect on the ion flux or on the waves as observed in Fig. 1.
below 100 eV. Some electrons are observed perpendicular to B (middle panel, 90 degree pitch angle), but the flux is weaker. A phase space distribution obtained over a spin pe-riod starting at 03:26:22.089 UT, a time that encompasses the observation of the solitary waves seen in Fig. 1b, is shown in Fig. 3b. This representation of the distribution function is constructed from the PAD, or pitch angle data, which is created on-board. To the extent that the distribution func-tion is gyrotropic, PAD data provides a good representafunc-tion in 2-D of the 3-D distribution. The polar plot goes from field aligned (0◦) to backward streaming fluxes at 180◦. The left hand side is constructed from LEAA and the right hand side from HEAA. The differences reflect slight differences in cal-ibration as well as differences in the portion of the spin dur-ing which data from the two sensors was collected (the two
sensors reside on opposite sides of the spacecraft). The dif-ferences in azimuth for the two sensors during the collection time are indicated on the plot. PAD data represent a sin-gle sweep of the sensors (of order 10 ms) with a cadence of 4 s. The electron distribution peaks near 0 and 180◦with ve-locities of 5000–6000 km/s. Slices of this distribution at 0 degrees and 90◦show that the counterstreaming in not due to true beams. Beams are sometimes seen close to the bow shock. Nonetheless, one would not expect strong beams to persist, since they should be highly unstable to the excitation of electrostatic waves/structures such as the observed solitary waves. The slice of the distribution function more closely re-sembles a state of marginal stability, although more analysis would be required to be certain.
The ion data, from the CIS instrument, and magnetic field data, from the FGM instrument, for the same time period on 26 March 2002, but for SC3 as opposed to SC4, are shown in Fig. 4. SC3 was chosen rather than SC4 because the HIA in-strument on this latter spacecraft was not operating. Since the spacecraft are only separated by about 100 km at this time, the ion data from SC3 would be indicative of what is mea-sured on SC4. The panels from top to bottom in Fig. 4 are as follows: 1) Energy-time spectrogram of all ions, with color indicating ion energy flux, 2) ion velocity, in km/s with the components Vx, Vy, Vz in the GSM coordinate system plot-ted in black, red and blue, respectively, with 12 s resolution, 3) magnetic field, in nT, with the components Bx, By, Bz in the GSM coordinate system in black, red and blue, respec-tively. The bow shock crossing is quite obvious in all three panels at 03:19 UT with major changes in the character of all data products in the magnetosheath vs. the solar wind. The ions have a broad energy spread, ∼10 eV to 10 000 eV, and are quite intense in the magnetosheath. The ion velocity is greatly reduced in the magnetosheath from that of the so-lar wind, predominantly directed along the Vx and Vz direc-tions, and the magnetic field strength greatly increases with dominant By and Bz components up to about 03:37 UT, then becoming dominated by the By component. It seems that the appearance of the lion roars around 03:37 UT may be associ-ated with this change in the magnetic field, although there is
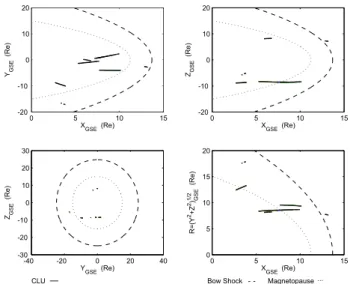
Fig. 5. Location, in GSE coordinates, of the magnetosheath
inter-vals included in the solitary wave survey. See the text for a de-scription of the model bow shock and magnetopause that were used and the explanation for why some intervals appear to lie outside the magnetosheath.
no effect on either amplitudes or time durations of the soli-tary waves due to the change in the magnetic field direction. To summarize the event of 26 March 2002, solitary waves with time durations of a few tens to a few hundreds of µs and peak-to-peak amplitudes of several hundredths to a few tenths of mV/m are seen immediately after crossing the bow shock at about 03:19 UT and continuously for the 30 min to the end of the provided time period. A substantial amount of electrostatic fluctuations and magnetic turbulence below 100 Hz, counterstreaming electrons below about 100 eV, ion fluxes covering a very broad energy range, electron plasma frequency around 35 kHz, and magnetic field strength around 35–45 nT are observed during this same 30-min period.
4 Survey results
Table 1 presents the time periods over which the primary solitary wave survey was conducted. This table shows the number of unclipped bipolar and tripolar solitary waves ob-served during each time period, as well as Ephemeris data for each interval. The locations of the Cluster spacecraft in the magnetosheath during the time periods listed in Table 1 are shown in Fig. 5 along with the model bow shock (Cairns et al., 1995) and magnetopause (Sibeck et al., 1991) in a GSE coordinate system. We have used an average solar wind pres-sure (1.8 nPa) as input to both of these models for all of the events. Thus, the locations of the bow shock and magne-topause as shown in Fig. 5 should be taken as rough esti-mates of these boundaries only since the solar wind pressure varies across all of our events. We have verified that all of our events lie within the magnetosheath by looking at various Cluster instrument data. For example, the event that looks to be outside the bow shock in Fig. 5 is in fact the event shown
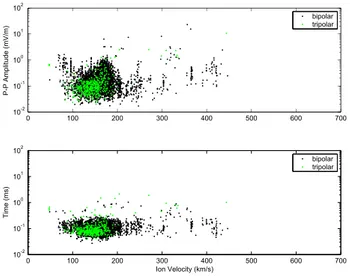
Fig. 6. Characteristics (peak-to-peak amplitude in top panel and
pulse duration in bottom panel) of the solitary waves observed dur-ing the survey interval as a function of distance from the bow shock,
in RE. Note that 0 REis the location of the model bow shock, with
positive distances lying downstream in the magnetosheath. The points that appear to lie upstream of the bow shock are actually downstream and a consequence of the model not being able to
pre-dict the bow shock location to better than 1 RE. There is no change
in either the amplitude or time duration of the solitary waves as the spacecraft get farther from the bow shock.
in Figs. 1 through 4 starting at 03:20 UT, which is clearly inside. Our goal was to choose intervals so as to cover all distances from the bow shock to the magnetopause. For this primary study, we have primarily chosen time intervals in which many solitary waves are observed since our objective is to discover whether the nature of the solitary waves them-selves change as the spacecraft travels from the bow shock to the magnetopause. The fact that we can easily find ex-amples of numerous solitary waves at all distances from the bow shock to the magnetopause implies that solitary waves are likely to be found in great numbers anywhere in the near-Earth dayside magnetosheath.
Figure 6 shows the results of our primary survey, that be-ing the amplitudes and time durations of the bipolar solitary waves (black dots) and tripolar solitary waves (green dots) vs. distance from the model bow shock (again using an aver-age solar wind pressure of 1.8 nPa), 0 being at the bow shock with positive distances being downstream. Distance from the bow shock was determined using the conjugate gradi-ent method and is defined as the minimum distance in three-dimensional space between the Cluster spacecraft for which a solitary wave was identified and the three-dimensional sur-face of the bow shock. In Fig. 6, the amplitude of the detected solitary waves is plotted in a logarithmic scale on the vertical axis (in mV/m peak-to-peak) in the top panel and the time duration of the pulses in a logarithmic scale on the vertical axis (in milliseconds) in the bottom panel.
An automatic detection algorithm was used to obtain the times of isolated bipolar and tripolar pulses during only the
Table 2. Magnetosheath solitary wave events included in Figs. 7 and 8.
Date Time Period1 Cluster Bipolar Pulses Detected Tripolar Pulses Detected Distance from Earth Geomagnetic Latitude MLT
(UT) Spacecraft (Number) (Number) (RE) (◦) (hh:mm)
29 Jan. 2002 10:59–11:15; 1, 3 568 107 12.9–11.1 −56.4 to −60.4 13:28–13:02 11:32–12:15; 12:20–13:15 15 Feb. 2002 23:40–23:58 1, 3 28 0 13.6–13.8 32.9 to 31.0 12:15–12:16 16 Feb. 2002 00:45–02:35 1, 3 75 6 14.3–15.4 26.0 to 16.4 12:20–12:32 26 Mar. 2002 03:20–03:50 3 2570 52 15.0–15.3 13.8 to 12.4 10:29–10:30 2 Apr. 2002 00:00–00:42 1 94 9 10.0–10.7 45.0 to 39.6 09:33–09:42 6 Apr. 2002 21:35–23:30 1, 3 1230 247 12.9–14.2 31.7 to 20.5 09:25–09:37 22 Apr. 2002 15:55–17:30 3 727 10 13.8–12.7 −40.3 to −48.8 09:15–09:42 13 May 2002 15:50–15:56; 1, 3 42 6 18.3–17.9 −17.9 to −24.1 07:41–07:55 16:03–16:24; 17:02–17:15 TOTAL 5334 437
15 s sampled out of every 52-s time period
Fig. 7. Characteristics of the solitary waves observed as a function
of ion velocity. The format is the same as in Fig. 6. There is no trend for the amplitudes or time durations of the solitary waves to vary based on ion velocity.
first 5 s out of every 52-s period as described in Pickett et al. (2004b). Any pulse picked up by this automatic detection routine whose waveform was clipped (its amplitude is too large to be resolved within the available dynamic range pro-vided by the gain state) would have been disqualified from being plotted in this survey. On average the percentage of non-clipped pulses to total pulses detected is about 75–85% in the magnetosheath. Note that the general reduction in soli-tary wave detections around 0.5 to 2.5 REin Fig. 6 is a result
of less WBD data coverage in that region from our chosen events and is thus not physically significant.
It is clear from Fig. 6 that there are solitary waves at all distances and that there is no trend for the amplitudes or time durations to increase or decrease as the spacecraft transit from the bow shock to the magnetopause as might have been expected. Rather, both of these quantities show a tendency to remain constant within a 1–2 order of magnitude window
throughout the magnetosheath. A similar result (not shown) to that in Fig. 6 is obtained when we plot the distance from the magnetopause into the magnetosheath. The implication of this is that the solitary waves are being generated locally, but this topic will be discussed later.
Having found that magnetosheath solitary waves are likely to have the same amplitudes and time durations no matter where they are observed in relation to the bow shock, at least for Cluster’s orbit in the magnetosheath, we decided to see whether these same two quantities were ordered by either the ion velocity or the angle of the ion velocity to the magnetic field (cone angle). The latter quantity was chosen because in 1994, Coroniti et al. (1994) concluded that the occurrence of the plasma waves from several hundred Hz to 5 kHz ob-served by ISEE-3 in the distant magnetosheath are nearly ab-sent when the cone angle is large. To perform this secondary survey, we added some time periods in which very few soli-tary waves were present and some in which hundreds were present, as shown by Table 2 (same format as Table 1). Fig-ure 7 thus shows the results of the solitary wave amplitude, in the top panel, and pulse duration (bottom panel) on the verti-cal axis (same format as Fig. 6) vs. the ion velocity obtained by the CIS instrument, in km/s, on the horizontal axis. There is perhaps a slight tendency for the solitary wave amplitudes to increase with increasing ion velocity, but we do not stress this because ion velocities above 200 km/s are less probable. There is certainly no tendency for the time durations of the solitary waves to either increase or decrease with increasing ion velocity. These results thus suggest that ions do not play a singular role, if any, in the generation of the solitary waves. Figure 8 is the same format as Fig. 7, except that the cone angle, the angle between the magnetic field direction and the ion velocity direction, is plotted on the horizontal axis. Here it is eminently clear that solitary waves are observed at all cone angles with the exception of those around 0 and 180◦. These results show that the solitary waves, at least in the near-Earth magnetosheath of Cluster’s orbit, are clearly not absent at larger cone angles, nor are they less intense, thus not agreeing with the Coroniti et al. (1994) conclusion.
We conclude, therefore, that the magnetosheath waves that are nearly absent at large cone angles in the Coroniti et al. (1994) study are waves other than the solitary waves, or that the magnetosheath waves in the distant magnetosheath are much different than those in the near-Earth region. We believe that the former is probably the case, and that it is the waves around a few kHz (usually less than 5) that are seen in the magnetosheath with the largest intensities that may be the waves that are sensitive to the cone angle. Pickett et al. (2003) found for their magnetosheath case study that the solitary waves seemed to decrease in intensity at large cone angles, but their conclusion was based on assuming an ion velocity direction along XGSE since ion data were not
available. Further, it is clear from the current survey that the solitary wave amplitudes can vary over at least two orders of magnitude at large cone angles, so that the conclusions of Pickett et al. (2003) are not in disagreement with the results shown in Fig. 8 since smaller intensities are allowed at large cone angles. One further trend to note in Fig. 8 is that if soli-tary waves are present at all, there is a higher probability for them to be observed when the cone angle is around 90◦. This may be an effect of the sampling periods used in this sur-vey, i.e., magnetosheath intervals unintentionally weighted towards 90◦, or simply due to the fact that for a completely random distribution, the occurrence rate of a cone angle α should be proportional to sin α, so the rate would be small around 0◦and 180◦and large around 90◦. This needs to be explored in more depth in future statistical studies.
5 Analysis and discussion
We have concluded above, based primarily on the results of Fig. 6, that the solitary waves are most likely being gen-erated locally in the magnetosheath at multiple locations at any point in time. This conclusion is based primarily on the observation that no matter how far away the spacecraft gets from the bow shock or magnetopause, where solitary waves are known to be generated, solitary waves are observed with the same basic characteristics in the magnetosheath. If the solitary waves were being generated at only one or two spe-cific locations, at the bow shock and magnetopause, for in-stance, and propagating across the magnetosheath, we would expect their characteristics to change since solitary waves are known to be unstable and thus probably incapable of propa-gating such great distances without growing, decaying or co-alescing. This is not a surprising conclusion since the mag-netosheath is a turbulent region which implies that local gen-eration of waves is highly probable. Having made this con-clusion, it is now necessary to investigate whether any of the supporting data suggest that a local generation mechanism is possible. Since Cluster particle data are not available with the same high time resolution as the waveform data, unlike the FAST mission (e.g., Ergun et al., 1998), it is not possible to associate single isolated solitary wave events with a par-ticular energetic particle flux, whether electron or ion. Thus, we looked at several events where solitary waves are present
Fig. 8. Characteristics of the solitary waves observed as a function
of the angle between the magnetic field and ion velocity directions (cone angle). The format is the same as in Fig. 6. There is no trend for the amplitudes or time durations of the solitary waves to vary based on the cone angle.
most of the time to see if there is a common electron flux or distribution during these times. In addition we looked at a few events where solitary waves are not observed to any great extent to see if we can explain why they are not there. Note that we have excluded ions from this course of investi-gation since the data presented in the surveys of Figs. 7 and 8 appear to suggest that ions are not singularly involved in the local generation of the solitary waves observed by WBD in the magnetosheath.
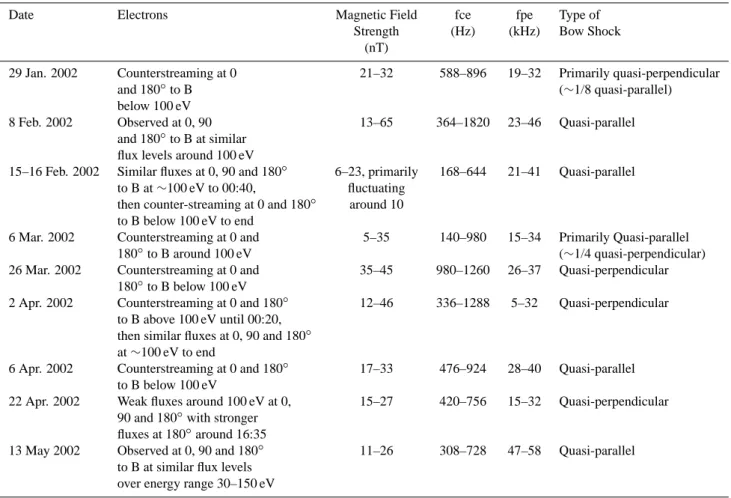
Encouraged by the electron data presented in Fig. 3, i.e., the presence of counterstreaming electrons at about 0 and 180◦to B at or below 100 eV, we looked at the electron data from all of the events included in Tables 1 and 2. Table 3 shows the results of this investigation. It is immediately obvious that counterstreaming electrons around 100 eV are present for almost all of the events. For those where they are not present, parts of 2 April 2002 and all of 13 May 2002, for example, solitary waves are still observed but in fewer num-bers as noted in Tables 1 and 2. On the other hand for the 15–16 February 2002 event, the counterstreaming electrons are present, yet WBD observes very few solitary waves. We thus look to the magnetic field strength for the answer. For the 15–16 February 2002 event we see that the magnetic field strength is very low for most of the event. Why is this im-portant? Pickett et al. (2004b) showed that there was a gen-eral trend for the amplitudes of the solitary waves to increase as the local magnetic field strength increased. Their results show that solitary waves in the magnetosheath are usually not observed below about 10 nT even though solitary waves in the solar wind can be observed down to about 6 nT. Does this mean that solitary waves are not generated in the mag-netosheath in magnetic fields less than 10 nT? The answer to this question is that they may be generated in regions of
Table 3. Local plasma and field characteristics and type of Bow Shock during magnetosheath solitary wave events.
Date Electrons Magnetic Field fce fpe Type of
Strength (Hz) (kHz) Bow Shock
(nT)
29 Jan. 2002 Counterstreaming at 0 21–32 588–896 19–32 Primarily quasi-perpendicular
and 180◦to B (∼1/8 quasi-parallel)
below 100 eV
8 Feb. 2002 Observed at 0, 90 13–65 364–1820 23–46 Quasi-parallel
and 180◦to B at similar
flux levels around 100 eV
15–16 Feb. 2002 Similar fluxes at 0, 90 and 180◦ 6–23, primarily 168–644 21–41 Quasi-parallel
to B at ∼100 eV to 00:40, fluctuating
then counter-streaming at 0 and 180◦ around 10
to B below 100 eV to end
6 Mar. 2002 Counterstreaming at 0 and 5–35 140–980 15–34 Primarily Quasi-parallel
180◦to B around 100 eV (∼1/4 quasi-perpendicular)
26 Mar. 2002 Counterstreaming at 0 and 35–45 980–1260 26–37 Quasi-perpendicular
180◦to B below 100 eV
2 Apr. 2002 Counterstreaming at 0 and 180◦ 12–46 336–1288 5–32 Quasi-perpendicular
to B above 100 eV until 00:20,
then similar fluxes at 0, 90 and 180◦
at ∼100 eV to end
6 Apr. 2002 Counterstreaming at 0 and 180◦ 17–33 476–924 28–40 Quasi-parallel
to B below 100 eV
22 Apr. 2002 Weak fluxes around 100 eV at 0, 15–27 420–756 15–32 Quasi-perpendicular
90 and 180◦with stronger
fluxes at 180◦around 16:35
13 May 2002 Observed at 0, 90 and 180◦ 11–26 308–728 47–58 Quasi-parallel
to B at similar flux levels over energy range 30–150 eV
magnetic field strength less than 10 nT, but due to the overall higher level of turbulence in the magnetosheath over that in the solar wind, it is not possible for our solitary wave detec-tion algorithm to isolate them or distinguish them from other emissions. As further strength to this argument, we note that solitary wave amplitudes at magnetic field strengths below 10 nT, based on Fig. 3a of Pickett et al. (2004b), are expected to be below about 0.05 mV/m, which is near the amplitude level of the other waves and electrostatic fluctuations always observed in the magnetosheath. Thus, we believe that for the 15–16 February 2002 event, even though counterstreaming electrons were observed, WBD failed to measure many soli-tary waves because the magnetic field strength was too low for much of the event.
Why are the counterstreaming electrons often present in the magnetosheath during solitary wave events? We have briefly looked into this question since it might help in the identification of the generation mechanism of the solitary waves. It has been suggested by Feldman et al. (1983) that a field-aligned electrostatic instability driven by field-aligned electron beams acts to produce the relatively flat-topped elec-tron distribution f(V//)out to an energy, Eo, usually in the
range of 30 to 150 eV. There are sometimes two small peaks at the edge of the flat tops making them appear concave
up-ward. Gosling et al. (1989) have reported that suprathermal (greater than ∼1 keV) electrons are commonly found down-stream from perpendicular and quasi-perpendicular portions of the shock, but not downstream from quasi-parallel por-tions. Below about 60 eV the distributions for both quasi-parallel and quasi-perpendicular were found to be roughly flat-topped, with the phase space density slightly greater for the quasi-parallel shock, while above 60 eV the spectra diverge considerably such that at energies above ∼300 eV the electron phase space density for the quasi-perpendicular shock was approximately a factor of 10 higher than that for quasi-parallel shock. This is the motivation for our study of the type of bow shock (determined to first order) which Clus-ter sits behind during our solitary wave events. The results of Table 3 clearly show that the type of shock has little or no bearing on either the presence of counterstreaming electrons at or below 100 eV or the presence of solitary waves. An-other possibility for the presence of counterstreaming elec-trons in the magnetosheath could lie in the process that Tsu-rutani et al. (2003) and Lakhina et al. (2004) proposed for a cusp case using Polar data. This proposal suggests that the parallel electric field component of obliquely propagat-ing electromagnetic proton cyclotron waves can provide a mechanism for bi-directional heated electron beams. The
proton cyclotron waves arise through the loss cone instability as a result of an anisotropy in the particles caused by greater heating of the electrons than ions by phase-steepened Alfv´en waves. We are just starting to get results from Cluster that Alfv´en waves are present in the magnetosheath (Sahraoui et al., 2003), so it remains to be investigated whether these Alfv´en waves are capable of setting in motion the instabil-ity needed to create proton cyclotron waves in the magne-tosheath, and thus the further instability to create counter-streaming electrons, or whether the Alfv´en waves can lead to the generation of the counterstreaming electrons through another method.
Since we have determined that the solitary waves in the magnetosheath are being generated locally, what is the mech-anism by which this is possible? It has been shown by several theorists and simulators that electron beam instabilities, of which the two-stream instability is one, can adequately gen-erate solitary waves, usually in the form of electron phase-space holes, with the characteristics of those observed in the magnetotail and auroral acceleration region (e.g., Omura et al., 1996; Goldman et al., 1999; Singh et al., 2000; Newman et al., 2001). Thus, the significant presence of counterstream-ing electrons observed in the magnetosheath for most of our events certainly bears investigation as a local source of gen-eration of the solitary waves. Jovanovi´c and Shukla (2004) recently proposed a nonlinear model that provides a theo-retical explanation for some of the electrostatic bipolar struc-tures that have been observed in Earth’s magnetosheath. This model is based on a drift-kinetic theory for electron phase-space vortices in magnetized phase-space plasmas formulated in the frequency range of the lower-hybrid waves excited by the Buneman instability in the presence of an electron beam. The model accounts for the effects of the electron polar-ization, anisotropic electron temperature and ion mobility. The quasi-3-D electron holes have the form of either elon-gated cylinders oblique to the magnetic field, or spheroids. Another possible local generation mechanism that needs to be explored is that of the electron acoustic mode. Ashour-Abdalla and Okuda (1986) proposed that electron acoustic waves in the distant magnetotail could be produced by an ion beam propagating along the magnetic field in the presence of two populations of electrons (cold and hot). The spectrum of these electron acoustic waves could extend above fpe and ap-pear broadbanded. Dubouloz et al. (1991) also proposed that the high frequency part of the broadband spectrum that ex-tended above fpe and observed on the Viking satellite in the dayside auroral zone could be the result of electron acoustic solitons passing by the satellite. This was a theoretical in-vestigation, but it points to the need to investigate this mode with respect to the solitary waves observed in the magne-tosheath by Cluster since their spectral extent often exceeds fpe. Whether a cold electron population necessary to excite electron acoustic solitons is present in the magnetosheath is still under investigation since it is often hard to identify such a population in the electron data in the magnetosheath due to other effects. One final consideration for the local genera-tion of solitary waves involves their spontaneous generagenera-tion
out of the turbulence (Chen et al., 2003) that naturally ex-ists in the magnetosheath. The basis for this spontaneous generation out of turbulence is in part provided by Chen et al. (2004) who obtained a continuum of parameter space for phase-space electron and ion holes (BGK solitary waves). All of these possibilities for the local generation of solitary waves will be explored in greater detail in the future.
6 Summary
We have shown above that solitary waves are continuously seen throughout the magnetosheath from the bow shock to the magnetopause, and that the amplitudes and time dura-tions of the solitary waves are about the same no matter how far the spacecraft are from the bow shock at least for Cluster’s orbit that encounters the magnetosheath at distances from about 10 RE to 19.5 RE. We interpreted this to imply that
the solitary waves are being generated locally in the magne-tosheath at multiple locations since we would expect some variance in either the amplitude or time duration, or both, as the spacecraft get farther from the bow shock or closer to the magnetopause (likely sources) since solitary waves are known to be unstable, i.e., they grow and decay and some-times coalesce over short distances and small time periods. We also concluded that the ions are probably not solely, if at all, responsible for the generation of the solitary waves, as we would have expected there to be a correlation between ei-ther the solitary wave amplitudes and time durations and the local ion velocity and there was none.
We concluded that one candidate for the local generation mechanism of the solitary waves was that of the two-stream instability. This is a type of electron beam instability that has been shown to lead to the creation of solitary waves usu-ally in the form of electron phase-space holes. Our conclu-sion was based on the Cluster observations showing counter-streaming electrons present over long periods of time when solitary waves are observed. We speculated that the rea-son that solitary waves were not observed during one case where counterstreaming electrons were present was because the background magnetic field strength was too low. At these times, solitary waves might be generated with amplitudes comparable to the background electrostatic fluctuations and other waves, making it impossible to isolate or distinguish the solitary waves. Although we offer the two-stream elec-tron instability as a likely generation mechanism, we do not rule out the possibility that there could be a cold electron component present that when combined with the hot compo-nent observed in the magnetosheath could lead to the electron acoustic instability as the generation mechanism. This pos-sibility, as well as one which involves the spontaneous gen-eration out of the turbulence observed in the magnetosheath and one which involves the lower-hybrid Buneman instabil-ity in the presence of an electron beam, will be more fully explored in the future. In addition, a more comprehensive statistical study will be carried out that includes many more events with simulations of the counterstreaming electrons to
see analytically whether they are capable of generating the solitary waves with the characteristics observed.
Acknowledgements. We thank the organizers of the Nonlinear
Wave Workshop held in Beaulieu, France in April 2004 for inviting
us to present this work. We thank J. Seeberger and J. Dowell
at Iowa for processing the WBD data, C. Abramo at DSN and M. Hapgood at JSOC for planning and scheduling the WBD operations, I. Willis and K. Yearby at Sheffield University for the expert commanding of WBD, R. Paredes and the antenna operators at DSN for the successful retrieval of the transmitted WBD data, and everyone at ESOC for the superb operation of the four Cluster spacecraft. Work at the University of Iowa was carried out under NASA GSFC Grants No. NAG5-9974 and No. NNG04GB98G and NSF Grant ATM 03-27450. We also acknowledge the joint Czech Republic/US Grant 0307319/ME 650 from NSF. Portions of this work were carried out at the Jet Propulsion Laboratory, California Institute of Technology under contract with NASA.
Edited by: T. Passot Reviewed by: two referees
References
Ashour-Abdalla, M. and Okuda, H.: Electron-acoustic instabilities in the geomagnetic tail, Geophys. Res. Lett., 13, 366–369, 1986. Balogh, A., Dunlop, M. W., Cowley, S. W., Southwood, D. J., Thomlinson, J., et al.: The Cluster Magnetic Field Experiment, Space Sci. Rev., 79, 65–91, 1997.
Behlke, R., Andr´e, M., Bale, S. D., Pickett, J. S., Cattell, C. A., et al.: Solitary structures associated with short large-amplitude magnetic structures (SLAMS) upstream of the Earth’s quasi-parallel bow shock, Geophys. Res. Lett., 31, 16, L16805, doi:10.1029/2004GRL019524, 2004.
Cairns, I. H., Fairfield, D. H., Anderson, R. R., Carlton, V. E. H., Paularena, K. I., et al.: Unusual locations of Earth’s bow shock on Sept. 24–25, 1987: Mach Number affects, J. Geophys. Res., 100, 47–62, 1995.
Cattell, C. A., Dombeck, J., Wygant, J. R., Hudson, M. K., Mozer, F. S., et al.: Comparisons of Polar satellite observations of soli-tary wave velocities in the plasma sheet boundary and the high altitude cusp to those in the auroral zone, Geophys. Res. Lett., 26, 425–428, 1999.
Cattell, C., Neiman, C., Dombeck, J., Crumley, J., Wygant, J., et al.: Large amplitude solitary waves in and near the Earth’s magneto-sphere, magnetopause and bow shock: Polar and Cluster obser-vations, Nonlin. Proc. Geophys., 10, 13–26, 2003,
SRef-ID: 1607-7946/npg/2003-10-13.
Chen, L.-J., Thouless, D. J., and Tang, J.-M.: Width-amplitude re-lation of Bernstein-Greene-Kruskal solitary waves, http://arxiv. org/abs/physics/0303021, 2003.
Chen, L.-J., Thouless, D. J., and Tang, J.-M.: Bernstein-Greene-Kruskal solitary waves in three-dimensional magnetized plasma, Phys. Rev. E, 69, 055402(R), 2004.
Cornilleau-Wehrlin, N., Chauveau, P., Louis, S., Meyer, A., Nappa, J. M., et al.: The Cluster Spatio-Temporal Analysis of Field Fluctuations (STAFF) experiment, Space Sci. Rev., 79, 107–136, 1997.
Coroniti, F. V., Greenstadt, E. W., Moses, S. L., Tsurutani, B. T., and Smith, E. J.: On the absence of plasma wave emissions and
the magnetic field orientation in the distant magnetosheath, Geo-phys. Res. Lett., 21, 2761–2764, 1994.
D´ecr´eau, P. M. E., Fergeau, P., Krannosels’kikh, V., L´evˆeque, M., Martin, Ph., et al.: Whisper, A resonance sounder and wave an-alyzer: performances and perspectives for the Cluster mission, Space Sci. Rev., 79, 157–193, 1997.
Dubouloz, N., Pottelette, R., Malingre, M., and Treumann, R. A.: Generation of Broadband Electrostatic Acoustic Solitons, Geo-phys. Res. Lett., 18, 155–158, 1991.
Ergun, R. E., Carlson, C. W., McFadden, J. P., Mozer, F. S., Delory, G. T., et al.: FAST satellite observations of large-amplitude soli-tary structures, Geophys. Res. Lett., 25, 12, 2041–2044, 1998. Fairfield, D.: Average and unusual location of the Earth’s
magne-topause and bow shock, J. Geophys. Res., 76, 6700–6716, 1971. Feldman, W. C., Anderson, R. C., Bame, S. J., Gary, S. P., Gosling, J. T., et al.: Electron velocity distributions near the Earth’s bow shock, J. Geophys. Res., 88, 96–110, 1983.
Franz, J. R., Kintner, P. M., and Pickett, J. S.: POLAR observa-tions of coherent electric field structures, Geophys. Res. Lett., 25, 1277–1280, 1998.
Glassmeier, K.-H., Motschmann, U., Dunlop, M., Balogh, A., Acu˜na, M. H., et al.: Cluster as a wave telescope – first results from the fluxgate magnetometer, Ann. Geophys., 19, 1439–1447, 2001,
SRef-ID: 1432-0576/ag/2001-19-1439.
Goldman, M. V., Oppenheim, M. M., and Newman, D. L.: Nonlin-ear two-stream instability as an explanation for auroral bipolar wave signatures, Geophys. Res. Lett., 26, 1821–1824, 1999. Gosling, J. T., Thomsen, M. F., Bame, S. J., and Russell, C. T.:
Suprathermal electrons at Earth’s Bow Shock, J. Geophys. Res., 94, 10 011–10 025, 1989.
Gurnett, D. A., Huff, R. L., and Kirchner, D. L.: The Wide-Band Plasma Wave Investigation, Space Sci. Rev., 79, 195–208, 1997. Gurnett, D. A., Huff, R. L., Pickett, J. S., Persoon, A. M., Mutel, R. L., et al: First results from the Cluster wideband plasma wave investigation, Ann. Geophys., 19, 1259–1272, 2001,
SRef-ID: 1432-0576/ag/2001-19-1259.
Jovanovi´c, D. and Shukla, P. K.: Solitary waves in the
Earth’s magnetosphere: Nonlinear stage of the lower-hybrid
Buneman instability, Geophys. Res. Lett., 31, L05805,
doi:10.1029/2003GL018047, 2004.
Johnstone, A. D., Alsop, C., Carter, P. J., Coates, A. J., Coker, A. J., et al.: PEACE: A plasma electron and current experiment, Space Sci. Rev., 79, 351–398, 1997.
Kojima, H., Matsumoto, H., Chikuba, S., Horiyama, S., Ashour-Abdalla, M., et al.: Geotail waveform observations of broad-band/narrowband electrostatic noise in the distant tail, J. Geo-phys. Res., 102(A7), 14 439–14 455, 1997.
Lakhina, G. S., Tsurutani, B. T., and Pickett, J. S.: Association of Alfv´en waves and proton cyclotron waves with electrostatic bipolar pulses: Magnetic hole events observed by Polar, Nonl. Proc. Geophys., 11, 205–213, 2004,
SRef-ID: 1607-7946/npg/2004-11-205.
Lepping, R. P., Acu˜na, M. H., Burlaga, L. F., Farrell, W. M., Slavin, J. A., et al.: The WIND magnetic field investigation, Space Sci. Rev., 71, 207–229, 1995.
Maksimovic, M., Harvey, C. C., Santol´ık, O., Lacombe, C., de Conchy, Y., et al.: Polarisation and propagation of lion roars in the dusk side magnetosheath, Ann. Geophys., 19, 1429–1438, 2001,
McComas, D. J., Blame, S. J., Barker, P., Feldman, W. C., Phillips, J. L., et al.: Solar wind electron proton alpha monitor (SWEPAM) for the Advanced Composition Explorer, Space Sci. Rev., 86, 563–612, 1998.
Newman, D. L., Goldman, M. V., Ergun, R. E., and Mangeney, A.: Formation of double layers and electron holes in a current-driven space plasma, Phys. Rev. Lett., 87 (25), art. no. 255 001, 1–4, 2001.
Ogilvie, K. W., Chornay, D. J., Fritzenreiter, R. J., Hunsaker, F., Keller, J., et al.: SWE, a comprehensive plasma instrument for the Wind spacecraft, Space Sci. Rev., 71, 55–77, 1995.
Omura, Y., Matsumoto, H., Miyake, T., and Kojima, H.: Electron beam instabilities as generation mechanism of electrostatic soli-tary waves in the magnetotail, J. Geophys. Res., 101, 2685–2697, 1996.
Pickett, J. S., Menietti, J. D., Gurnett, D. A., Tsurutani, B., Kintner, P., et al.: Solitary potential structures observed in the magne-tosheath by the Cluster spacecraft, Nonlin. Proc. Geophys., 10, 3–11, 2003,
SRef-ID: 1607-7946/npg/2003-10-3.
Pickett, J. S., Kahler, S. W., Chen, L.-J., Huff, R. L., Santol´ık, O., et al.: Solitary waves observed in the auroral zone: the Cluster multi-spacecraft perspective, Nonlin. Proc. Geophys., 11, 183– 196, 2004a,
SRef-ID: 1607-7946/npg/2004-11-183.
Pickett, J. S., Chen, L.-J., Kahler, S. W., Santol´ık, O., Gurnett, D. A., et al.: Isolated electrostatic structures observed throughout the Cluster orbit: Relationship to magnetic field strength, Ann. Geophys., 22, 2515–2523, 2004b,
SRef-ID: 1432-0576/ag/2004-22-2515.
R`eme, H., Aoustin, C., Bosqued, J. M., Dandouras, J., Lavraud, B., et al.: First multispacecraft ion measurements in and near the Earth’s magnetosphere with the identical Cluster ion spectrome-try (CIS) experiment, Ann. Geophys., 19, 1303–1354, 2001,
SRef-ID: 1432-0576/ag/2001-19-1303.
Rodriguez, P.: Magnetosheath electrostatic turbulence, J. Geophys. Res., 84, 917–930, 1979.
Sahraoui, F., Pinc¸on, J. L., Belmont, G., Rezeau, L., and Cornilleau-Wehrlin, N.: ULF wave identification in the magnetosheath: The k-filtering technique applied to Cluster II data, J. Geophys. Res., 108(A9), 1335, doi:10.1029/2002JA009587, 2003.
Santol´ık, O., Parrot, M., and Lefeuvre, F.: Singular value decompo-sition methods for wave propagation analysis, Radio Sci., 38(1), 1010, doi:10.1029/2000RS002523, 2003.
Sibeck, D. G., Lopez, R. E., and Roelof, E. C.: Solar wind control of the magnetopause shape, location, and motion, J. Geophys. Res., 96, 5489–5495, 1991.
Singh, N., Loo, S. M., Wells, B. E., and Deverapalli, C.: Three-dimensional structure of electron holes driven by an electron beam, Geophys. Res. Lett., 27, 2469–2472, 2000.
Smith, C. W., Acu˜na, M. H., Burlaga, L. F., L’Heureux, J., Ness, N. F., et al.: The ACE Magnetic Fields Experiment, Space Sci. Rev., 86, 613–632, 1998.
Thorne, R. M. and Tsurutani, B. T.: The generation mechanism for magnetosheath lion roars, Nature, 293, 384–386, 1981. Tsurutani, B. T., Smith, E. J., Anderson, R. R., Ogilvie, R. W.,
Scudder, J. D., et al.: Lion roars and nonoscillatory drift mirror waves in the magnetosheath, J. Geophys. Res., 87, 6060–6072, 1982.
Tsurutani, B. T., Dasgupta, B., Arballo, J. D., Lakhina, G. S., and Pickett, J. S.: Magnetic field turbulence, electron heating, mag-netic holes, proton cyclotron waves, and the onsets of bipolar pulse (electron hole) events: a possible unifying scenario, Non-lin. Proc. Geophys., 21, 27–35, 2003.