HAL Id: hal-00001654
https://hal.archives-ouvertes.fr/hal-00001654
Preprint submitted on 2 Jun 2004
HAL is a multi-disciplinary open access
archive for the deposit and dissemination of
sci-entific research documents, whether they are
pub-lished or not. The documents may come from
teaching and research institutions in France or
abroad, or from public or private research centers.
L’archive ouverte pluridisciplinaire HAL, est
destinée au dépôt et à la diffusion de documents
scientifiques de niveau recherche, publiés ou non,
émanant des établissements d’enseignement et de
recherche français ou étrangers, des laboratoires
publics ou privés.
To cite this version:
Patrick Sizun, C. R. Shrader, D. Attié, P. Dubath, S. Schanne, et al.. The INTEGRAL/SPI response
and the Crab observations. 2004. �hal-00001654�
ccsd-00001654, version 1 - 2 Jun 2004
THE INTEGRAL/SPI RESPONSE AND THE CRAB OBSERVATIONS
P. Sizun1 , C. R. Shrader2 , D. Atti´e1 , P. Dubath3 , S. Schanne1 , B. Cordier1 , S. J. Sturner2 , L. Bouchet4 , J.-P. Roques4 , G. K. Skinner4 , and P. Connell5 1
CEA Saclay, DSM/DAPNIA/Service d’Astrophysique, 91191 Gif-sur-Yvette, France
2
NASA/Goddard Space Flight Center, MD 20771, Greenbelt, USA
3
INTEGRAL Science Data Center, Chemin dEcogia 16, 1290 Versoix, Switzerland
4
Centre dEtude Spatiale des Rayonnements, 31028 Toulouse, France
5
GACE - ICUMV, Universitat de Val`encia, Apdo 22085, 46071 Val`encia, Spain
ABSTRACT
The Crab region was observed several times by IN-TEGRAL for calibration purposes. This paper aims at underlining the systematic interactions between (i) observations of this reference source, (ii) in-flight calibration of the instrumental response and (iii) the development and validation of the analysis tools of the SPI spectrometer (Vedrenne et al. 2003). It first describes the way the response is produced and how studies of the Crab spectrum lead to improvements and corrections in the initial response. Then, we present the tools which were developed to extract spectra from the SPI observation data and finally a Crab spectrum obtained with one of these methods, to show the agreement with previous experiments. We conclude with the work still ahead to understand residual uncertainties in the response.
Key words: INTEGRAL/SPI; Crab; instrumental response; calibration.
1. CRAB OBSERVATIONS
During its first year in orbit, INTEGRAL observed the Crab region (the nebula and its pulsar) twice : in February (revolutions 39-45) and August (revo-lutions 102-103) 2003. The total observation time yields 1,723 ks (including annealing periods), per-formed in different modes : on- or off-axis, in staring or dithered mode, with a 5 x 5 or an hexagonal dither pattern. Because of its high luminosity and apparent lack of variability, this source is used as a reference for the spectrometer calibration.
2. INSTRUMENTAL RESPONSE
Response decomposition The response is de-composed into IRFs and RMFs :
- the redistribution matrix files (RMFs) are di-vided into three components describing (1) the events of the full-energy peak, (2) the Compton events interacting first in the detectors, (3) those interacting first in the passive material. They do not depend on the direction or the detector but only on the energy.
- the image response files (IRFs) describe, for a given input photon energy, the effective area of each detector for all directions in the field of view.
Production The INTEGRAL/SPI instrument re-sponse is produced using a suite of Monte Carlo sim-ulation software developed at NASA/GSFC based on the GEANT-3 package called MGEANT (Sturner et al. 2003). This production also required the devel-opment of a detailed computer mass model for SPI.
101 102 103 104 101 102 Energy (keV) Effective area (cm²) Calibration IRF − Release 3 IRF − Release 1
Figure 1. SPI photopeak effective area : comparison between ground calibration measurements (dots with error bars), and two successive IRF releases (dotted and plain lines).
Bruy`eres-le-Chˆatel (BLC) site of CEA. These mea-surements were compared to simulations and led to the initial release of the SPI response (Fig. 1, dotted line).
Correction Initial analysis of ground calibration data was performed only on lines with energies at or above 60 keV. After the launch, it was found through analyses of early Crab observations, that the Crab flux below these 60 keV was underestimated com-pared to the spectrum expected. It enabled us to point out an over-estimation of the low energy effi-ciency.
Additional analyses of 4 low-energy lines from the BLC data were performed. The 20.80 and 26.35 keV lines of the 241
Am calibration source had initially been ignored because of their low statistics. The ∼ 30.8 and ∼ 35.07 keV lines of133
Ba, blended by the Compton component of higher energy lines, had also been rejected. A new response, corrected below 60 keV by taking into account these 4 lines, was derived (Fig. 1, plain line), without any assumption on the Crab spectrum. 3. DECONVOLUTION METHODS Ysi -150 -100 -50 0 50 100 150 Zsi -100 -50 0 50 100 0 5 10 15 20 25 30 35 40 signal Ysi -150 -100 -50 0 50 100 150 Zsi -100 -50 0 50 100 0 5 10 15 20 25 30 35 40 background Ysi -150 -100 -50 0 50 100 150 Zsi -100 -50 0 50 100 0 2 4 6 8 10 difference
Figure 2. Count rates in the 19 Ge detectors in the 20-8000 keV band, during a Crab on axis pointing. From left to right : total count rate, estimated back-ground count rate and their difference. The pattern of the projection of an on axis source through the mask on the detector plane, with its 120 degrees sym-metry, is visible.
Several tools have been developed to extract source spectra from SPI observation data, including Spiros and XSPEC 12.
- in its spectral mode, Spiros (Skinner & Con-nell 2003), available in the INTEGRAL off-line
searched for in each energy bin successively. The off-diagonal terms of the instrumental response are not taken into account in the deconvolution – all events are treated as photopeak events – and the resulting spectrum is in pseudo-photons. A “Spiros dedicated” redistribution matrix was derived using Monte Carlo simulations of both the SPI instrument and the Spiros software. This matrix can for example be used by the spectral-fitting program XSPEC, to fit a model to the real photon spectrum ;
- XSPEC 12, developped at NASA/GSFC (Shrader 2004) is a new release of XSPEC in-cluding SPI specific packages – to be delivered soon. While XSPEC 11 can be used to fit a mathematical model to an already background substracted and deconvolved SPI source spec-trum, XSPEC 12 can work directly from the in-dividual detector spectra. Using, unlike Spiros, the full intrumental response – IRFs and RMFs – reconstructed for each source, it adjusts simul-taneously the model parameters of each of the sources considered and the scaling factors to ap-ply to the background model.
To account for initial discrepancies in the Crab derived flux between Spiros and XSPEC 12, a new version of the “Spiros dedicated” redistribu-tion matrix menredistribu-tioned above was recently derived at NASA/GSFC.
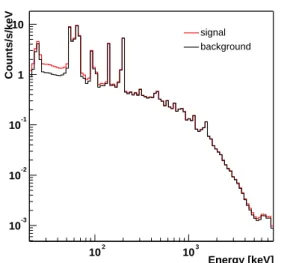
However, the main challenge is to properly model the background which represents a huge fraction of the total measured count rate (Fig. 3 and 3).
Energy [keV] 102 103 Counts/s/keV 10-3 10-2 10-1 1 10 signal background Background
Figure 3. Total count rate (upper line) and estimated background count rate (lower line) during a Crab ob-servation : the signal of interest represents only a tiny fraction of the total count rate.
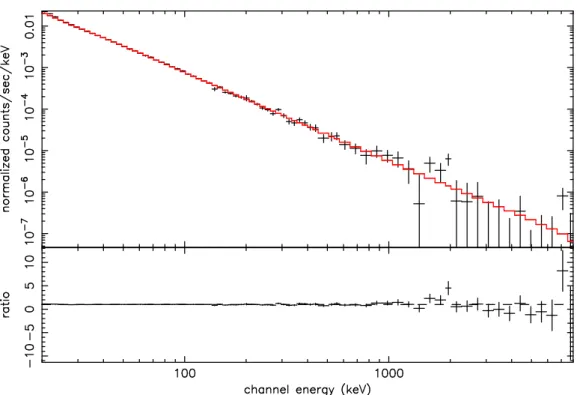
Figure 4. SPI Crab spectrum extracted from 44 NRT science windows in INTEGRAL revolution 44, using OSA 3.0 and a saturated Ge background model fitted detector by detector with Gaussian statistics.
Spectral studies of Crab and other reference sources were done with both Spiros and XSPEC 12, enabling us to cross-calibrate these tools. The resulting spec-tra are now consistent in shape and normalization. An initial discrepancy in normalization was reduced after a new redistribution matrix was derived for Spiros. Some differences remain which are still under study.
4. CRAB SPECTRUM
The Crab spectrum in Fig. 4 was extracted using as standard a method as possible, so that any scientist undertaking to analyze SPI observations shall be able to reproduce such a spectrum. It corresponds to the first 44 near real time science windows of revolution 44, performed with a 5 × 5 dither pattern. Distribu-tion 3.0 of the observaDistribu-tion analysis software (OSA) was used and the spi science analysis script was run mainly with default parameters, the most important of which concern the background : spiback produced a background model based on the count rates in sat-urating Ge detectors and Spiros adjusted the source flux and background count rates in each energy bin, assuming the time variation given by the model and computing the best detector to detector ratios.
Table 1. Flux (ph/cm2
/s) and power law index of total Crab gamma-ray emission.
Instrument Index 50-100 keV flux
OSO-8 2.00 ± 0.06 6.41 10−2 GRIS 2.15 ± 0.03 4.52 10−2 CGRO/OSSE† 2.19 ± 0.03 5.68 10−2 CGRO/BATSE† 2.20 ± 0.01 6.83 10−2 SAX/PDS† 2.13 ± 0.01 4.92 10−2 INTEGRAL/SPI 2.17 ± 0.01∗ 7.08 ± 0.03∗10−2 † private communication
∗ statistical error only
Above 1 MeV, the flux uncertainty grows up as the source flux gets smaller and the basic background model used starts to show its limits : the features vis-ible above 1 MeV correspond to instrumental back-ground residuals.
Imposing the canonical photon spectral index of 2.10 found by X-ray experiments for the entire Crab, we estimate (χ2
/d.o.f = 2.39) a normalization of 10.80 ± 0.03 ph/cm2
/s/keV at 1 keV, to compare with a value of 9.59 ph/cm2
/s/keV given by Will-ingale et al. (2001).
A broken power law fits only slightly better (χ2
/d.o.f = 1.29) than a single power law. Imposing a low energy index α1= 2.10, we find a high energy index
α2 = 2.19 ± 0.01 with a break around 61 ± 6 keV
and a normalization of 11.03 ± 0.05 ph/cm2
/s/keV at 1 keV.
Using a different energy range or background han-dling method, the fit parameters found vary slightly. Even without taking into account systematic uncer-tainties due to the calibration and background han-dling works still in progress, Table 1 shows a very good agreement between SPI and other gamma-ray experiments.
5. CONCLUSION
After a few months of fine tuning of both the in-strumental response and the deconvolution tools, the Crab spectra extracted from INTEGRAL/SPI obser-vations with the various software available are com-patible with each other and rather consistent with previous experiments.
Some further work will be necessary to build more elaborate background models and become more con-fident in the fluxes derived. Although the response and the extraction software might still evolve in the future especially to account for the loss of detector 2, the tools available today are sufficient to study point sources observed with INTEGRAL.
ACKNOWLEDGEMENTS
We thank the team responsible for the SPI spec-trometer aboard INTEGRAL for their contribution to this work. INTEGRAL is an ESA project with instruments and science data centre funded by ESA member states (especially the PI countries : Den-mark, France, Germany, Italy, Switzerland, Spain), Czech Republic and Poland, and with the participa-tion of Russia and the USA.
REFERENCES
Atti´e D., Cordier B., Gros M., et al., Nov. 2003, A&A, 411, L71
MGEANT, A generic multi-purpose monte-carlo package for gamma-ray experiments, URL: http://lheawww.gsfc.nasa.gov/docs/ gamcosray/legr/mgeant/mgeant.html
Schanne S., Cordier B., Gros M., et al., Mar. 2003, In: Proc. SPIE, 4851, 1132–1143
Shrader C.R., 2004, In: this volume
Skinner G., Connell P., Nov. 2003, A&A, 411, L123 Sturner S.J., Shrader C.R., Weidenspointner G.,
et al., Nov. 2003, A&A, 411, L81
Vedrenne G., Roques J.P., Sch¨onfelder V., et al., Nov. 2003, A&A, 411, L63
Willingale R., Aschenbach B., Griffiths R.G., et al., Jan. 2001, A&A, 365, L212