UNIVERSITÉ DE MONTRÉAL
HIGHLY STRUCTURED AND SURFACE MODIFIED
POLY(ε-CAPROLACTONE) SCAFFOLDS DERIVED FROM
CO-CONTINUOUS POLYMER BLENDS FOR BONE TISSUE ENGINEERING
NIMA GHAVIDEL MEHR
DÉPARTEMENT DE GÉNIE CHIMIQUE ÉCOLE POLYTECHNIQUE DE MONTRÉAL
THÉSE PRÉSENTÉE EN VUE DE L’OBTENTION DU DIPLÔME DE PHILOSOPHIAE DOCTOR
(GÉNIE CHIMIQUE) AOÛT 2014
UNIVERSITÉ DE MONTRÉAL
ÉCOLE POLYTECHNIQUE DE MONTRÉAL
Cette thèse intitulée:
HIGHLY STRUCTURED AND SURFACE MODIFIED POLY(ε-CAPROLACTONE) SCAFFOLDS DERIVED FROM CO-CONTINUOUS POLYMER BLENDS FOR
BONE TISSUE ENGINEERING
présentée par : GHAVIDEL MEHR Nima
en vue de l’obtention du diplôme de : PHILOSOPHIAE DOCTOR a été dûment acceptée par le jury d’examen constitué de :
Mme HEUZEY Marie Claude, Ph.D., présidente
M. FAVIS Basil, Ph.D., membre et directeur de recherche
Mme HOEMANN Caroline, Ph.D., membre et codirectrice de recherche M. DUBOIS Charles, Ph.D., membre
DEDICATIONS
ACKNOWLEDGEMENTS
I would like to convey my sincere and heartfelt gratitude to my Ph.D research supervisor, Professor Basil D. Favis for giving me an exceptional support and assistance in the course of this challenging multidisciplinary project. I am honored to have had the opportunity to work as a Ph.D candidate under his supervision at École Polytechnique de Montréal. Not only has he been a great mentor and a role model to me as a professional to overcome many difficulties that I encountered during this thesis, he has also helped me through difficult times when my father deceased as well as periods of painful medical problems. I will never forget his patience, enthusiasm, motivation and accurate scientific attitude.
I would also like to thank my research co-supervisor, Professor Caroline D. Hoemann whose full support, vast knowledge and professionalism, helped me to fully succeed in this project. I am blessed to have worked in one of the most equipped bioengineering laboratories in North America under her direction and I am extremely lucky to have learnt from her through her continuous professional assistance during this research project. Professor Hoemann has always been there for me whenever I needed help both personally and professionally.
I would also like to acknowledge Dr Xian Li and Dr Marianne B. Ariganello who have greatly contributed to the accomplishment of this work. Precious contributions of these two professionals have surely paved the way to the accomplishment of this research project.
I would also like to thank Professor Mike Buschmann for generously allowing me to have access to the BCL lab equipments. My thanks also go to other professors and technical staff of the chemical and biomedical engineering as well as engineering physics departments especially Suzie Poulin and Josianne Lefebvre at École Polytechnique de Montréal for providing the best possible assistance in this interesting project.
My deep gratitude goes to my friends and colleagues at École Polytechnique de Montréal, Charles-Hubert, David, Jessica, Elias, Mohsen, Ashkan, Sepehr, Ebrahim, Marie, Josianne, Nicholas, Vincent, Daniel and many more whose names I might have forgotten to mention, who helped me in various aspects during this Ph.D thesis.
At the end, I would like to thank my parents who have always supported me to continue my studies; my mother who took care of us three brothers when we had no one and my supporting
father whose devastating loss almost destroyed the dream of finishing this Ph.D thesis. Finally, I would like to thank my wife for her love, patience, and encouragement and having faith in me when I was down and pushing me to stand up and continue.
RÉSUMÉ
L'utilisation d’échafaudages tridimensionnels poreux ensemencés avec des cellules ostéoprogénitrices, telles que les cellules souches mésenchymateuses humaines (CSM) pour la régénération des os, est devenue un outil prometteur pour l’ingénierie tissulaire osseuse. Les échafaudages dans l’ingénierie tissulaire osseuse agissent à titre de structure facilitant l'attachement, la migration, et la distribution des cellules hôtes impliquées dans le processus de réparation osseuse. Ces structures poreuses doivent être biocompatibles, biodégradables et doivent idéalement avoir une chimie de surface favorable, un niveau élevé d’interconnectivité des pores, des pores au diamètre favorable et finalement une distribution étroite de la taille des pores. Parmi une panoplie de matériaux synthétiques et naturels proposés pour l’ingénierie tissulaire osseuse, le poly(ε-caprolactone) (PCL) a été largement utilisé à cette fin grâce à sa biocompatibilité, sa basse immunogénicité, sa lente biodégradation et sa stabilité mécanique allant jusqu'à trois ans in vivo. Différentes techniques de fabrication ont été utilisées afin de produire des échafaudages pour l’ingénierie tissulaire osseuse, telles que le frittage, la coulée avec un solvant suivi du lessivage des particules, le moussage, et le prototypage rapide. Ces méthodes présentent habituellement de nombreux inconvénients comme l'utilisation de solvants toxiques, les limitations imposées par la forme de la phase de l’agent porogène, le niveau faible d'interconnectivité des pores, la température élevée du procédé, la large distribution de la taille des pores et les coûts élevés du traitement. Jusqu’à présent, une recherche complète sur les échafaudages utilisés en génie tissulaire ayant des pores de taille significativement différente et contrôlée de manière précise au niveau microscopique tout en considérant l'infiltration de l'échafaudage comme un paramètre déterminant n'a pas encore été faite.
Des échafaudages en PCL ayant les propriétés mentionnées précédemment ont été fabriqués par un mélange à l'état fondu avec du poly(oxyde d'éthylène) (PEO) choisi comme phase porogène. La composition du mélange a été choisie pour avoir une morphologie co-continue. Un recuit statique et une extraction sélective du PEO, qui est hydrosoluble, ont été effectués sur les mélanges ainsi obtenus. Les pores générés par cette méthode se sont avérés être entièrement interconnectés une propriété qui n'a pas été perturbée par le recuit. Le niveau d'interconnectivité des pores a été mesuré indirectement en déterminant le pourcentage de continuité de la phase porogène suite à l’extraction. Afin d'étudier l'effet de la taille des pores sur l'infiltration dans
l'échafaudage, des structures en PCL ayant des diamètres moyens de pores de 84, 116, 141, et 162 micromètres ont été produits en faisant varier la durée du recuit. Pour cela, une nouvelle analyse in vitro a été utilisée pour comparer l'infiltration à travers l'échafaudage par des billes de polystyrène de 10 micromètres de diamètre ayant la même taille que les cellules souches mésenchymateuses (CSM) humaines et celle par des CSMs humaines. Le niveau de pénétration des billes à travers l’échafaudage a montré une augmentation linéaire avec la hausse de la taille de pores, tandis que les CSMs ne se sont infiltrées que dans les pores ayant une taille de 141 et 162 micromètres. Pour les tailles de pores inférieures, les cellules se sont agrégées et ont adhéré près de la zone d’ensemencement avec une basse infiltration dans la structure poreuse. Utiliser des billes sphériques non réactives a permis d’obtenir un point de référence pour les systèmes non-agrégés qui pourraient être considérés comme le scénario idéal pour l'infiltration. Ces résultats ont indiqué que les billes imitent étroitement les cellules pour des tailles de pores égales ou supérieures à 141 micromètres. Les tests de cytotoxicité utilisant des fibroblastes de souris L929 ont démontré que les échafaudages ne sont pas cytotoxiques et qu’ils n’induisent pas de nécrose lors du contact avec les cellules. Cependant, une légère diminution de l'activité métabolique des cellules a été observée, elle peut être attribuée à la surface hydrophobe du PCL. Par conséquent, la modification de la surface des échafaudages en PCL avec un agent cytocompatible et hydrophile peut fortement augmenter l’adhésion, la propagation et la différenciation des CSMs en ostéoblastes.
Le chitosane, un composant important de la famille de polysaccharides, a été utilisé pour modifier la chimie des échafaudages de PCL en apportant l’hydrophilicité sur la surface. Le dépôt d'une couche homogène de chitosane sur la surface des échafaudages de PCL a été effectué à l'aide d'un autoassemblage couche-par-couche (LbL) de poly(chlorure de dialyldemethylammunium) (PDADMAC) comme polyélectrolyte cationique et de poly(styrenesulfonate de sodium 4) (PSS) comme polyélectrolyte anionique. La dernière couche de PSS négativement chargée permet l'addition du chitosane positivement chargé comme couche externe. Les mesures gravimétriques ont indiqué qu’une addition allant jusqu'à 3 couches a abouti à la formation de chaînes interpénétrées de polyélectrolyte qui ne permettent pas la formation de couches distinctes de charges positives ou négatives clairement définies. En augmentant le nombre de couches de polyélectrolytes chargés alternativement, des couches distinctes et mieux définies ont été formées. Les analyses détaillées des rapports d'O/C, de N/C et de S/C par la
spectroscopie de photoélectrons induits par rayons X (XPS), ont confirmé la présence dominante de la molécule de PSS à la surface, étant la dernière couche de polyélectrolyte déposée et en plus grand nombre de dépôts (n=8), qui pourra être plus tard la surface de déposition du chitosane. Il a alors été montré que la méthode de dépôt LbL a conduit à l’obtention d’une couche homogène de chitosane pour toutes les profondeurs de cavités dans les échafaudages. Cela confirme que la méthode de dépôt LbL est une meilleure stratégie que la méthode de revêtement par immersion. L'analyse au microscope électronique à balayage (MEB) a montré une surface rugueuse de chitosane sur les substrats 2D de PCL, dont l'épaisseur totale s'étend de 550-700 nanomètres. Ces résultats ont permis de vérifier que l'utilisation de l’autoassemblage couche-par-couche de polyélectrolytes suivie de l'addition de chitosane comme couche externe, a conduit à une modification stable et bien homogène de la surface. De plus, cette méthode a le potentiel de transformer un matériel classique en polymère synthétique avec des pores complètement interconnectés en un matériel ayant des caractéristiques de surface identiques à celles du chitosane.
Le potentiel ostéogénique des échafaudages de PCL avec un traitement de surface par chitosane utilisant la méthode de dépôt LbL n'a jamais été évalué. Cette partie de la thèse considère l’hypothèse que l’ostéogenèse in vitro pourrait être réalisée dans les échafaudages 3D de PCL avec des pores interconnectés ayant un diamètre moyen de 84 et 141 micromètres, et que la biominéralisation pourrait être améliorée quand les pores sont revêtus avec du chitosane par l’approche LbL. Afin de réduire au minimum les erreurs provenant des inefficacités de l’infiltration cellulaire, le protocole le plus performant d’ensemencement des cellules a du être établi. Parmi l’ensemencement classique des cellules à 37 °C, l’ensemencement en deux étapes à 37°C, et l'ensemencement à froid à 4°C, dans un milieu contenant 2% de FBS (Fetal Bovine Serum), le dernier a montré la plus grande population de CSMs fraîchement trypsinisées dans toutes les profondeurs des échafaudages de 1 mm d’épaisseur. Les CSMs ensemencées dans des échafaudages de PCL, avec ou sans revêtement de chitosane par LbL, ont tout d’abord été mis en culture dans un milieu de prolifération pendant 10 jours, puis cultivées 21 jours dans un milieu ostéogénique. Au jour 2, les CSMs ont formé des monocouches creuses avec des morphologies cellulaires arrondies ayant de minces filopodes ancrés à la surface non modifiée du PCL, contrairement aux cellules étalées sur la surface des pores de PCL revêtue avec le chitosane. Au jour 10, les cellules ont proliféré formant une couche externe sur PCL et ont migré sur les réseaux
de collagène sécrétés qui remplissent les espaces entre les pores dans tous les échafaudages, par contre, elles n’adhèrent qu’à des surfaces de pores revêtues par le chitosane. Au jour 31, des quantités équivalentes de tissu ont été observées dans les échafaudages avec et sans chitosane, cependant les dépôts de tissu ont été plus importants dans les pores externes que dans les pores internes. En outre, une plus grande quantité de matrice biominéralisée a été observée dans les pores internes des échantillons de 84 micromètres ayant un revêtement de chitosane. Dans les échantillons de PCL pur, le dépôt de minéraux a été observé de façon aléatoire dans les sections supérieures très colonisées et dans les pores internes de 141 micromètres de diamètre. Les CSMs cultivées sur la surface de contrôle 2D avec un revêtement de chitosane ont montré une coloration plus prononcée de la phosphatase alcaline, demeurant une minéralisation négligeable. Cette étude prouve que les CSMs survivent, se prolifèrent, et adhérent plutôt à la matrice fibreuse qu’à la surface non-modifiée des pores du PCL. De plus, les échafaudages revêtus par LbL-chitosane présentent plus de biominéralisation en 3D dans les pores internes de 84 micromètres; une réponse cellulaire qui peut être liée à la courbure de la surface ainsi qu’à l’amélioration de l'hydrophilicité de la surface.
ABSTRACT
The application of porous three-dimensional scaffolds seeded with osteoprogenitor cells such as human mesenchymal stem cells (hBMSC) for bone regeneration has become a promising tool for in vitro bone tissue engineering. Scaffolds in bone tissue engineering act as a supportive bridge that facilitates the migration, attachment and distribution of the host cells involved in bone ingrowth. These porous structures should be biocompatible, biodegradable and ideally exhibit a favorable surface chemistry, controlled interconnected pores, pore sizes and narrow pore size distributions. Among a variety of synthetic and natural materials suggested for bone tissue engineering, poly(ε-caprolactone) (PCL) has been widely used for this purpose, owing to its biocompatibility, low immunogenicity, slow biodegradation and mechanical stability for up to three years in vivo. Various fabrication techniques have been used for the production of bone tissue engineering scaffolds, such as sintering, solvent casting and particulate leaching, gas foaming and rapid prototyping. These methods are normally associated with numerous drawbacks such as the use of toxic solvents, limitations imposed by the shape of the porogen phase, low levels of pore interconnectivity, high processing temperatures, large pore size distributions and high processing costs. To date, a thorough investigation of tissue engineering scaffolds of significantly different and highly controlled pore sizes at the microscopic level including scaffold infiltration as a crucial parameter has not been done.
PCL scaffolds with the features mentioned above have been fabricated by melt blending of PCL with poly(ethylene oxide) (PEO) at co-continuous composition followed by static annealing of the blends and selective extraction of water soluble PEO as the porogen phase. The pores generated by this method were proved to be fully interconnected- a property which was not disrupted by annealing. The level of pore interconnectivity was measured indirectly by determining the continuity % of the porogen phase post-extraction. PCL scaffolds with 84, 116, 141, and 162 μm average diameter pore sizes have been generated by varying the annealing time to investigate the effect of pore size on the scaffold infiltration. For this purpose, a novel in vitro assay was used to compare scaffold infiltration by 10-micron diameter polystyrene beads and trypsinized human bone marrow stromal cells (hBMSCs). Beads showed a linear increase in the extent of scaffold infiltration with increasing pore size. BMSCs infiltrated the 162 and 141 μm pore samples, below which the cells aggregated and adhered near the seeding area with low
infiltration into the porous device. Using non-interacting spherical beads provides a base-line for non-aggregated systems which could be considered as the ideal infiltration scenario. These results revealed that the beads closely mimic the cells at pore sizes equal and higher than 141 μm. Cytotoxicity studies using L929 mouse fibroblasts demonstrated that the scaffolds are not cytotoxic and do not induce necrosis upon contact with the cells. However, a slight decrease in the metabolic activity of the cells was observed which was attributed to the hydrophobic surface of PCL. Hence, the surface modification of PCL scaffolds with a hydrophilic cytocompatible agent could potentially enhance cell attachment, spreading and differentiation of hBMSCs into osteoblasts.
Chitosan, an important member of the polysaccharide family was used to alter the chemistry of PCL scaffolds and bring hydrophilicity to the surface. The deposition of a homogeneous chitosan layer on the surface of the PCL scaffolds was carried out using a Layer-by-Layer (LbL) self-assembly of poly(dialyldemethylammunium chloride) (PDADMAC) as cationic and poly(sodium 4-styrenesulfonate) (PSS) as anionic polyelectrolytes. The final negatively charged PSS layer allows for the addition of the positively charged chitosan as the outermost layer. Gravimetric measurements revealed that the addition of up to 3 layers leads to the formation of interdiffusing polyelectrolyte layers which do not allow for the formation of defined positive or negative charges. By increasing the number of polyelectrolyte layers with alternating charges, more well-defined layers are formed. Detailed analyses of O/C, N/C and S/C ratios by X-ray photoelectron spectroscopy (XPS) show that the PSS molecule dominates the surface as the last deposited polyelectrolyte layer at higher number of depositions (n=8), which can later be the surface for the deposition of chitosan. The LbL deposition of the chitosan layer on the LbL coating was then shown to be locally homogeneous at different depths within the scaffolds which also clarified that the LbL method is superior to the dip coating strategy. SEM analysis showed that there is a rough chitosan surface on the 2D solid PCL constructs whose thickness ranges from 550-700 nanometers. These results demonstrate that the application of LbL self-assembly of polyelectrolytes followed by the addition of chitosan as the outermost layer provides a route towards stable and homogeneous surface modification and has the potential to transform a classic fully interconnected porous synthetic polymer material to one with essentially complete chitosan-like surface characteristics.
The osteogenic potential of PCL scaffolds with a chitosan coating using Layer-by-Layer (LbL) surface modification has never been evaluated before. This part of the study tests the hypothesis that in vitro osteogenesis can be achieved in 3D PCL scaffolds with fully interconnected pores of 84 μm or 141 μm average diameter and biomineralization can be enhanced when pore surfaces are coated with chitosan adsorbed to LbL deposited polyelectrolytes. In order to reduce the errors originating from cell infiltration inefficiencies, the most competent cell seeding protocol has to be defined. Among classical cell seeding at 37°C, 2-step seeding at 37°C and cold seeding at 4°C in a medium containing 2% FBS, the last strategy proved to yield the best population of freshly trypsinized hBMSCs at all depths of the 1mm-thick scaffolds. hBMSCs cold-seeded in PCL scaffolds with or without an LbL-chitosan coating were cultured for 10 days in proliferation medium, followed by 21 days in osteogenic medium. At day 2, MSCs formed sparse monolayers with rounded cell morphologies with thin filopodia anchored to the unmodified PCL, as compared to more spread cells on chitosan-coated pore surfaces. At day 10, cells proliferated as an external layer, and migrated onto secreted collagen networks that filled the interpore spaces of all scaffolds, but only adhered to chitosan-coated pore surfaces. At day 31, similar levels of tissue formed in scaffolds with and without chitosan, but more tissue was deposited in the outer pores than the inner pores. Furthermore, more biomineralized matrix was observed in the inner 84 μm chitosan-coated pores (p<0.05). In the PCL-only samples, haphazard mineral deposits were observed in highly colonized outer layers and in the inner 141 μm pores. MSCs cultured on chitosan-coated 2D control surfaces show higher alkaline phosphatase staining but negligible mineralization. This study showed that hBMSCs survive, proliferate, and attach to fibrotic matrix rather than the PCL-only scaffold pore surfaces. LbL-chitosan-coated scaffolds showed more biomineralization in 3D inner 84 μm pores, a cell response that may be related to surface curvature in addition to improved surface hydrophilicity.
TABLE OF CONTENTS
DEDICATIONS ... III ACKNOWLEDGEMENTS ... IV RÉSUMÉ ... VI ABSTRACT ... X TABLE OF CONTENTS ... XIII LIST OF TABLES ... XIX LIST OF FIGURES ... XX LIST OF APPENDICES ... XXX NOMENCLATURE ... XXXI
CHAPTER 1 INTRODUCTION AND OBJECTIVES ... 1
1.1 Introduction ... 1
1.2 Research Hypothesis ... 3
1.3 Objectives ... 4
CHAPTER 2 LITERATURE REVIEW ... 5
2.1 Tissue engineering overview ... 5
2.2 Bone tissue engineering ... 6
2.2.1 Bone tissue engineering strategies ... 7
2.2.1.1 Osteoconduction ... 7
2.2.1.2 Osteoinduction ... 8
2.2.1.3 Osteogenesis ... 9
2.2.2 Cells used in bone tissue engineering ... 10
2.2.2.1 Bone marrow-derived mesenchymal stem cells (BMSCs) ... 11
2.2.2.3 In vitro osteogenesis of BMSCs in 3D constructs ... 14
2.2.3 Requirements for bone tissue engineering scaffolds ... 17
2.2.3.1 Biocompatibility ... 18
2.2.3.2 Biodegradation ... 19
2.2.3.3 Porosity, pore size and level of pore interconnectivity ... 20
2.2.3.3.1 Effect of porosity on osteogenesis ... 21
2.2.3.3.2 Effect of pore size on osteogenesis ... 24
2.2.3.4 Surface chemistry ... 26
2.2.3.5 Mechanical properties ... 27
2.2.4 Biomaterials of interest ... 28
2.2.4.1 Poly(ε-caprolactone) ... 28
2.2.4.2 Poly(ethylene glycol) (PEG) and PEG-based materials ... 32
2.2.4.3 Chitosan ... 33
2.2.5 Bone scaffold fabrication techniques ... 34
2.3 Melt blending of polymers ... 38
2.3.1 Fundamentals ... 38
2.3.2 Immiscible polymer blends ... 40
2.3.3 Co-continuity in polymer blends ... 44
2.3.3.1 Percolation theory and the development of co-continuity ... 44
2.3.3.2 Characterization of co-continuity or pore interconnectivity ... 46
2.3.3.2.1 Image analysis ... 46
2.3.3.2.2 BET and mercury intrusion porosimetry (MIP) ... 48
2.3.3.2.3 Gravimetric measurements ... 49
2.3.3.3.1 Composition and viscosity ratio of the blend components ... 51
2.3.3.3.2 Interfacial tension and interfacial modification ... 52
2.3.3.3.3 Annealing... 55
2.4 Surface modification of polymers ... 58
2.4.1 Methods for the surface modification of polymers ... 59
2.4.2 Layer-by-Layer deposition of polyelectrolytes ... 60
2.4.2.1 Mechanism of LbL deposition of polyelectrolytes ... 61
2.4.2.2 Determining parameters in LbL deposition of polyelectrolytes ... 62
2.4.2.2.1 Effect of salt concentration ... 62
2.4.2.2.2 Effect of polyelectrolyte type ... 64
2.4.2.2.3 Effect of polyelectrolyte concentration ... 65
2.4.2.2.4 Effect of deposition pH (degree of ionization of polyelectrolytes) ... 66
2.4.2.2.5 Effect of deposition time ... 66
CHAPTER 3 ORGANIZATION OF THE ARTICLES ... 68
CHAPTER 4 ARTICLE 1: POLY(Ε-CAPROLACTONE) SCAFFOLDS OF HIGHLY CONTROLLED POROSITY AND INTERCONNECTIVITY DERIVED FROM CO-CONTINUOUS POLYMER BLENDS: MODEL BEAD AND CELL INFILTRATION BEHAVIOR... ... 70
4.1 Introduction ... 73
4.2 Materials and methods ... 75
4.2.1 Materials ... 75
4.2.2 Blend preparation ... 75
4.2.3 Rheology ... 75
4.2.4 Annealing and sample preparation ... 76
4.2.6 Scanning electron microscopy ... 77
4.2.7 Mercury intrusion porosimetry/sample designation ... 77
4.2.8 Cell culture ... 78
4.2.9 Bead/cell infiltration ... 78
4.2.10 Cell viability assays ... 79
4.2.11 Statistical analyses ... 80
4.3 Results and discussion ... 81
4.3.1 Rheology ... 81
4.3.2 Morphology ... 81
4.3.3 Continuity measurements ... 86
4.3.4 Bead/cell infiltration ... 88
4.3.5 Cytotoxicity and cell viability ... 92
4.4 Conclusion ... 94
CHAPTER 5 ARTICLE 2: CHITOSAN SURFACE MODIFICATION OF FULLY INTERCONNECTED 3D POROUS POLY(Ε-CAPROLACTONE) BY THE LBL APPROACH... 100
5.1 Introduction ... 103
5.2 Materials and Methods ... 105
5.2.1 Materials ... 105
5.2.2 Blend preparation ... 105
5.2.3 Annealing ... 106
5.2.4 Scaffold preparation and designation ... 106
5.2.5 Solvent extraction ... 106
5.2.6 Surface modification via dip coating and LbL deposition of polyelectrolytes ... 107
5.2.8 Fluorescent microscopy ... 108
5.2.9 Time of flight secondary ion mass spectrometry (ToF-SIMS) ... 108
5.2.10 X-ray photoelectron spectroscopy (XPS) ... 108
5.2.11 Scanning electron microscopy ... 109
5.3 Results and discussion ... 110
5.3.1 Dip coating pure PCL in slightly acidic chitosan solutions leads to an inhomogeneous surface coating ... 110
5.3.1.1 Fluorescent microscopy ... 110
5.3.1.2 XPS and ToF-SIMS analysis... 111
5.3.2 LbL surface deposition of polyelectrolytes ... 113
5.3.2.1 Gravimetric measurements ... 113
5.3.2.2 XPS analysis of the layers ... 115
5.3.2.3 Scanning electron microscopy ... 121
5.4 Conclusion ... 122
CHAPTER 6 ARTICLE 3: OSTEOGENIC MESENCHYMAL STEM CELLS POPULATE 3-D POLY(Ε-CAPROLACTONE) SCAFFOLDS WITH INTERCONNECTED PORES AND PREFERENTIALLY MINERALIZE LBL CHITOSAN-COATED SURFACES ... 131
6.1 Introduction ... 134
6.2 Materials and methods ... 135
6.2.1 Materials ... 135
6.2.2 Scaffold fabrication ... 136
6.2.3 Surface modification of PCL via LbL self-assembly ... 136
6.2.4 Scaffold characterization by micro-computed tomography (µ-CT) ... 137
6.2.5 Cell expansion and static cell seeding ... 137
6.2.7 Microscopic evaluations using environmental scanning electron microscopy
(ESEM). ... 139
6.2.8 Histology and quantitative histomorphometry ... 139
6.2.9 Statistical analyses ... 140
6.3 Results ... 141
6.3.1 Scaffold structural characterization with and without LbL-chitosan ... 141
6.3.2 Cold seeding improves cell seeding distribution in PCL scaffolds ... 142
6.3.3 Cell attachment, proliferation and matrix deposition ... 144
6.3.4 Histological analysis of matrix mineralization ... 148
6.4 Discussion ... 152
CHAPTER 7 GENERAL DISCUSSION ... 160
7.1 PCL scaffold fabrication and infiltration studies ... 160
7.2 Surface modification of PCL scaffolds ... 162
7.3 Osteogenic potential of surface modified PCL scaffolds ... 164
7.3.1 Technical challenges ... 164
7.3.2 Scientific challenges ... 165
CONCLUSION AND RECOMMENDATIONS ... 167
REFERENCES ... 173
LIST OF TABLES
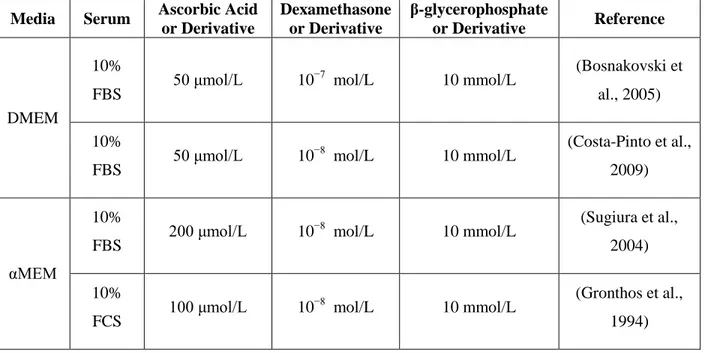
Table 2-1: Cell culture supplements for the osteogenesis of BMSCs. Abbreviations used are Dulbecco’s modified Eagle’s medium (DMEM), alpha-modified minimum essential Eagle’s medium (αMEM), fetal bovine serum (FBS) and fetal calf serum (FCS) ... 12 Table 2-2: Recent developments in 3D-osteogenesis by BMSCs ... 16 Table 2-3: Summary of the fabrications techniques, materials used and porous network generated
for bone tissue engineering ... 37 Table 4-1: Characteristics of the polymer materials used to create the porous scaffold ... 75 Table 4-2: Quantified volume average pore diameter as a function of annealing time for
45PCL/55PEO vol% after extraction of PEO ... 84 Appendices
Table A3.1: Experimental Conditions of the XPS analysis ... 219 Table A3.2: Atomic sensitivity factors (ASFs) (Wagner & Muilenberg, 1979) ... 220 Table A5.1 : Thresholds for detection of scaffolds and/or minerals in CT-Analyser (CTAn) .... 226
LIST OF FIGURES
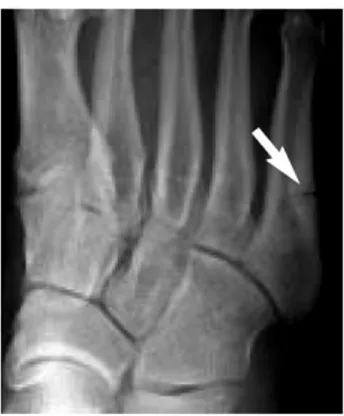
Figure 1.1: Radiograph of a patient with a nonunion stress fracture of the proximal fifth metatarsal (demonstrated by an arrow) (Rosenberg & Sferra, 2000) ... 2 Figure 1.2: Microsomia due to a distraction of the mandible, leading to nonunion bone defect
(Agarwal, 2013) ... 2 Figure 2.1: Representative tissue engineering process involving in vitro expansion of healthy
autologous cells (Bartis, 2011) ... 6 Figure 2.2: Musculoskeletal tissue donors over the years in the US (AATB, September 2010) ... 7 Figure 2.3: (a) the interface between the new bone and HA scaffolds, 2 months post-implantation.
(b) and (c) are high magnifications of (a) (adapted from (Scaglione et al., 2012)) ... 8 Figure 2.4: Histological micrograph of a bioglass scaffolds pre-seeded and cultured in alpha
essential medium (αMEM) with primary rat bone marrow stromal cells, and implanted in rat cortical bone defects for 4 weeks. Stevenel's Blue as the stain and Van Gieson's Picro-Fuchsin was used as counterstain (SVG stain). S, B and CB are scaffold, new bone and host cortical bone (adapted from (Livingston et al., 2002)) ... 9 Figure 2.5: Differentiation strategies of BMSCs (adapted from (Seong et al., 2010)) ... 11 Figure 2.6: Foreign body reaction by disordered tissue formation (arrow) to bio-incompatible
polyethylene material. The scaffold is represented by the letter S (Ehashi et al., 2014) ... 19 Figure 2.7: Tissue ingrowth by hematoxylin and eosin (H&E) staining and in vivo degradation of
the scaffold by near-infrared fluorescence (NIR) imaging (adapted from (Kim et al., 2013)) ... 19 Figure 2.8: Mechanical interlocking of the new bone into porous titanium scaffolds. The scaffold
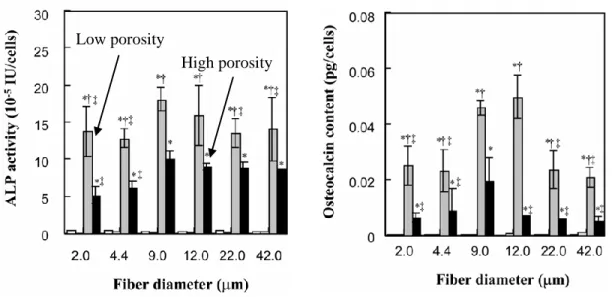
and new bone are represented by the letters S and B respectively (adapted from (De Vasconcellos, 2012)) ... 20 Figure 2.9: ALP and osteocalcin activity of mesenchymal stem cells in low porosity (grey) vs.
high porosity (black) PET fibers. Small bars correspond to culture in non-osteogenic medium (Takahashi & Tabata, 2004) ... 22
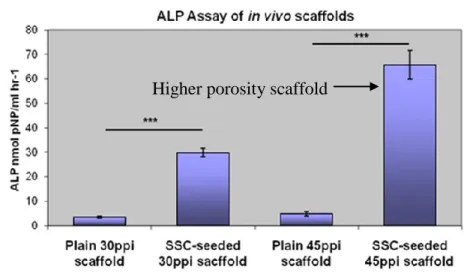
Figure 2.10: More new bone formation inside PLGA Scaffolds evidenced by SVG stain at 8 weeks post-surgery in rabbit cranial defects with an increase in porosity towards the center of the scaffold (yellow rectangle). (adapted from (Roy et al., 2003)) ... 23 Figure 2.11: Higher porosity in HA/TCP scaffolds leads to higher ALP activity (better
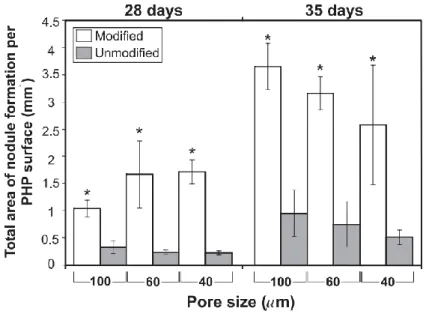
differentiation of preseeded MSCs) (Aarvold et al., 2013) ... 23 Figure 2.12: Neutral effect of pore size on mineral nodule formation (Akay et al., 2004) ... 24 Figure 2.13: Positive impact of the increase in pore size in the amounts of mineral deposits
detected (adapted from (Huri et al., 2014)) ... 25 Figure 2.14: MTT assay showing the positive effect of chitosan modification after on the L929
cell viability after 1, 3 and 5 days of culture as compared to pure PLA (Xiao et al., 2008) .. 27 Figure 2.15: X-ray radiographs of a human femur (a) without and (b) with an artificial hip joint
(adapted from (Niinomi & Nakai, 2011)) ... 28 Figure 2.16: Chemical structure of polycaprolactone ... 29 Figure 2.17: Goldner's trichrome staining (mineralized tissue = green; osteoid (unmineralized) =
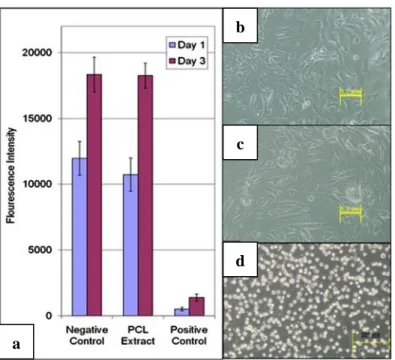
red) reveals newly formed mineralized bone after 4 weeks post-implantation (adapted from (Yeo et al., 2010)) ... 30 Figure 2.18: Cytotoxicity assay of PCL by the extract dilution method: (a) Cell viability of
osteoblasts by Picogreen assay; cells in (b) negative control (fresh culture medium); (c) PCL extract; (d) positive control (extract from latex rubber gloves) (adapted from (Sudarmadji et al., 2011)) ... 32 Figure 2.19: Chemical structure of chitosan (Hoemann et al., 2013) ... 34 Figure 2.20: Fabrication techniques for the production of polymer scaffolds (Dalton et al., 2009) ... 36 Figure 2.21: (a) Rotor-blades of an internal mixer (ISMAC); and (b) Schematic of internal
mixing (adapted from (Xiang et al., 2009)) ... 41 Figure 2.22 : SEM micrographs of PLLA/PS binary blend at a) 80/20 and b) 60/40 v% (adapted
Figure 2.23: Transmission electron micrographs for PMMA/PS blends at different blend compositions: (a) 90/10, (b) 50/50, (c) 30/70 (Steinmann et al., 2001) ... 43 Figure 2.24: Schematics of a co-continuous structure in the binary blend A/B: (a) phase A is
extracted, (b) phase B is extracted (adapted from (Gergen W.P., 1996)) ... 44 Figure 2.25: Co-continuity explained by the percolation theory (Hsu & Wu, 1993) ... 45 Figure 2.26: Mean form factors for both circular and irregular domains of PMMA/PS blends as a
function of composition (Steinmann et al., 2001) ... 47 Figure 2.27: Interfacial area per unit volume of the blends as a function of composition in
PS/PEO blends. The composition range of 35-65% is considered co-continuous (Galloway & Macosko, 2004) ... 48 Figure 2.28: Effect of interfacial tension for different blend systems on (a) Continuity
development, (b) Pore size as a function of minor phase composition (Li et al., 2002a) ... 54 Figure 2.29: The effect of copolymer content on the average size of PE in a PS90/PE10 blend
(Mekhilef et al., 1997) ... 55 Figure 2.30: Effect of annealing time on the pore size in a blend of PLLA/PCL at 50/50 % (a) no
annealing, and (b) 2h annealing (adapted from (Sarazin et al., 2004)) ... 57 Figure 2.31: Effect of annealing temperature for on the pore size in a blend of PLLA/PS (a)
190°C, (b) 200°C, and (c) 220°C (adapted from (Yuan & Favis, 2004)). All the blends have been annealed for t = 1h. ... 58 Figure 2.32: Schematic of the Layer-by-Layer (LbL) deposition technique. The substrate is
positively charged in this case (adapted from (Decher, 1997)) ... 61 Figure 2.33: Effect of the addition of salt on the adsorption behavior of polyelectrolytes (Schwarz
& Schönhoff, 2002) ... 63 Figure 2.34: Thicknesses of LbL (PSS/PDADMAC)10 films deposited on silicon wafers using a
series of NaCl concentrations (Dubas & Schlenoff, 1999) ... 63 Figure 2.35: Thickness of a (PDADMAC/PSS)n multilayer film deposited from a 1.0 M NaCl salt
Figure 2.36: Thickness of (PSS/PDADMAC)5 films as a function of polyelectrolyte concentration
(NaCl salt concentration of 1M) (Dubas & Schlenoff, 1999) ... 65 Figure 4.1: Complex viscosity and storage modulus as a function of frequency at 100°C ... 81 Figure 4.2: SEM micrographs of 45PCL/55PEO annealed at 160°C for a, b, c and d represent 30
min, 1h, 2h, and 3h, respectively. Scale bar = 200 microns ... 82 Figure 4.3: Volume average pore diameter as a function of annealing time. The pore diameter
was directly proportional to the annealing time (r2 = 0.99), thus providing the ability to create pores between 40 and 212 μm by simply altering the duration of annealing ... 83 Figure 4.4: Pore size distribution as a function of annealing time for a non-annealed vs. 1h
annealed scaffold. Non-annealed scaffolds display a polymodal pore distribution consisting of much smaller pores ... 85 Figure 4.5: Pore size distribution as a function of annealing time for a 0.5h and 2h annealed
scaffolds. Annealed scaffolds are made up of larger unimodal sized pores ... 86 Figure 4.6: Continuity percentage of PEO porogen phase as a function of PEO composition. The
broad region of continuity between 35% and 55% demonstrated that all the pores were accessible to the solvent, and thus pore interconnectedness was evident ... 87 Figure 4.7: Infiltration assay setup where migrating agents seeded in the scaffolds can either be
beads or hBMSCs ... 88 Figure 4.8: Cell/Bead retention capacity. 141 micron is the pore size threshold beyond which
cells behave like model beads and infiltrate the scaffolds more homogeneously ... 89 Figure 4.9: Cell/Bead escape. 141 micron is the pore size threshold beyond which cells behave
like model beads and infiltrate the scaffolds more homogeneously ... 89 Figure 4.10: Phase contrast images of the rectangular cross section as a qualitative measure of
bead penetration from the top toward the bottom of the scaffolds; dark spots (arrows) are beads. The panels correspond to 84 micron-Sample 2 (a), 116 micron-Sample 3 (b), 141 micron-Sample 4 (c) and 162 micron-Sample 5 (d) scaffolds. At low pore size, model beads penetrate toward the center. Scale bar = 100 microns... 90
Figure 4.11: Confocal images of the scaffolds showing cell penetration from the top toward the bottom of the scaffolds; white spheres (arrows) are fluorescent cell nuclei, dashed line represents the seeding area or top of the scaffolds. The panels correspond to 84 micron-Sample 2 (a), 116 micron-micron-Sample 3 (b), 141 micron-micron-Sample 4 (c) and 162 micron-micron-Sample 5 (d) scaffolds. At low pore size, cells tend to self-aggregate at the top of the scaffolds. Scale bar = 100 microns ... 91 Figure 4.12: AlamarBlue® assay was used to measure cell viability of L929 cells cultured on
PCL scaffolds as compared to a control monolayer culture, n=4 ... 93 Figure 4.13: (a-b) Fluorescent images of L929 cells inside the scaffold, (c) Fluorescent image of
subconfluent L929 cells on the tissue culture plate (positive control), Live and dead cells are represented by green and red color, respectively. (d) Phase contrast image of L929 cells and PCL scaffold. PCL scaffolds were not cytotoxic as the monolayer cells grow directly underneath the scaffold without necrosis. Scale bar = 100 microns ... 94 Figure 5.1 : Fluorescent imaging of 3D porous cubes (a) before and (b) after submersion in 50
µg/mL RITC-chitosan for 5 min, rinsing and drying. The exposure was maintained constant to permit a direct comparison ... 110 Figure 5.2: Evaluation of coating homogeneity using the dip-coating strategy on 2D solid discs of
pure PCL: (a) Schematic of the 2D solid discs with X-ray emission at positions 1,2 and 3, (b) XPS measurements of the relative nitrogen concentration (%) on two identical random discs (PCL1 and PCL2) at positions 1, 2 and 3 ... 111 Figure 5.3: ToF-SIMS Analysis of (a) C6H11O3- as the characteristic ion for PCL and (b) CNO- as
the characteristic ion for chitosan on the coated samples ... 112 Figure 5.4: Weight increase (%) of large 3D substrates as a function of the number of deposited
polyelectrolyte layers in the LbL approach. Odd and even layer numbers represent PDADMAC and PSS depositions respectively. Three main regions are detected according to point to point slopes: Region I or the surface preparation region where interpenetration of layers is dominant. Region II as an onset for layer buildup phenomenon, and Region III where more well-defined layers are established ... 114 Figure 5.5: Chemical structures of PDADMAC and PSS polyelectrolytes ... 115
Figure 5.6: Effect of the number of deposited layers on the atomic composition of the outermost layers on the 2D solid disc substrate. n=4 and n=8 both represent PSS as the outermost layer. Data shown as mean ± standard deviation, N=3 ... 116 Figure 5.7: Efficiency evaluation of the chitosan layer deposition via the LbL approach on 2D
solid discs: XPS spectra of neat and 8 layer LbL coated PCL. Nitrogen peak is observed at 401 eV for the coated sample ... 118 Figure 5.8: XPS measurements of the relative nitrogen concentration (%) on two random discs
(PCL1 and PCL2) at positions 1, 2 and 3 mentioned in Figure 5.2a ... 119 Figure 5.9: Effectiveness of chitosan coating by using the LbL approach in 3D porous cubes:
Relative nitrogen concentration (%) on 2D solid discs (2D-solid) as the positive control; top section of 3D porous cubes (Top-3D cube); and the middle section of the same samples (Inside-3D cube). Data shown as mean ± standard deviation, N=3. Bars with the same symbols (*, #) show significant differences with p < 0.05 ... 120 Figure 5.10: (a) Schematic of the 3D porous cubes with X-ray emission at different positions and
different depths. (b) Local distribution of the LbL coated chitosan by XPS measurements performed at positions 1,2 and 3 and at levels A, B and C. At least 1% of chitosan was detected at all the scanned points ... 121 Figure 5.11: FEG-SEM images of the LbL chitosan coated sample: (a) Microscopic roughness of
the final layer assembly. An average thickness value of 610 nm was estimated using image analysis; and (b) Pore surface of a 3D porous cube after LbL but without chitosan coating. The scale bar represents 1 micron ... 122 Figure 6.1: (a, b) Micro-computed tomography and (c, d) SEM images exhibiting the
macrostructure of the scaffolds. SEM micrographs showing the surface topography of the samples of (e, f) pure and (g, h) chitosan modified PCL surface. The panels correspond to PCL1 (a, c, e, g) and PCL2 (b, d, f, h). The pore surface topography of PCL demonstrates a change from smooth toward rough microstructures for both PCL1 and PCL2. White arrows represent chitosan layer aggregates. Scale bars (c to h) are 5 to 100 microns, as indicated. ... 141
Figure 6.2: Fluorescent images of the Hoechst stained hBMSCs on the seeding area, where white contours represent the top view porous areas where the cells have freely penetrated through and completely left the top surface (a-c) or infiltrated the depth of the scaffold cross-section (d-f), as shown by confocal images of the Hoechst stained cells in the rectangular cross section of PCL2 scaffolds. The panels represent classical seeding at 37°C (a, d), cold seeding at 4°C with 2% FBS (b, e) and 2-step seeding at 37°C (c, f). Cold seeding exhibits the most uniform cell distribution across the PCL scaffold. Scale bar = 1 mm ... 143 Figure 6.3: (a) AlamarBlue® metabolic assay as an indirect method to compare the number of
cells that completely passed through the PCL2 scaffolds seeded with different seeding protocols: classical seeding at 37°C, cold seeding at 4°C with 2% FBS and 2-step seeding at 37°C. The cold seeding protocol with 2% FBS demonstrates the highest number of escaped beads which corresponds to the best cell penetration. The classical seeding protocol gave lower escape than cold-seeding and higher than the 2-step condition (P < 0.05); and (b) Average percentage of cell numbers counted at each penetration depth for each seeding protocol. α is the deviation from homogeneity of cell distribution at each penetration depth calculated. The homogeneity percentage for three penetration depth is 33%. The cold seeding protocol with 2% FBS displays the lowest deviation from homogeneity. ... 144 Figure 6.4: ESEM micrographs of hBMSCs on (a) uncoated and (b) chitosan coated pores of PCL
at day 2. Isolated hBMSCs (thick arrow) form rounded morphologies with filopodia (thin arrows) on the uncoated pores, whereas they fully spread on the chitosan coated pores of the scaffold. ... 145 Figure 6.5: ESEM images of the pore interspacial area for (a-d) PCL1, (e-h) chitosan surface
modified PCL1, (i-l) PCL2, (m-p) chitosan surface modified PCL2. The panels represent PCL scaffolds cultured at day 2 (a, b, e, f, i, j, m, n), day 10 (c, g, k, o) and day 31 (d, h, l, p). White rectangle in panel E upper zone represents the fully colonized area. Thin arrows represent collagen fibers and ECM sheets, whereas thick white arrows illustrate hBMSCs. White arrow-heads represent pores with dense ECM fibers. The open white arrowhead in panel G illustrates the likely detachment of the chitosan layer. Scale bar in panels (c, d), (b, f, g, j, k, n, o), (h, l, p), (a, i), and (e, m) = 5, 10, 20, 50 and 200 microns, respectively ... 146
Figure 6.6: Histological images of H&E stained extracellular matrix illustrating the rectangular cross section of (a-d) PCL1, (e-h) PCL2, at (a, b, e, f) day 10 and (c, d, g, h) day 31 in the (a, c, e, g) absence and (b, d, f, h) presence of chitosan coating. hBMSCs on the ECM in the pore interspace area and on the pore surface is represented by white and black arrow-heads. The black rectangle represents the depth of the constructs. At day 10, hBMSCs in unmodified scaffolds prefer to remain on the deposited matrix in the space between the pores, whereas they spread on the pore surface of chitosan coated scaffolds. At day 31, chitosan coated scaffolds exhibit a more uniform matrix deposition across the scaffold. Panels a, b, e, f: dry-mount sections to retain PCL scaffold (S). Panels c, d, g, h: toluene-extracted PCL scaffold (ES). White arrowheads: interpore cells. Black arrowheads: cells adhering to pore surfaces. Scale bar = 100 microns ... 147 Figure 6.7: Alizarin red stained (a-d, J) PCL1 and (e-h, L) PCL2 sections at (a, b, e, f) day 10 and
(c, d, g, h, j, l) day 31 in the (a, c, e, g) absence and (b, d, f, h, j, l) presence of chitosan coating. White dashed rectangles represent the areas inside the PCL scaffolds where minerals are observed. Thick white arrows show the deposited calcium nodules; micro-CT images of chitosan surface modified (i) PCL1 and (k) PCL2 scaffolds. Thin and thick arrows respectively represent an outer skin of partly mineralized ECM, and likely minerals at the periphery of the scaffolds. Minerals are deposited in the highly colonized top and inner sections of uncoated PCL1 and PCL2 scaffolds, whereas they were deposited along the surfaces of the edge and inner pores in chitosan coated samples. Scale bar for panels (a-h, j, l) = 100 microns ... 149 Figure 6.8: (a) Extracellular matrix % on the edge and in the depth of the sections for PCL1 and
PCL2 scaffolds in the presence or absence of chitosan coating according to quantitative histomorphometry. Although chitosan coating does not significantly affect the amount of ECM deposited, the formation of ECM becomes more uniform across the surface-modified scaffolds; (b) Mineral % on the edge and in the depth of the sections for PCL1 and PCL2 scaffolds in the presence or absence of chitosan coating. There is a significant increase in the mineral % on the edge and in the depth of PCL1 scaffolds by modifying the surface with chitosan. This effect was not significant for PCL2 discs. Statistical significance was observed for (*, §) and (#, $, @) conditions at p < 0.005 and p<0.05, respectively ... 150
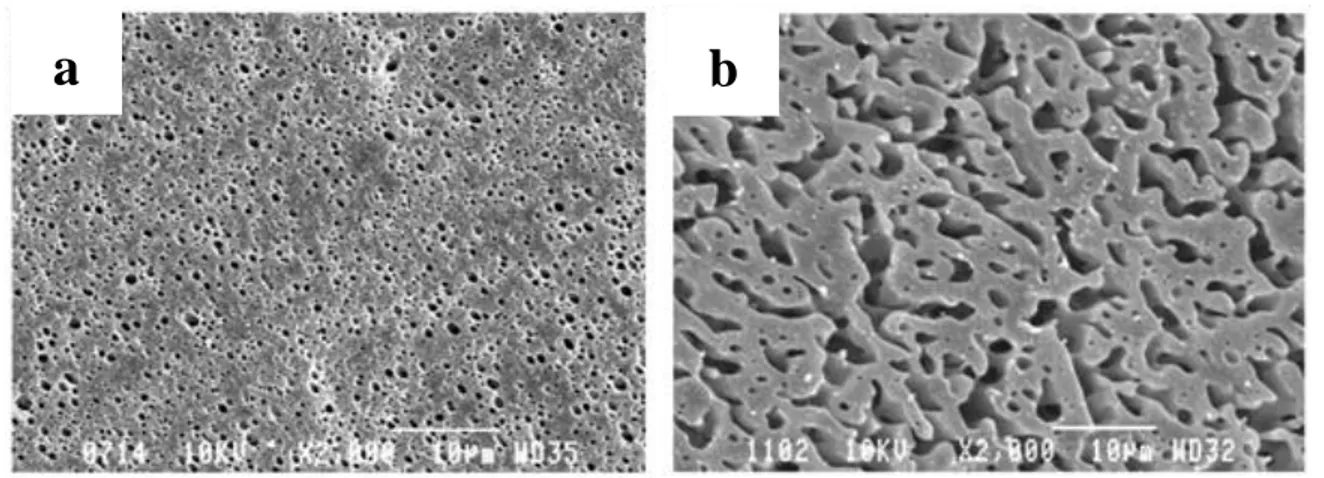
Figure 6.9: (a, c) Alkaline phosphatase and (b, d) alizarin red staining of the 2D cultured monolayer hBMSCs at day 31 in the (a, b) absence and (b, c) presence of chitosan coating on the wells. Although there is an increase in the ALP activity of the cells, chitosan suppresses the matrix mineralization ... 151 Figure 7.1: SEM microstructure of a) 50PLA/50PEO vol% and b) 50PCL/50PEO vol%. Scale bar
= 10 microns ... 160 Figure 7.2: Resistance of co-continuous PCL/PEO blend to annealing at 100°C. (a) non-annealed;
(b) t= 20 min; and c) t= 30 min ... 161 Figure 7.3: (a,b) Atomic force microscopy images (phase mode) of the interface between the PCL
and a pore; and (c) SEM image of the same area showing an external layer with a considerable submicron thickness ... 163 Appendices
Figure A1.1: Cups made of titanium-aluminum-vanadium alloy core with a pure titanium fiber mesh on the surface (adapted from (Baad-Hansen et al., 2011) ) ... 200 Figure A1.2: (a, b) SEM images of CaSiO3 scaffolds, (c) H&E images of explanted scaffolds 8-weeks post-surgery: NB stands for new bone, and d) % bone formation by micro-CT analysis (adapted from (Wu et al., 2012)) ... 201 Figure A1.3: ALP activity of MSCs seeded in the mesoporous bioactive glass scaffolds at Days
1, 3 and 7. ALP activity is considerably higher than that of the control culture plate (Wu et al., 2011) ... 202 Figure A1.4: Bone healing scores in tibia defects (0 = empty cavity, 7 = bone only) (Aslan et al.,
2006) ... 204 Figure A1.5: VK staining of PGA sections at (a) 3 and (b) 6 weeks post-seeding. Mineral
deposition increased considerably with time (adapted from (Wang, Dormer, Bonewald, & Detamore, 2010)) ... 205 Figure A1.6: Goldner-Masson stained image of a rat tibial head defect: PLGA scaffold (S) has
been completely invaded by newly formed lamellar bone (adapted from (Penk et al., 2013)) ... 207
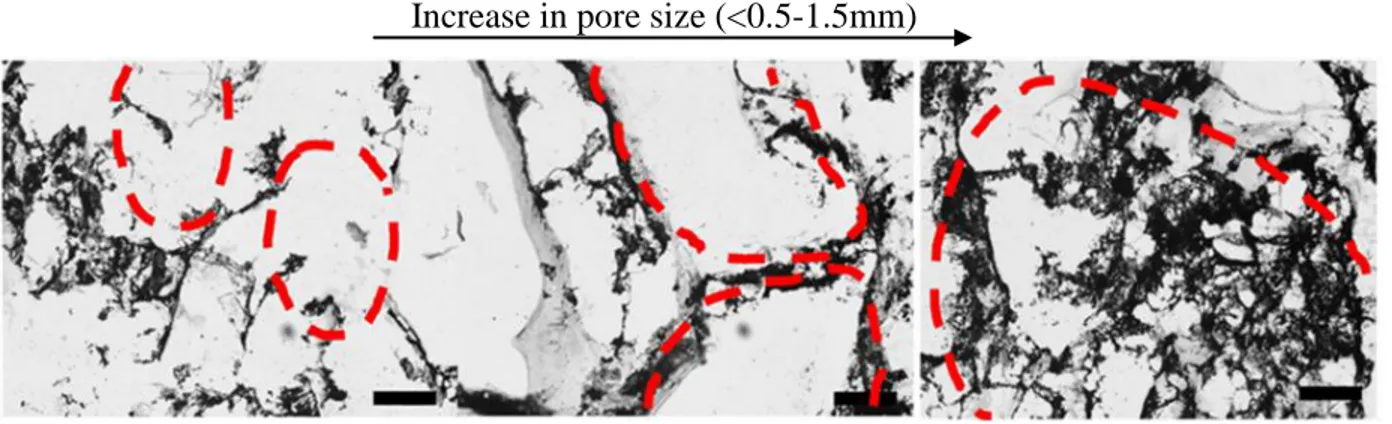
Figure A1.7 : ALP activity of MG63 cells on the scaffolds. Asterisks denote significant differences (*p<0.05, **p<0.01, ***p<0.001) (Park et al., 2011) ... 209 Figure A2.1: Phase diagram of a binary fluid (Raudino et al., 2011) ... 212 Figure A2.2: Schematic of an electrospinning set up (Bhardwaj & Kundu, 2010) ... 215 Figure A3.1: Penetration depth of X-ray and detection depth by XPS (adapted from (Shu)) ... 218 Figure A3.2: Typical XPS spectrum (Wagner & Muilenberg, 1979) ... 218 Figure A4.1: Effect of toluene on the information obtained by H&E and VK staining ... 221 Figure A4.2: Effect of pore size on the infiltration and tissue formation within PCL scaffolds.
Red squares represent areas where ECM is missing ... 222 Figure A4.3: Effect of chitosan surface treatment on the deposition of ECM ... 223 Figure A4.4: Efficiency of VK (Tol Blue) as compared to AR staining ... 224 Figure A4.5: Side-by-side H&E and AR 5x images of PCL-only scaffolds at Day31 ... 225 Figure A4.6: Side-by-side H&E and AR 5x images of PCL-chitosan scaffolds at Day31 ... 225 Figure A5.1: Real and false-positive signals for minerals at Day 31 (scaffolds cross-section) ... 227 Figure A6.1: EDX analysis of chitosan-coated PCL scaffolds at Day31 points to successful biomineralization ... 229
LIST OF APPENDICES
APPENDIX 1: BONE TISSUE ENGINEERING MATERIALS ... 199 APPENDIX 2: SCAFFOLD FABRICATION TECHNIQUES ... 210 APPENDIX 3: XPS ANALYSIS OF MULTILAYER FILMS ... 217 APPENDIX 4: SUPPLEMENTARY HISTOLOGICAL DATA ... 221 APPENDIX 5: MICRO-COMPUTED TOMOGRAPHY ... 226 APPENDIX 6: ENERGY-DISPERSIVE X-RAY SPECTROSCOPY ... 228
NOMENCLATURE
English Letters
A Area
a Area of one adsorbed nitrogen molecule c Dimensionless coefficient
d Average pore diameter
ff Form factor
G’ Storage modulus
k Dimensionless coefficient
Mw Weight average molecular weight
Mn Number average molecular weight
N Avogadro’s number
P Perimeter of the domains
p Droplet viscosity/matrix viscosity (Tomotika)
R Ideal gas constant
r Pore radius
R0 Initial thread radius
T Temperature
Tg Glass transition temperature
t Time
VA Molar volume of component A
V Pore volume
Vm Volume of the gas required for monolayer adsorption
Greek letters
∆Gmix Gibbs free energy of mixing
∆Hmix Enthalpy of mixing
∆Smix Entropy change by mixing α Deviation from homogeneity
α0 Initial distortion amplitude
γ Interfacial tension of the blend components δA Solubility parameter of component A
ηA Viscosity of component A
θ Contact angle of mercury
γ Interfacial tension of the blend components δA Solubility parameter of component A
ηA Viscosity of component A
θ Contact angle of mercury
λ Viscosity ratio
σ Surface tension
φA Volume fraction of phase A
χAB Interaction parameter between phase A and B
ω Weight fraction
Abbreviations
ALP Alkaline phosphatase
AR Alizarin Red
BET Brunauer–Emmett–Teller Apparatus BMP-2 Bone Morphogenic Protein-2
BMSC Bone Mesenchymal Stem Cells CCM Complete culture medium
CT Computer tomography
DDA Degree of deacetylation
Dex Dexamethasone
ECM Extracellular Matrix FBS Fetal bovine serum
FEG-SEM Field emission gun scanning electron microscope
GP β-glycerophosphate
HA Hydroxyapatite
hBMSC Human Bone Mesenchymal Stem Cell
LbL Layer-by-Layer
MIP Mercury intrusion porosimetry PAA Poly(acrylic acid)
PAH Poly(allylamine) hydrochloride PBS Phosphate buffer saline
PCL Poly(ε-caprolactone)
PDADMAC Poly(diallyl dimethyl ammonium chloride) PEG Poly(ethylene glycol)
PEO Poly(ethylene oxide) PGA Poly(glycolic acid)
PLLA Poly(L-lactic acid)
PMMA Poly(methyl methacrylate)
PS Polystyrene
PSS Poly(sodium 4-styrenesulfonate) (PSS) PVA Polyvinyl alcohol
RGD Arg-Gly-Asp tripeptide RITC Rhodamine isothiocyanate
SEBS Styrene ethylene butylene styrene block copolymer SEM Scanning electron microscopy
TCP Tricalcium phosphate
TGF-β Transforming growth factor beta TIPS Thermally-induced phase separation
ToF-SIMS Time of flight secondary ion mass spectrometry XPS X-ray photoelectron spectroscopy
CHAPTER 1
INTRODUCTION AND OBJECTIVES
1.1 Introduction
Broken bone is one of the most painful medical conditions that people are commonly suffering from every day. Even the seemingly simple bone fractures could potentially cause recurring pain through a lifetime and may eventually require physical therapy or surgery as the last measure. According to the most recent data, over 717,000 Canadians aged 12 or older suffered from broken or fractured bones in the years 2009 and 2010, which is approximately 2% of the whole population (Canadian Community Health Survey, 2009-2010). Although sport accidents seem to be the most common cause for fractured bones, an average Canadian suffers from a broken bone triggered by road accidents, falls and animal attacks. Among all mentioned causes, fall accidents are the main unintentional reason for the initiation of a fracture or eventually breaking a bone. Only in the years 2009 and 2010, over 1,714,000 fall accidents were reported which mostly led to injuries in the hands and the spine (Canadian Community Health Survey, 2009-2010).
Most of the bone fractures heal naturally through a cascade of overlapping events comprised of three major phases: inflammation, repair and remodeling (Remedios, 1999). However, depending on the type of the fracture, fracture stability, and fracture gap some variations in these healing phases might occur, which are not the focus of this thesis study. Although most fractures heal naturally through all or a portion of the aforementioned classical bone healing steps, certain complications do exist.
Delayed and nonunion fracture healings across species are defined as follows. By definition, when a bone fracture is not repaired in an expected time frame, yet signs of healing still exist, a delayed fracture healing is occurring (Taylor, 1992). On the other hand, when the normal healing process is permanently ceased without attaining completion, it is perceived that a nonunion fracture healing has taken place (Taylor, 1992). A considerable percentage of 5-10% of bone fractures end up as delayed or nonunion fractures, which accounts for 35,850-71,700 Canadians in 2009-2010 (Canadian Community Health Survey, 2009-2010). Figure 1.1 illustrates a nonunion fracture at the proximal fifth metatarsal bone.
There are two main factors that contribute to the formation of delayed and nonunion fractures: insufficient fracture stability and inadequate biologic environment. The existence of either or the
combination of both these adverse parameters increases the chance of such bone healing abnormalities. Other factors include inadequate vascularity, lack of nutrition, large fracture gaps, interposition of soft tissue between the fracture gaps, unfavorable metabolism, patient’s age, infection and administration of drugs that can interfere with the healing process (such as anticoagulants) (Bartels, 1987; DeAngelis, 1975; Hoefle, 1993).
Figure 1.1: Radiograph of a patient with a nonunion stress fracture of the proximal fifth metatarsal (demonstrated by an arrow) (Rosenberg & Sferra, 2000)
In some cases, these complications occur because of the excessive extraction of bone during surgery, which leads to degenerative abnormalities with very little bone mineralization at the site of the injury. Figure 1.2 demonstrates the posteroanterior skull radiograph of a young female with microsomia (i.e. abnormal smallness of body parts) who had undergone distraction of the mandible.
Figure 1.2: Microsomia due to a distraction of the mandible, leading to nonunion bone defect (Agarwal, 2013)
The exact approach taken to treat fracture nonunion depends on many parameters such as existence of infection, surrounding tissue damage, and the fracture condition (Chao & Inoue, 2003). However, a long and complicated orthopedic surgery is usually needed to repair the nonunion site. Additionally, although a variety of biological, mechanical and physical approaches have been investigated, there is still a need for a treatment that will consistently assist in the repair of non-healing or delayed healing of bone fractures and also provide convincing evidence that the healing of a fracture can be enhanced (Einhorn, 1995). One promising approach is the use of bone tissue engineering scaffolds to guide local bone regeneration and repair.
Bone tissue engineering also has the potential to be used in order to avoid delayed or nonunion fracture healing for the bones that are more susceptible to poor healing conditions. These sites include upper thigh bone (femur head and neck) and small wrist bones (scaphoid) which have limited vascularity and therefore are more prone to destruction, should an impact occur. Also, moderate blood supply exists in some bones like tibia and might be sufficient for fracture repair, but a severe trauma or injury can destroy internal or external vascular network and therefore natural healing would be compromised. Another example is the fifth metatarsal fractures (i.e., Jones fracture) which usually end up in delayed and nonunion healings despite surgical treatments (Nunley, 2001). Should there be a fracture in the mentioned sites, tissue engineering approaches could be applied to repair the bone and further avoid surgical complications. Furthermore, large defects in load bearing bones with the aforementioned limitations always need graft interventions for providing the best healing conditions (Banes et al., 2001; Khan et al., 2008).
1.2 Research Hypothesis
We hypothesize that PCL scaffolds with controlled pore sizes, fabricated by the melt blending of co-continuous immiscible polymers and surface modified by chitosan, can enhance 3D in vitro osteogenesis of hBMSCs and lead to biomineralization.
1.3 Objectives
The main objective of this thesis is to fabricate a fully functional porous polymeric poly(ε-caprolactone) (PCL) scaffold which can satisfy all features required for in vitro bone tissue engineering (discussed in Section 2.2.3), in order for it to be clinically used as grafts to repair bone fracture nonunions. There are an important number of parameters that have to be considered simultaneously for the design and application of these scaffolds as bone grafts, such as scaffold infiltration behavior, porous microstructure and surface chemistry. The specific objectives of this thesis are thus defined as the following:
1. To fabricate and thoroughly characterize (pore size, pore size distribution, pore interconnectivity, surface chemistry) PCL scaffolds derived by a melt blending approach of PCL/Poly(ethylene oxide) (PEO) followed by static annealing and selective extraction 2. To examine the scaffold infiltration by human bone mesenchymal stem cells (hBMSCs)
by establishing the pore size and cell seeding protocol requirements that yield the most homogeneous cell distribution inside the 3D constructs
3. To systematically modify the hydrophobic surface of PCL by chitosan as a hydrophilic compound and evaluate the uniformity of such surface treatment at all positions inside the 3D scaffolds with considerable and comparable spatial dimensions
4. To determine the effect of pore size and chitosan coating on the in vitro matrix mineralization behaviour of human bone mesenchymal stem cells (hBMSCs) seeded inside 3D porous scaffolds, and elicit matrix calcification through cell-biomaterial interactions
CHAPTER 2
LITERATURE REVIEW
What is tissue engineering and why is it needed? What are the strategies in tissue engineering in general and how do they relate to bone tissue engineering? What are the roles and requirements for bone tissue engineering scaffolds? How are they produced and how can melt blending of polymer blends serve bone tissue engineering? This chapter seeks help from the existing scientific works in literature to answer these questions along with many others.
2.1 Tissue engineering overview
The research into tissues and organs dates back to 3000 B.C. The most ancient and well-known example of creating living creatures from living or non-living specimens is the biblical tale of the creation of Eve from Adam’s rib which triggered the curiosity of men of ancient ages to strive to discover such concepts according to social, cultural and scientific backgrounds of the people in those times. As a result of such curiosities, Theophrastus von Hohenheinm (Paracelsus) tried to find a recipe to create human life by mixing chemical substances in a confined environment, whose efforts of course failed.
Although similar research activities went on for centuries in ancient history, the term “Tissue Engineering” was coined for the first time by Skalak and Fox in 1988 and defined as follows: “Tissue engineering is the application of principles and methods of engineering and life sciences toward the fundamental understanding of structure-function relationships in normal and pathological mammalian tissues and the development of biological substitutes to restore, maintain, or improve tissue functions” (Skalak & Fox, 1988). Therefore, the concept of tissue engineering can be considered mostly as a therapeutic action whose aim is to replace, remove, repair or reconstruct a lost or damaged tissue.
In general, two main parameters are required for tissue engineering: cells and matrix also known as scaffold. These two fundamental elements will be discussed further in detail in this chapter. There are several strategies in tissue regeneration: first strategy involves the implantation of a biomaterial matrix inside the injured region, in order to fill the gaps produced by the defect and let the body repair the defect by growing tissue on the implanted matrix. However, a typical
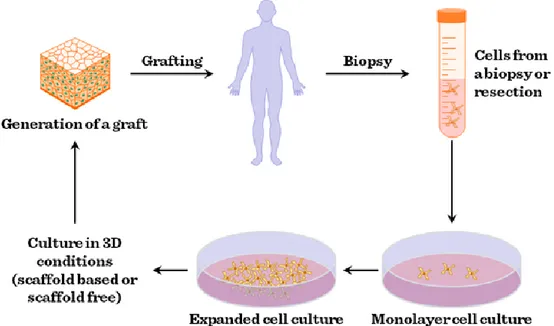
in-vitro tissue regeneration process involves the incorporation of cells into the matrix followed by in vitro cultivation and maturation over a certain period of time, and eventually its implantation into the target body (Figure 2.1). The advantage of this technique is that less cellular migration from the host body to the damaged region is needed, since the already present cells in the scaffold have initiated the deposition of extracellular matrix which accelerates the healing process (Mano et al., 2002). Bone tissue engineering strategies will be discussed in further detail in section 2.2.1.
Figure 2.1: Representative tissue engineering process involving in vitro expansion of healthy autologous cells (Bartis, 2011)
2.2 Bone tissue engineering
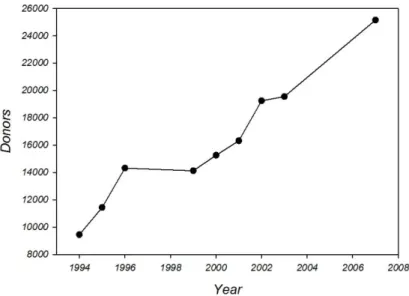
Even though an estimation on total bone grafting procedures performed in Canada does not yet exist, this value for the United States is predicted to be approximately half a million per year (AATB, September 2010). It is a known fact that there is a critical shortage of musculoskeletal tissue donors who are crucial to these procedures. Figure 2.2 depicts the evolution of the number of musculoskeletal tissue donors before the year 2007 (AATB, September 2010). The number of donors of these types of tissues account for only 5% of the total required grafting procedures. As a result of such shortage in donor supplies, the sales for bone grafts and graft substitutes have
increased substantially from $300 million in 1999 and reached a value of $1.5 billion over a period of 10 years (Orthopedics Network News, 2011).
Figure 2.2: Musculoskeletal tissue donors over the years in the US (AATB, September 2010)
2.2.1 Bone tissue engineering strategies
2.2.1.1 Osteoconduction
In the Osteoconduction strategy, as the oldest approach used in bone regeneration (Keating & McQueen, 2001), bone graft (scaffold) acts as a supportive “bridge” which due to its specific microstructure facilitates the migration, attachment and distribution of the host cells involved in vascular bone ingrowth and healing (Bauer & Muschler, 2000; Fleming et al., 2000; Keating & McQueen, 2001). For instance, hydroxyapatite (HA) grafts have proved to possess osteoconductive properties as new bone was shown to form around and inside the implant (Figure 2.3) (Scaglione et al., 2012). Since the scaffolds are not pre-seeded with cells in the osteoconductive approach, the efficiency of bone formation in the healing process is mostly dependent upon the three-dimensional (3D) micro-architecture, porosity, surface chemistry and in vivo degradation time of the scaffold. After implantation, the surrounding soft tissue of the host migrates through the porous network and into the voids of the scaffold, which gives a rise to the formation of new fibrovascular tissue and new blood vessels. These newly formed blood vessels could again drive more bone-forming cells to the damage site and accelerate the healing process
(Fleming et al., 2000). Although bone itself is the most osteoconductive material, other synthetic biomaterials such as HA whose properties mimic those of the mineral phase of the bone have been extensively studied. As another option, bioactive proteins can be impregnated inside the scaffolds and be delivered to the grafted site in order to enhance bone regeneration (Fleming et al., 2000).
Figure 2.3: (a) the interface between the new bone and HA scaffolds, 2 months post-implantation. (b) and (c) are high magnifications of (a) (adapted from (Scaglione et al., 2012))
2.2.1.2 Osteoinduction
Osteoinduction is the ability of a biomaterial scaffold to induce migration and differentiation of osteogenic precursor cells in the surrounding host tissue (Ladd & Pliam, 1999; Weigel, 1993). Although by definition osteoinductivity is an intrinsic behaviour of the graft material, synthetic biomaterials are not capable of such feature without the incorporation of functional bioactive molecules. These biomolecules include epidermal growth factor (EGF), platelet-derived growth factors (PDGFs), fibroblast growth factor (FGF), transforming growth factor beta (TGF-β) superfamily, and parathyroid hormone (PTH) (Muschler & Midura, 2002). Among these bio-agents, bone morphogenetic proteins (BMPs) are the most investigated osteoinductive stimuli (Klokkevold 2003).
HA