DIAL • 4, rue d’Enghien • 75010 Paris • Téléphone (33) 01 53 24 14 50 • Fax (33) 01 53 24 14 51 E-mail : [email protected] • Site : www.dial.prd.fr
D
OCUMENT DE
T
RAVAIL
DT/2004/04
The effect of economic crisis on
youth precariousness in Nairobi.
An analysis of itinerary to adulthood
of three generations of men and women
Alfred O. AGWANDA
Philippe BOCQUIER
Anne KHASAKHALA
Samuel OWUOR
THE EFFECT OF ECONOMIC CRISIS ON YOUTH PRECARIOUSNESS IN NAIROBI. AN ANALYSIS OF ITINERARY TO ADULTHOOD OF THREE GENERATIONS OF MEN AND WOMEN1
Alfred O. Agwanda Université de Nairobi [email protected]
Philippe Bocquier DIAL - UR CIPRÉ de l’IRD
[email protected] Anne Khasakhala Université de Nairobi [email protected] Samuel Owuor Université de Nairobi [email protected]
Document de travail DIAL / Unité de Recherche CIPRÉ Juin 2004
RÉSUMÉ
Depuis l’analyse pionnière sur le marché de l’emploi menée par le BIT au début des années 1970, le NUrIP, qui a recueilli près de 1.600 biographies auprès d’un échantillon de la population adulte de Nairobi, est la première opération à offrir une vue globale de l’emploi et de la situation sociodémographique à Nairobi. Les analyses dressent l’image d’une surprenante stabilité du processus d’entrée dans la vie adulte à Nairobi. Le calendrier des évènements reste le même et le retard peut être expliqué essentiellement par la crise économique des années 1990. La ville de Nairobi joue d’abord et avant tout le rôle du principal marché de l’emploi formel au Kenya. Cette caractéristique, qui remonte aux temps coloniaux, influence considérablement le modèle de migration circulaire entre la ville et l’intérieur du pays, ainsi que la formation des ménages et la constitution de la famille. Alors que l’emploi est clairement la clé d’entrée dans la vie adulte pour les hommes, il joue un rôle marginal pour les femmes. Cela peut expliquer pourquoi le marché de l’emploi de Nairobi a réagi à la crise des années 1990 en rejetant les femmes. Les différences de genre sont plus frappantes que les différences entre générations et selon l’origine géographique ou sociale. Les discriminations envers les femmes sur le marché de l’emploi de Nairobi sont à considérer sérieusement comme une cause du déclin du taux d’activité des femmes.
ABSTRACT
Since the pioneer analysis of the labour market by the ILO team in the early 1970s, the NUrIP, which collected about 1,600 biographies among a sample of the Nairobi adult population, is the first to provide for a comprehensive view of the social, demographic and employment situation of Nairobi. The analyses draw a picture of surprising stability of the process of entry into adult life in Nairobi. The timing of events remains the same and most of the delay experienced by the younger generation can be attributed to the economic crisis of the 90s. The city of Nairobi is first and foremost the main formal labour market in Kenya. This characteristic that traces back into colonial time vastly influences the model of circular migration between the hinterland and the city and also the household and family formation. Whereas employment is clearly the key to entry into adult life for men, it plays a marginal role for women. That might explain why the Nairobi labour market reacted to the economic crisis of the 90s by rejecting females. Gender differences are more striking than differences by generation or by social or geographical origin. Discrimination against women on the Nairobi labour market should be seriously considered as an explanation for their declining labour participation.
1 The NUrIP, on which most of the original data analysed here originate, was co-funded by CODESRIA, Rockefeller Foundation, Institut
Français de Recherche en Afrique (IFRA), University of Nairobi and Institut de Recherche pour le Développement (IRD). A first version of this paper was presented at the 4th African Population Conference in Tunis, December 8-12, organised by UAPS (Union for African
Contents
INTRODUCTION ... 5
1. THE DATA: THE FIRST RESEARCH ON URBAN INTEGRATION IN EAST AFRICA. 5 2. THE ECONOMIC CONTEXT OF KENYA ... 6
3. NAIROBI IN THE CONTEXT OF URBANIZATION PROCESS IN KENYA ... 10
4. INTEGRATING IN THE CITY: THE PATHS TO ADULTHOOD... 11
4.1. Timing of entry in main life path events: Sequences of entry... 11
4.1.1. Nairobians delayed their entry into adult life... 12
4.1.2. Migrants experienced very few changes from one generation to the next... 14
4.2. Endogenous process of entry into adulthood... 15
4.2.1. Employment is the main determinant of entry of men into adult life ... 17
4.2.2. Females did not really emancipate from their role of mother and spouse... 17
4.3. Exogenous factors that affect entry into adulthood ... 18
4.3.1. Social and cultural factors... 18
4.3.2. Household support ... 19
4.3.3. Human capital... 20
4.3.4. Macro and historical factors ... 20
CONCLUSION: the formal labour market decline explains most of the precariousness of
youth and women in Nairobi... 22
BIBLIOGRAPHY... 23
ANNEXES ... 25
List of tables
Table 1: Gross Domestic Product (GDP) evolution (1964-2001) ... 7Table 2: Estimation of Employment in 1989 and 1999, annual percentage growth (1989-1999) and percentage distribution (Population aged 15-64) ... 8
Table 3: Summary of the main life course events for Nairobians... 11
Table 4: Age at first migration before 30 years old and summary of the main life course events for the migrants who experienced these events in Nairobi ... 12
Table 5: Descriptive statistics for individual in the panel and not in the panel, 1997 ... 15
Table 6: Interactions between main biographical events (Females) ... 16
Table 7: Main factors influencing biographical events (males) ... 18
Table 8: Main factors influencing biographical events (females) ... 18
Table 9: Cox proportional hazard regression on first independent residence in Nairobi (Males)... 25
Table 10: Cox proportional hazard regression on first independent residence in Nairobi (Females)... 26
Table 11: Cox proportional hazard regression on Access to First Employment in Nairobi (Males) ... 28
Table 12: Cox proportional hazard regression on Access to First Employment in Nairobi (Females) ... 29
Table 13: Cox proportional hazard regression on First Marriage in Nairobi (Males)... 30
Table 14: Lexis Diagram of the Age-Period Effect according to the Cox proportional hazard regression on First Marriage in Nairobi (Males) ... 31
Table 16: Lexis Diagram of the Age-Period Effect according to the Cox proportional hazard regression
on First Marriage in Nairobi (Females) ... 32
Table 17: Cox proportional hazard regression on first pregnancy in Nairobi (Males) ... 32
Table 18: Lexis Diagram of the Age-Period Effect according to the Cox proportional hazard regression on the risk of First parenthood(Males)... 33
Table 19: Cox proportional hazard regression on first pregnancy in Nairobi (Females)... 33
Table 20 : Lexis Diagram of the Age-Period Effect according to the Cox proportional hazard regression on the risk of First pregnancy (females)... 34
List of figures
Figure 1: Population Growth and Economic Growth since Independence... 7Figure 2: Proportion Unemployed or Inactive among non-studying Males by Generation... 9
Figure 3: Proportion Unemployed or Inactive among non-studying Females by Generation ... 9
Figure 4: Median age of first main life course events of Nairobian males by generations... 13
Figure 5: Median age of first main life course events of Nairobian females by generations... 13
Figure 6: Median age of first main life course events of male migrants by generations... 14
Figure 7: Median age of first main life course events of female migrants by generations... 15
Figure 8: Interactions between main biographical events (males) ... 16
Figure 9: Interactions between main biographical events (Females) ... 16
Figure 10: Lexis diagram of the age-period effect according to the Cox Proportional Hazard Regression on the risk of first independent housing (Males) ... 26
Figure 11: Lexis diagram of the age-period effect according to the Cox Proportional Hazard Regression on the risk of first independent housing (Females) ... 27
INTRODUCTION
Nairobi is probably one of the best-known African capital cities, but surprisingly, it has been the subject of few comprehensive studies. It is indeed the subject of a pioneer analysis of the labour market by the ILO team in the early 1970s. However, since then, apart from monographs on informal enterprises and settlements, no survey has been able to offer a representative sample of the city. It was therefore almost impossible to capture the diverse social components of the citizens of Nairobi through a common analytical tool. This is the objective of the Nairobi Urban Integration Project (NUrIP), which provides most of the data for the present paper.
Nairobi is one of the major cities in Eastern Africa, matched only in population size by Addis Ababa (Ethiopia), Dar es Salaam (Tanzania) and Harare (Zimbabwe). Nairobi has long been at the centre of stability in Eastern Africa, undisturbed by civil wars unlike many of Kenya’s neighbours. This brought to the Kenyan capital city a reputation of being a business platform for entry into the regional market and helped it maintain its role of safe haven in the region for most international governmental and non-governmental organisations. UNHCR-Habitat and UNEP have their headquarters in Nairobi and many other UN bodies and humanitarian agencies have a regional representation based in Nairobi but operating in Sudan, Somalia, RDC and elsewhere.
However, Nairobi also has a bad reputation for security, corruption, hygiene and basic infrastructure (electricity and water). The high number of international firms and organisations represented in Nairobi contrasts with the poor conditions in which most of its population lives. The capital city reflects the stark economic inequalities in the country and indeed in the world. How can a city with so many assets nurture so much poverty? How can an economic and social redistribution system perform so poorly?
We believe that part of the explanation of the present situation is embedded in the life of today’s citizens of Nairobi. Most of this paper is based on the event history analysis of almost 1600 biographies collected among the Nairobi adult population.
1. THE DATA: THE FIRST RESEARCH ON URBAN INTEGRATION IN EAST
AFRICA
The main purpose of the Nairobi Urban Integration Project (NUrIP) was to measure the medium or long-term effects of the macro-economic changes (e.g. in economic policy, in legislation, etc.) on the job market, on access to housing and on demographic behaviour. We believe that this project will help to answer essential questions on persistence of poverty and its transmission, and its consequences on the family and the most vulnerable groups. It provides policy-makers in the social sector with indicators that can readily be used to improve measures for poverty reduction in the target groups. The methodology used in this type of survey caters for analysing integration along three main lines: access to housing, access to employment, family formation and demographic behaviour. By using a retrospective questionnaire based on these three axes, we can understand the complexity of relations between residential, professional and family lives. This type of analysis offers a social and demographic diagnosis of the city over the 30 or 40 years preceding the survey. The event history analysis used in this survey stresses more the intertwining of events in the long run than on the details of particular events at a given time. It has a strong ability to explain the interrelations between economic, social and demographic behaviour of the population.
Urban integration has been the subject of a number of research programs since 1989 in Africa. At the initiative of several institutions2, surveys have been conducted in Dakar, 1989 (Antoine et al., 1995), Bamako, 1992 (Ouedraogo & Piché, 1995), Yaoundé, 1996 and Antananarivo, 1998 (Antoine et al., 2000). Beyond the interest of each particular survey, the use of a common methodology (Antoine & Bocquier, 1999; Antoine et al., 1999) for both the fieldwork (survey design, survey sampling, questionnaires) and the analysis (mainly event history analysis techniques) allow direct comparisons between the capital cities at stake, as shown in the 1999 publication of the comparative analyses of the surveys conducted in Dakar and Bamako (Antoine et al., 1998).
So far, no research of this kind has been conducted in this part of Africa. The Urban Integration Survey conducted in 2001 in Nairobi is the first in an English-speaking country, Kenya. It is important to analyse urban integration in a different historical, economical and sociological context from the ones in West Africa, Central Africa and Madagascar.
Little is known about how the city-dwellers have access to jobs, housing and how they form their families. Most of the studies on demographic, social and economic conditions in Nairobi conclude that the gap between the rich and the poor populations has widened. But how did it operate and what were the alternative strategies that the poorer population found in the city? Nairobi offers many alternatives for primary, secondary and higher education. How did the family cope with the increasing high cost of education and training? The concept of the urban informal sector was first inspired by Nairobi’s job market in the early seventies (Todaro, 1976). Since then how did the job market evolve both at the formal and at the informal level?
Demographic surveys of Kenya showed that fertility began to decrease in urban areas, particularly in Nairobi (Kenya Government, 1994). Was it a consequence of smaller and more expensive housing? Or is it related to better education and better jobs?
The retrospective data compensates for the lack of reliable and continuous data on the city. This is particularly valuable where little is known due to either scarce or poor quality data. Furthermore, the event history analysis used for these surveys goes beyond the traditional transversal analysis that does not capture time dynamics. The Urban Integration Surveys also offer a standard that has already been adapted in several cities in Africa (Dakar, Bamako, Yaounde, Antananarivo, Lome and Ouagadougou). With this standard, a comparison can readily be made between cities in an African perspective, thus leading to better assessment of each particular situation.
2. THE ECONOMIC CONTEXT OF KENYA
Kenyan population natural growth rate rose steadily from about 2.5 percent per annum in 1948 to around 3.8 percent per annum in the 1980s, a pace that has been described as one of the fastest ever recorded in history. In the mid 1990s the growth rate declined to a current level of about 2.8 percent per annum. The initial rise in population growth rate was attributed to rising fertility but rapidly declining mortality. The change in population growth rate in the 1980s was attributed to declining fertility and almost constant mortality. However, current speculation in population dynamics indicates that although fertility may be declining, there is an apparent increase in mortality due to the HIV/AIDS epidemic (NCPD, 1999).
The Gross Domestic Product (GDP), as in many African countries, essentially measures the formal economy and hence it is an imperfect measure of wealth creation in the country. However, our hypothesis is that the informal sector weighs less in the overall economy. To that extent, GDP annual
2 Institut français de recherche pour le développement (IRD), Institut fondamental d’Afrique Noire (IFAN), Centre d’études et de recherche sur la population pour le développement (CERPOD), Département de démographie de l’Université de Montréal, Institut de formation et de recherche en démographie (IFORD), Centre français d’études sur la population et le développement (CEPED), Institut de statistique de Madagascar, Développement et insertion internationale (DIAL), Unité de recherche démographique de l’Université de Lomé (URD), Unité de recherches et d’études démographiques de l’Université de Ouagadougou (UERD).
variations remain a relevant economic indicator, at least to situate the time of economic crisis in the formal sector and its impact on Nairobi, as we shall see later in the paper.
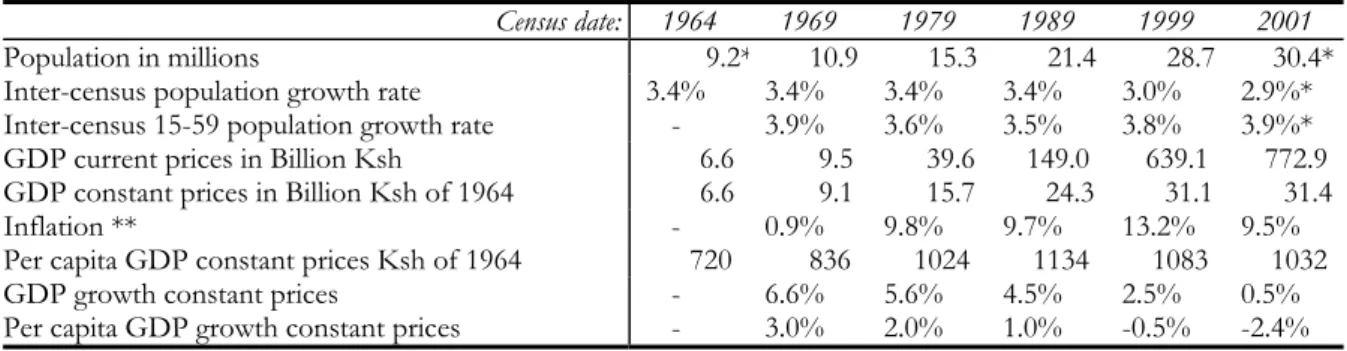
Economic production did not increase in the same proportion as the population (Table 1). While population rose at a constant annual rate of 3.4% since independence in 1963 on to 1989, GDP annual growth was about 6.6% in the years immediately following independence and decreased progressively to reach 4.5% on average in the 1980s. Related to the population, the GDP annual growth actually decreased from 3% to 1% in the same period.
Table 1: Gross Domestic Product (GDP) evolution (1964-2001)
Census date: 1964 1969 1979 1989 1999 2001 Population in millions 9.2* 10.9 15.3 21.4 28.7 30.4* Inter-census population growth rate 3.4% 3.4% 3.4% 3.4% 3.0% 2.9%* Inter-census 15-59 population growth rate - 3.9% 3.6% 3.5% 3.8% 3.9%* GDP current prices in Billion Ksh 6.6 9.5 39.6 149.0 639.1 772.9 GDP constant prices in Billion Ksh of 1964 6.6 9.1 15.7 24.3 31.1 31.4
Inflation ** - 0.9% 9.8% 9.7% 13.2% 9.5%
Per capita GDP constant prices Ksh of 1964 720 836 1024 1134 1083 1032 GDP growth constant prices - 6.6% 5.6% 4.5% 2.5% 0.5% Per capita GDP growth constant prices - 3.0% 2.0% 1.0% -0.5% -2.4% Figure 1: Population Growth and Economic Growth since Independence
-4% -2% 0% 2% 4% 6% 8% 10% 12% 14% 1960 1970 1980 1990 2000 Inter-census population growth Inflation GDP growth (constant prices) GDP/habitant growth (constant prices)
But the worst was still to come. Per capita GDP was at its highest in 1990, i.e. 1146 in 1964 constant prices, and began to decline from 1991. In the 1990s, economic growth was negative (-0.5%) while the population growth, though decreasing was still high (3.0% as against 3.4% in the preceding decades). Inflation3 rose in the 1990s (at its highest level since independence: 13% per annum) but this did not
match with economic growth, as is sometimes the case of blooming economies, but instead matched economic depression. Inflation did not only increase as a result of economic reasons but also political. In the 1992 elections perspective, the ruling Party printed money to finance its electoral campaign. At the turn of the century, inflation reduced to more reasonable levels (less than 10% a year, a level comparable to those of the 1970s and 1980s). However, the per capita GDP followed a definite opposite trend (-2.4%) to the population growth (+2.9%). In 2001, the per capita GDP reverted to its level of 20 years back. In short, economic decline has been constant since independence, to the extent of becoming negative in the 1990s. There was no drastic reversal of the trend but a slower and more persistent decline since independence. Political regimes did not seem to have a particular impact on this long-term trend.
3 As measured for the economy as a whole and not only in the so-called housewife’s shopping basket used to measure the household purchasing power.
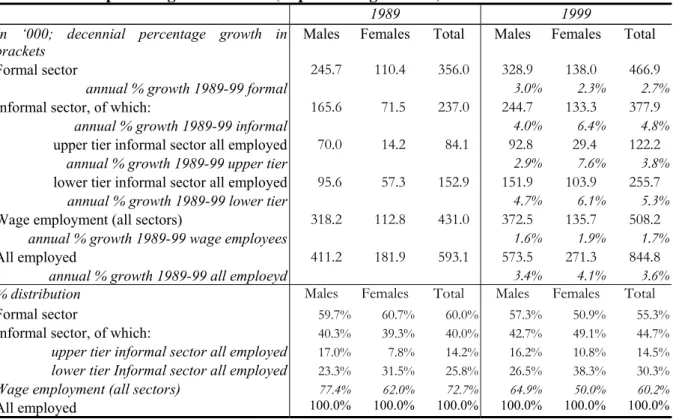
In the context of economic decline it is not surprising that the informal sector took a larger part of the labour market. The retro-projection of the NUrIP data on the 1989 and 1999 Censuses shows that the share of the informal sector (lower and upper tiers) for the population aged 15-64, increased from 40.0% in 1989 to 44.7% in 1999 (Table 2). The NUrIP estimates for the lower and upper tiers informal sector in Nairobi translate into a 4.8% annual growth in the inter-census period (1989-1999), as against 3.6% for the population employed in Nairobi, and 4.9% for the entire Nairobi population. In the meantime, formal sector share decreased from 60.0% to 55.3%, i.e. only growing at a 2.7% annual rate, 2 percentage points less than the informal sector. The upper tier informal sector grew at 3.8% a year, a little more than the entire employed population, but more for women (7.6%) than for men (2.9%). The growth of the informal sector is mainly attributed to the lower tier informal sector, which experienced a 5.3% annual growth, rising from 25.8% in 1989 to 30.3% in 1999. It is also striking that this increase is essentially due to women (6.1% as against 4.7% for men).
Table 2: Estimation of Employment in 1989 and 1999, annual percentage growth (1989-1999) and percentage distribution (Population aged 15-64)
1989 1999
In ‘000; decennial percentage growth in
brackets Males Females Total Males Females Total Formal sector 245.7 110.4 356.0 328.9 138.0 466.9
annual % growth 1989-99 formal 3.0% 2.3% 2.7% Informal sector, of which: 165.6 71.5 237.0 244.7 133.3 377.9
annual % growth 1989-99 informal 4.0% 6.4% 4.8% upper tier informal sector all employed 70.0 14.2 84.1 92.8 29.4 122.2
annual % growth 1989-99 upper tier 2.9% 7.6% 3.8% lower tier informal sector all employed 95.6 57.3 152.9 151.9 103.9 255.7
annual % growth 1989-99 lower tier 4.7% 6.1% 5.3% Wage employment (all sectors) 318.2 112.8 431.0 372.5 135.7 508.2
annual % growth 1989-99 wage employees 1.6% 1.9% 1.7% All employed 411.2 181.9 593.1 573.5 271.3 844.8
annual % growth 1989-99 all emploeyd 3.4% 4.1% 3.6% % distribution Males Females Total Males Females Total Formal sector 59.7% 60.7% 60.0% 57.3% 50.9% 55.3%
Informal sector, of which: 40.3% 39.3% 40.0% 42.7% 49.1% 44.7%
upper tier informal sector all employed 17.0% 7.8% 14.2% 16.2% 10.8% 14.5%
lower tier Informal sector all employed 23.3% 31.5% 25.8% 26.5% 38.3% 30.3%
Wage employment (all sectors) 77.4% 62.0% 72.7% 64.9% 50.0% 60.2% All employed 100.0% 100.0% 100.0% 100.0% 100.0% 100.0%
Note: This table is based on indicators computed from the biographical NUrIP data, and retro-projection on the Census data for 1989 and 1999. The formal sector includes employees with payslip and self-employed with formal accountancy. The upper tier informal sector includes employees with some kind of record but no payslip whereas the lower tier informal sector is constituted of employees with no record and self-employed with no written accountancy. The definition used in the ILS for the informal sector is closer to our definition of the lower tier informal sector.
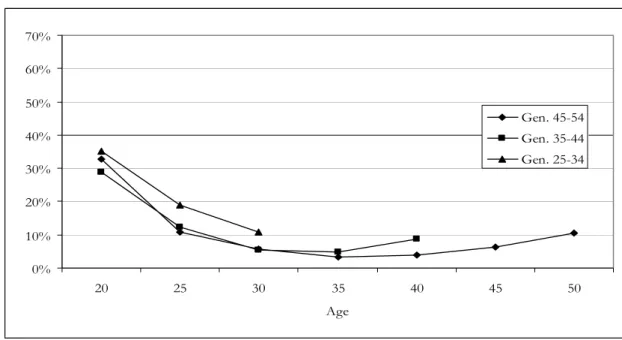
The degradation also translated into a rising proportion of unemployed and inactive. The proportion with no job among the females available on the labour market is much higher than for males (Figure 2 and 3). In the two oldest generations this proportion declines from more than 50% at 20 years old to around 25% at 30 to 35 years old. In the youngest generation, it is already exceeding 60% at 20 years old, and declines only a little less than 40% at 30 years old. Unlike males the youngest generation of females reacted to the lack of employment opportunity in the formal sector by staying inactive or unemployed. The bad economic conditions are also affecting the older generations at a later age: in the 90s, the proportion employed or inactive rises to almost 30% at 40 years old in the intermediate generation and almost to 40% at 50 years old for the older one. The economic crisis not only deterred young women from entering the job market but also forced older women to quit it. This was also observed for men but to a much lesser extent. Certainly overall unemployment is high for males (with an estimated 12.9% rate in Nairobi in 1999), but the proportion of unemployed among the younger generation of males available on the job market did not vary so much from one generation to another (between 20 and 30%).
Figure 2: Proportion Unemployed or Inactive among non-studying Males by Generation 0% 10% 20% 30% 40% 50% 60% 70% 20 25 30 35 40 45 50 Age Gen. 45-54 Gen. 35-44 Gen. 25-34
Figure 3: Proportion Unemployed or Inactive among non-studying Females by Generation
0% 10% 20% 30% 40% 50% 60% 70% 20 25 30 35 40 45 50 Age Gen. 45-54 Gen, 35-44 Gen, 25-34
The effect of the population growth on the (bad) economic situation is quite moderate. Indeed even as natural population growth rose to world record levels, the inter-census growth stayed remarkably constant up to the 1980s. Some authors argue that economic growth is sometimes favoured by active population growth when it is higher than overall population growth (Williamson, 1997)4. In Kenya, the
active population growth (computed for population aged 15-59) decreased from 3.9% in the 1960s to 3.5% in the 1980s, a level comparable to the total population growth. This convergence may have contributed to the slow-down of economic growth. The onset of the demographic transition (decrease in fertility) in the 1980s might have absorbed the effect of the economic crisis, not through a decrease in the total population growth but indirectly through an increase in the active population growth, which again rose to 3.9% at the turn of the century. The population aged 15-59 formed a little more than 47% of the population in 1979 and 1989, as against more than 52% in 2001, due to a decreasing share of the population aged 0-14 (from 48% before 1989 to less than 43% in 2001). It is certainly the
4 Williamson J. G., 1997 - “Growth, distribution and demography: some lessons from history”, NBER Working Paper Series, n° 6244, p. 52.
reason why the rise in mortality in the active population during the 1990s was not so badly reflected in the economy. Despite a high impact of HIV/AIDS on human resources management in many enterprises, the labour force reservoir has sufficient youth born at the highest level of fertility in Kenya in the 1970s and 1980s, i.e. before the demographic transition. However, serious difficulties could arise when the less numerous generations born in the 1990s enter the labour market in the years 2010 and beyond.
3. NAIROBI IN THE CONTEXT OF URBANIZATION PROCESS IN KENYA
Urbanization in Kenya has a long history in the coastal region but a short history in the interior parts of the country (Obudho, 1999; Nelson, 2000). The interior parts did not have an urban tradition in the western definition until during the colonial period. The pattern, which today exists predominantly, reflects the development of British colonisation rather than the African settlement patterns. The urban population growth has been increasing since independence. The share of the urban population increased from 7.8% in 1962 to approximately 20% in 1999. Rapid urbanization is, therefore, a post-independence phenomenon reflecting the high rates of rural to urban migration during the same period (Obudho & Muganzi, 1991). However, the proportion living in urban centres is still relatively low. Nairobi grew at 4.6% per year in the 1950s. Independence considerably raised the town’s attractiveness, which was acknowledged by a change in its boundaries, to the effect that the Nairobi population grew at 12.2% per year between 1962 and 1969. From the 1960s to date, Nairobi has been growing at a sustained and constant rate of a little less than 5% a year. This is a remarkably constant rate in Africa, where the capital cities usually grew much faster in the 1960s and in the 1970s. The population of Nairobi has always been growing at a lower pace than other urban areas, from the 1970s onward, but more than the second largest city, Mombassa, which has been growing at a 3-3.5% rate in the last half-century. The capital city inhabitants, from half of the urban population in the 1960s, represented barely more than a quarter of it in 1999. This is not likely to change much in the future. Since the 1990s, Nairobi growth and total urban growth are converging to less than 5% a year.The constant growth of Nairobi is to be attributed, even more than in other towns, to migration. This is particularly the case in the recent period of increased mortality—a consequence of AIDS—, which has been over-compensated for by migration. According to our estimates5, the crude death rate of Nairobi would have reached less than 7‰ in 2000 without the AIDS pandemic, as opposed to 13‰ with AIDS. More than 4 deaths out of 10 (i.e. at least 12,000 deaths, essentially adults, out of 30,000 a year) would be attributed to AIDS in the capital city. At the end of the 1990s, Nairobi grew by about 105,000 people a year, of which an approximated 73,000 are adults. For the active population growth to remain constant, adult migration had to compensate for the loss from AIDS, i.e. for an added 12,000 adult migrations a year. This was only possible due to high labour stocks outside the capital city. This is not to say that migration is not selective, especially regarding education. Less than 10% of the Nairobi active population (men and women) is uneducated, as against 17% for the entire Kenyan population. According to the NurIP, the education level keeps rising—60% of the male migrants who arrived in the 1970s had attained at least secondary education, as against 75% of the migrants of the 1990s. The education level is less among female migrants, but the trend is the same (from 50% to 65%).
5 Bocquier, Ph. (2003), "La mesure de la mortalité à Nairobi – Mais où les morts ont-ils disparu ? ", in Yvan Droz & Hervé Maupeu (dir.) Les figures de la mort à Nairobi - Une capitale sans cimetière, L'Harmattan, 2003.
4. INTEGRATING IN THE CITY: THE PATHS TO ADULTHOOD
The aim of the present paper is to examine the trends as well as differences in the timing of entry into adulthood. We chose to mark entry into adult life (or adulthood) by four events, i.e. first occurrence of employment, independent housing, child and union. The first section is a summary of the sequence of these four events analysed separately for males and females, migrants and non-migrants. The second section examines the interactions between these events and how each influences the other. The third and final section examines how exogenous factors influence the entry into adult life. The second and third sections are referring to tables in Annexes.
4.1.
Timing of entry in main life path events: Sequences of entryIn this section we analyse the timing of the main events that mark entry into adult life across generations and sexes. It appears that the process is different for those born or raised in Nairobi during their childhood (the so-called Nairobians) and for the migrants. Other analyses show that the flow of migrants has been constant through time, and so was the age at first migration. There has been no generational difference as regard to migration to Nairobi. This gives a different picture from what has been observed in other cities in Africa in that Nairobi is basically a migrant labour city where individuals come specifically to work and later return to their areas of origin without really taking roots in the city. We expect this pattern of migration to reflect in the difference in timing of entry into adult life between migrants and non-migrants.
Table 3: Summary of the main life course events for Nairobians
Males Females
Age group: 45-54 35-44 25-34 45-54 35-44 25-34 First Employment
First quartile 18.8 18.5 18.7 19.0 18.2 20.1 Second quartile (median) 20.1 20.7 21.4 21.0 22.2 22.8 Third quartile 20.9 23.6 24.4 24.8 27.0 32.7
Number of person-years at risk 174 323 342 400 504 629
First Independent housing
First quartile 20.0 20.3 22.3 30.0 25.0 * Second quartile (median) 21.8 25.0 25.0 37.0 * * Third quartile 26.8 40.0 * * * *
Number of person-years at risk 229 554 426 1059 1079 941
First pregnancy
First quartile 22.3 22.3 28.8 20.6 18.4 19.3 Second quartile (median) 25.8 27.8 * 23.2 21.5 25.1 Third quartile 28.0 32.9 * 27.0 26.8 *
Number of Person years at risk 359 672 644 458 499 687
First Union
First quartile 21.1 22.7 24.3 20.2 20.6 20.6 Second quartile (median) 24.8 26.2 30.3 22.1 22.2 25.9 Third quartile 27.6 32.2 * 28.5 * *
Number of Person years at risk 316 630 595 518 628 705
* Not attained.
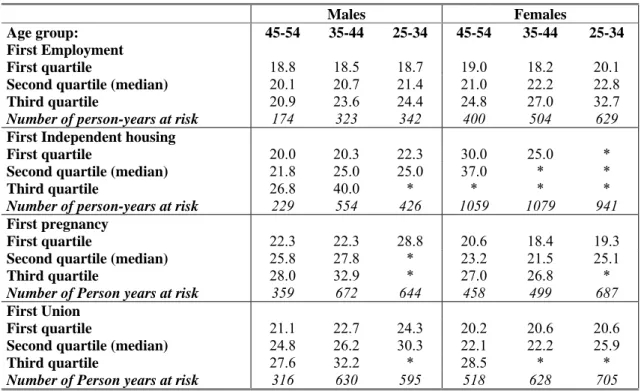
Nairobians’ experiences are used as a benchmark for comparison although the migrants dominated the sample. Tables 3 and 4 show summary statistics of the main events by sex and generation for both migrants and non–migrants derived from simple survival table analysis. For the migrants Table 4 also provides timing of first migration to Nairobi before age 30.
Before commenting further, it should be noted that there has been an increase in variability of each life course events across generations, for both migrants and non-migrants. For example, whereas the interquartile range (the difference between the age at which 25% of a generation and the age at which 75% of a generation experienced the event) for first employment for male migrants was 5.5 years for
the older generation, it was 6.5 for the younger generation. For females, it changed from 7.3 years to 10.3 years respectively. Though the interquartile range was much smaller in the older generations of Nairobians, its variability was even higher (rising from 2.1 years to 5.7 years for males, and 5.8 years to 12.6 years for females) than for the migrants. This is also observed for other events with even greater discrepancies since sometimes the third quartile (and sometime the second quartile, as in the case of Nairobian males’ fertility) is not even attained—such cases are marked by a ‘*’ in Tables 3 and 4. This increasing variability within each generation shows a greater heterogeneity of behaviour. Evolution of entry in adult life occurred not only by way of average changes (as we shall through the analysis of the median time of occurrence) but also by the heterogeneity of trajectories within the younger generations.
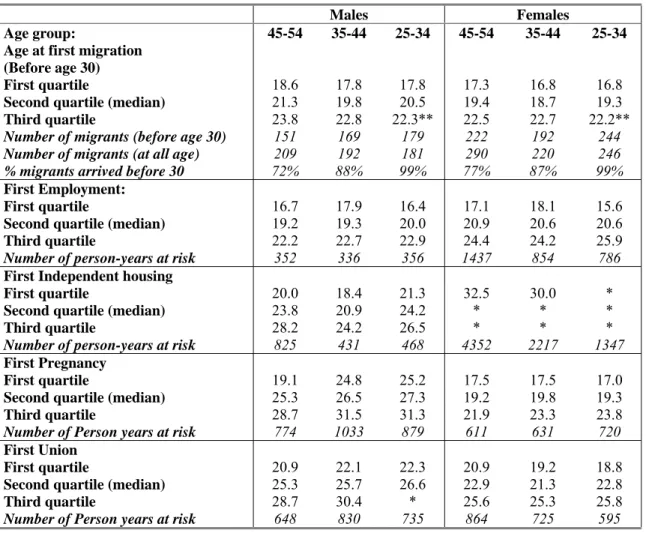
Table 4: Age at first migration before 30 years old and summary of the main life course events for the migrants who experienced these events in Nairobi
Males Females
Age group: 45-54 35-44 25-34 45-54 35-44 25-34 Age at first migration
(Before age 30)
First quartile 18.6 17.8 17.8 17.3 16.8 16.8 Second quartile (median) 21.3 19.8 20.5 19.4 18.7 19.3 Third quartile 23.8 22.8 22.3** 22.5 22.7 22.2**
Number of migrants (before age 30) 151 169 179 222 192 244 Number of migrants (at all age) 209 192 181 290 220 246 % migrants arrived before 30 72% 88% 99% 77% 87% 99%
First Employment:
First quartile 16.7 17.9 16.4 17.1 18.1 15.6 Second quartile (median) 19.2 19.3 20.0 20.9 20.6 20.6 Third quartile 22.2 22.7 22.9 24.4 24.2 25.9
Number of person-years at risk 352 336 356 1437 854 786
First Independent housing
First quartile 20.0 18.4 21.3 32.5 30.0 * Second quartile (median) 23.8 20.9 24.2 * * * Third quartile 28.2 24.2 26.5 * * *
Number of person-years at risk 825 431 468 4352 2217 1347
First Pregnancy
First quartile 19.1 24.8 25.2 17.5 17.5 17.0 Second quartile (median) 25.3 26.5 27.3 19.2 19.8 19.3 Third quartile 28.7 31.5 31.3 21.9 23.3 23.8
Number of Person years at risk 774 1033 879 611 631 720
First Union
First quartile 20.9 22.1 22.3 20.9 19.2 18.8 Second quartile (median) 25.3 25.7 26.6 22.9 21.3 22.8 Third quartile 28.7 30.4 * 25.6 25.3 25.8
Number of Person years at risk 648 830 735 864 725 595
Not attained. ** Bias downward.
4.1.1. Nairobians delayed their entry into adult life
Figures 4 to 7 show the median age at entry in the main life course events by generation and gender for Nairobians. Beginning with male Nairobians (Figure 4), a general delay is observed for the younger and intermediate generations for all the events. For the males, the sequence begins with the entry into employment followed by housing, union formation and finally parenthood for all the generations. Except for access to first employment, which timing did not change much across generation, the median age for all other events increased between the older and the intermediate generations. In the youngest generation the median age at first union increased even more while the median age at first parenthood was not attained and therefore expected to occur much later in life. However, the median age at first independent housing is the same for the intermediate and younger generations. In short, only the family formation events (union entry and first parenthood) showed dramatic and continuous change across the generations of Nairobian males.
Such changes may reflect the effect of the economic crisis in the mid 1980s and 1990s. Notwithstanding, the social change as a result of the increased emphasis on small families by government policies and the increasing education levels due to labour demands may have encouraged many in the intermediate and younger generations to pursue education for better employment prospects. However, the changes did not occur so much on employment as they did on housing and family formation. The economic crisis may have rendered more difficult for Nairobian males to leave their parents’ home and form their own independent household.
Figure 4: Median age of first main life course events of Nairobian males by generations
For females the median age at first independent housing is not attained for any generations (Figure 5). The gaps between each event are much smaller than for Nairobian males with also a different sequence patterns. The older generation had their first employment followed by union formation and lastly motherhood. Entry into employment was slightly delayed from one generation to the next, as for Nairobian males. The biggest changes occurred for other events: contrary to the older generation, pregnancy preceded by less than one year union formation among the younger generations. The youngest generation of Nairobian females also had a much more delayed entry into both fertility and union, compared to the intermediate and the oldest generation. This may imply that more women attended schools up to higher levels. Longer schooling may have delayed family formation. Increased availability of contraception in the 1990s might also explain later age at first pregnancy among the youngest cohort.
Figure 5: Median age of first main life course events of Nairobian females by generations
19 21 23 25 27 29 31
Gen. 45-54 Gen. 35-44 Gen. 25-34
Employment Union Pregnancy Housing 19 21 23 25 27 29 31
Gen. 45-54 Gen. 35-44 Gen. 25-34
Em ploym ent Pregnancy Union
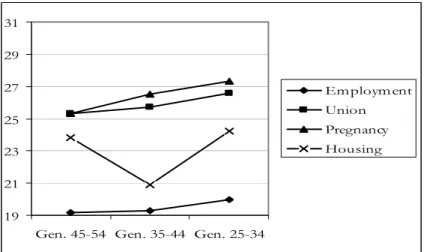
4.1.2. Migrants experienced very few changes from one generation to the next
For the male migrants (Figure 6), a delay for all events also occurred but the gap between events was much smaller although the sequence remained the same as for Nairobians. One unique difference between the male migrants and non-migrants was that the median age at first housing for the intermediate generation was 3 years less than the median for the older and youngest generations. Since the older generation got their first independent residence in the 1970s when public housing was available coupled with the fact that most employers in the private formal sector also provided the housing for their employees, access to housing may have been easier. Many of them also appeared to rent their house but not undergoing the constraints of the private market. In the 1980s, when the intermediate generation entered the housing market, private individuals and other large-scale investors provided much of the housing. This may have increased the housing market thereby providing relatively easy access although with poorer quality. Whereas Nairobians had the choice to stay longer with the families—while waiting for opportunity to get better housing—the migrants did not. During the economic crisis of the 1990s however, the private housing market was no longer sufficient to provide for housing to the majority of inhabitants, who could also afford less. This might have led to a densification in Nairobi houses.
Figure 6: Median age of first main life course events of male migrants by generations
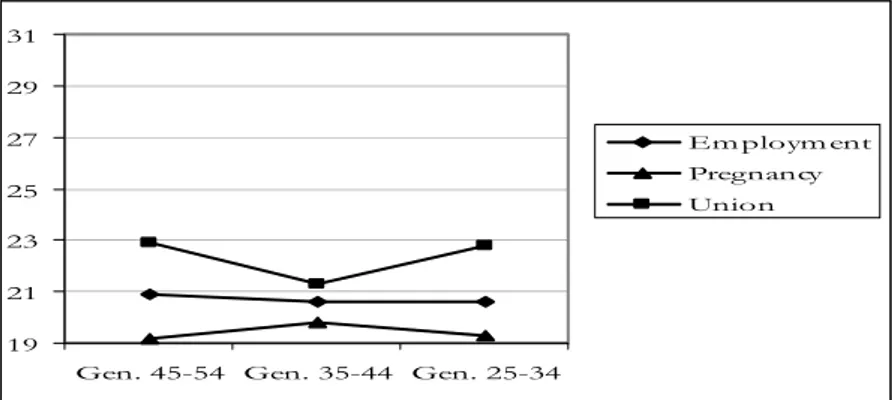
For the migrant females, there is no difference between the generations in the timing and the sequence of the events in their life paths (Figure 7). Their sequence begun by first pregnancy followed by employment and later union formation. Only median age at first union changed significantly in the intermediate generation. This might be a consequence of the younger age at first independent housing observed for male migrants: access to residence for males eases cohabitation of couples.
Also there was a disconnection of several years between first pregnancy and union formation contrary to females living in Nairobi. The high incidence of premarital pregnancy among female migrants may be due to adaptation to adult life in Nairobi devoid of cultural restraints to premarital sexual activity but not adequately compensated by appropriate contraception. It is however surprising that this phenomenon persists even with greater availability of contraception in the 90s.
19 21 23 25 27 29 31
Gen. 45-54 Gen. 35-44 Gen. 25-34
Employment Union Pregnancy Housing
Figure 7: Median age of first main life course events of female migrants by generations
4.2.
Endogenous process of entry into adulthoodIn the preceding section we analysed the timing of occurrence of each of four events, i.e. first occurrence of employment, independent housing, child and union, compared to the other. However the timing (the fact that one event precedes the other or that events are delayed or accelerated in isolation or in combination) does not necessarily reflect the influence that one event has on the other in probabilistic terms. For an event to influence another, the first event needs not only to occur before but also to accelerate or delay the occurrence of the next event. We are now trying to extract the underlying system of dependence between the four events at stake that lead men and women into adult life.
To analyse such effects, we are resorting to regression analyses. The details are not shown here for the sake of conciseness, and will be published soon in a book (Agwanda et al. 2004), but the regression results can be found in the tables annexed to the present paper. The four events at stake are considered as endogenous part of the overall process of entry into adult life. In other words, they form different steps along a continuum that leads from total dependence (in childhood, adolescence and up to early adult life) to total independence with the relevant responsibilities (adulthood). Other variables are considered in the next section to analyse the external factors (such as social and cultural affiliation, family network, human capital and historical context) influencing entry into adult life, all things being equal. These factors are considered exogenous because they are not necessary parts of the process of entry into adult life.
Table 5: Descriptive statistics for individual in the panel and not in the panel, 1997
Events
Effects Category First Employment First Independent Housing First Child* First Union
Employment None / – –
study inactive unemployed
–
inactive study inactive – – unemployed
Own formal / – + =
Own informal / = = =
Formal empl. / [Ref.] [Ref.] [Ref.]
Informal empl. / – – = –
Housing Housed [Ref.] / [Ref.] [Ref.]
Rental + / = =
Owner – / = =
Fertility 0 [Ref.] [Ref.] / [Ref.]
1 = = / + +
2+ = = / + +
Pregnancy 1 n.t. n.t. / + + +
2 n.t. n.t. / n.s.
3+ n.t. n.t. / n.s.
Union Single [Ref.] [Ref.] [Ref.] /
Formal = = + + /
Informal = + + + + /
Dissolved = t.s. = /
n.a.: not applicable; n.t.: not tested; n.s.: no significant number at risk. * Male fertility is subjected to under-reporting and bias. The results are indicated here but are commented cautiously in this paper.
19 21 23 25 27 29 31
Gen. 45-54 Gen. 35-44 Gen. 25-34
Em ploym ent Pregnancy Union
Figure 8: Interactions between main biographical events (males)
Table 6: Interactions between main biographical events (Females)
Events
Effects Category First Employment First Independent Housing First Child First Union
Employment None / – – study inactive unemployed – study – study Own formal / = = – Own informal / – family business = –
Formal empl. / [Ref.] [Ref.] [Ref.]
Informal empl. / = = –
Housing Housed [Ref.] / [Ref.] [Ref.]
Rental = / + =
Owner = / = +
Fertility 0 [Ref.] [Ref.] / [Ref.]
1 = = / =
2+ = + + / – –
Pregnancy 1 n.t. n.t. / + + +
2 n.t. n.t. / n.s.
3+ n.t. n.t. / n.s.
Union Single [Ref.] [Ref.] [Ref.] /
Formal = – + + /
Informal = – + + + /
Dissolved = + + = /
n.a.: not applicable; n.t.: not tested; n.s.: no significant number at risk.
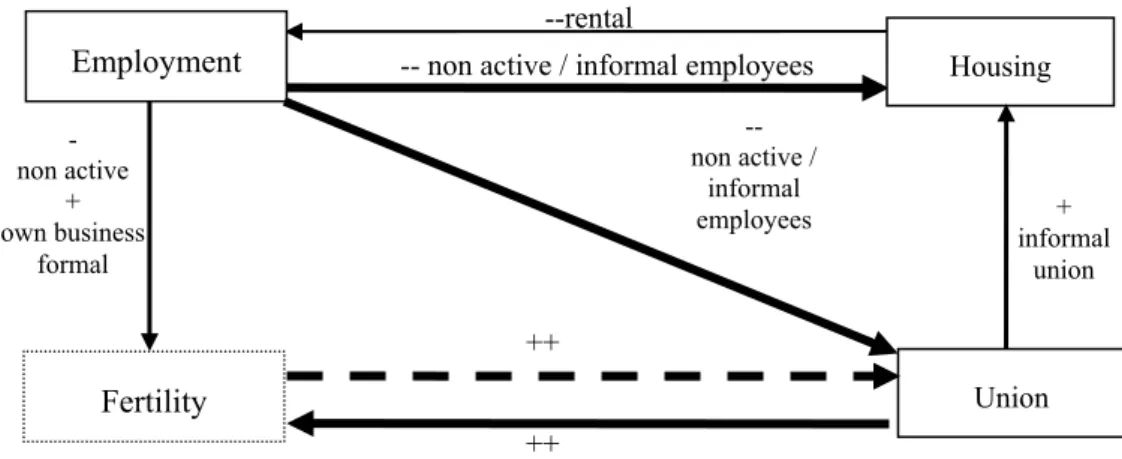
Figure 9: Interactions between main biographical events (Females)
Employment Housing
--rental
-- non active / informal employees
Fertility Union - non active + own business formal -- non active / informal employees + informal union ++ ++ Employment Housing
-- non active / own bus,
Fertility Union - study + rental - in union ++ dissolved union ++ 1st pregn. -- 2nd child + owne ++ - study / low revenue ++ 2nd
4.2.1. Employment is the main determinant of entry of men into adult life
As we have seen earlier, the analysis of male fertility is somewhat biased. Men usually declare much less children than women. Table 5 and Figure 8 should therefore be cautiously interpreted. In particular the high effect of pregnancy and children on union formation is dubious, as men tend to declare children who were born in union, whether formal or informal. The similarly high effect of union on fertility is expected for men as well as for women—union obviously increase the propensity of fertile sexual intercourses. We marked with doted lines the fertility box and the relation between fertility and union to signify that these should not be paid too much attention in term of causal relationship.
The weak but positive effect of informal union on access to the first independent residence is expected. By definition, informal union takes the form of cohabitation, which is eased by the acquisition of an independent housing, generally provided by men. In other words, independent housing is partly endogenous to the informal union formation. The weak but positive effect of rental housing on employment is also to be expected, as it reflects pressure from the entourage (who took charge of the rent) on males to gain their own revenue.
Therefore, only very few causal effects remain of some interest regarding entry of men into adulthood. It is striking that for men only employment has an effect on both housing and union formation. Employment is the main entry point in the process that leads men into adulthood, not only in the timing—employment is preceding by far all other events—but also in the accelerating effect it has on other events when the respondent is situated on the right side of the revenue scale. The same employment categories determine access to housing and union formation. Chances are considerably reduced when the respondent is inactive or employee in the informal sector, which is to say that active men in the formal sector or self-employed (in both sectors) are more likely to gain independence by way of independent housing and union than other men. In other words, integration in Nairobi is highly selective as the city gives hardly any chance to inactive men and informal employee to form their own household and hence enter adulthood as we defined it here. This again confirms the role of Nairobi as dominated by the rules of the formal sector, which is imposing itself to men as the main if not the sole gate-opener to the coveted status of the responsible and independent citizen.
4.2.2. Females did not really emancipate from their role of mother and spouse
The interactions between the four components of entry into adult life are completely different for men and women. Whereas employment appears to be the main if not the sole entry point of adult life for men, it is playing a much less important role for women (Table 6 and Figure 9). Truly wage employment and formal business are conducive to independent housing for females, but it is only one out of three determinant effects that leads to independent housing. A dissolved union (whether by separation, divorce or widowhood) or a second child are equally important factors. Independent housing is anyway rare for women, and it is therefore not very surprising that several factors (possibly in combination) are needed for access to independent housing.
The effect of the second or subsequent children is quite disproportionate. It is positive on access to independent housing at the same time as it is negative on union formation, while being in union is not conducive to independent housing. This means that when a woman did not enter a union either before having her first child, or during her first pregnancy (the only factor which highly accelerate union formation) or immediately after the birth of her first child, she will be very likely to form her independent household when getting other children. These women have clearly opted for (or have been forced into) single parenthood.
Household independence should not however be equalled to independence from the family. The fact that the second child has no effect on access to employment shows that most female still rely on other family members—parents or father-s of their children, even if they are not in union—for their subsistence and that of their children. In short, the process depicted here shows that females in Nairobi are quite dependent on other persons. Entry into adult life can certainly not be interpreted the same way for men and women. For males, employment is the key to adult life, whereas for females there is
no clear access to independence. Women’s life events are much more determined by their role as mother and spouse. Considering these results, we could even question the meaning of the concept of ‘adulthood’ for women in the Nairobi society.
4.3.
Exogenous factors that affect entry into adulthoodIn this section we look at the overall effects of external, exogenous factors on entry into adult life, for both men and women (see details of the regression results in Annexes). Our analysis is conducted from the perspective of those factors and not, as usually, from an event perspective (trying to decipher what are the main determinant of say, first employment). Practically, it means reading the Tables 7 and 8 line-wise rather than column-wise.
Table 7: Main factors influencing biographical events (males)
Factor (number of
categories) First Employment First Independent Housing First Child* First Union
Migration status (3) + Urban = = =
Ethnic origin (5) = = 1 group =
Religion (10) 2 groups = 1 group 2 groups Household status (7) 1 group + +
out nucleus = head + + Education (6) +
post sec/University – no/primary + University primary/post sec. – secondary/ – high school Age-period effect (27) (independent from generation effect) = Early independent housing gradually disappears Slight delay at all age from mid 90s
Lower fertility for generation aged around
35 in 2001
Early union disappears from 80s
Acceleration in the 80s at 20-29
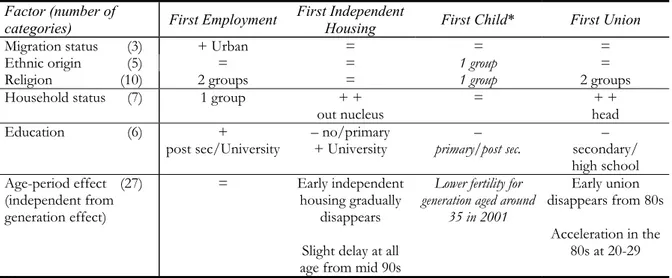
* Male fertility is subjected to under-reporting and bias. The results are indicated here but are commented cautiously in this paper. Table 8: Main factors influencing biographical events (females)
Factor (number of
categories) First Employment First Independent Housing First Child First Union Migration status (3) = = = – Nairobians
Ethnic origin (5) = = = =
Religion (10) = = 3 groups =
Household status (7) 1 group = = + out nucleus Education (6) +
post sec/University University + + no school – secondary & more + Age-period effect (27)
(independent from generation effect)
= Delay at all age
from mid 90s Higher early fertility for generation aged around 30 in 2001
Acceleration in the 70s at 20-29
4.3.1. Social and cultural factors
For both men and women, the geographical and ethnic origins have very little impact on entry into adult life. When so few categories have so little effect, and when this effect is not consistent either by sex or by event, one is tempted to regard this effect as dubious and possibly generated by small numbers. Therefore it should be concluded that origins and cultural affiliations do not determine entry into adult life in Nairobi. There are several interpretations to this fact.
First, Nairobi may have the weight and power to impose its common rules that are not applicable in other parts of the country, subjected to more traditional and localised rules as regard to employment, household and family formation. Nairobi as a social and cultural melting-pot was created with its own rules, possibly inherited from the colonial period and which did not change much over the 40 years of independence. Knowing the racial and ethnic segregation on which lay the foundation of Nairobi, this
conclusion might be somewhat surprising. However, segregation in the various forms it has been operating up to now is not necessarily contradictory with common rules regarding the main events that mark entry into adult life. For example, a firm may enrol employees preferably along some ethnic lines and still require that they be educated. Such a practice might be qualified as discriminatory, but from the point of view of the city as a whole—considered as an employment market, a housing market and a matrimonial market—it makes no difference.
Second, Nairobi might not be so different from other cities in and outside the country. Unfortunately, there is no comparable survey conducted in other Kenyan cities. But other urban integration surveys conducted elsewhere in Africa showed no evidence of differential behaviour along ethnic or religious lines, though being a migrant is generally an advantage on the labour market (Antoine et al. 2000; Antoine, Ouédraogo and Piché 1998), as in Nairobi for the urban migrants. If most African cities, including Nairobi, were not functioning along social and cultural lines, that would put seriously into question the conventional wisdom on geographical, ethnical and religious divisions generally attributed to the continent. If these divisions exist—and they certainly do in the political realm—they do not make African cities different from what is expected in any modern city in the world, because they are not operational as regard to the main events that make an African an adult integrated in an urban context, even in a city like Nairobi with a heavy burden of historical discrimination.
Third, the NUrIP survey might not have captured the most relevant criteria for social and cultural discrimination. The many categories used in the survey might not be enough to identify particular groups’ behaviour, and the sample might be too small for that purpose. This is a very common critique of quantitative surveys to which we can oppose little argument, because a larger sample is obviously the dearest wish of the quantitative researcher. However the very fact that social and cultural factors have no obvious and unique effect is contradicting the conventional wisdom on massive discrimination. The results show that if discrimination exists it is in more subtle ways that cannot be easily identified unless through qualitative, non representative analysis.
Fourth, the apparent absence of social and cultural effects could be attributed to the selection bias. Those who were discriminated against might have been simply rejected from the city. That is a more serious critique as it is true that our sample is representative of a population that has somehow succeeded in integrating the city. To assess the rejection effect, i.e. the selection bias, one would need a national sample. However the same could be said of other criteria, like sex and education, which are still operating in Nairobi despite selection. Were social and cultural effects being that strong, they would show residual effect even after selection.
Whatever the perspective, the results call for a revision of the theory on social and cultural capital and its effect on contemporary urban African societies. Origins and affiliation are much less operative than other factors. The results therefore show the direction to more effective theories.
4.3.2. Household support
The NUrIP survey is based on the collection of individual biographies. As such, very few variables can depict the entourage of the respondents at each step of his or her life. We only collected information on the position of the respondent with regard to the head of the household to which he or she belongs, for each residence. In this way we are able to determine the influence of the immediate entourage on the paths to adult life. This however does not take account of the more extended networks of family and friends, most of them being outside the household.
Using the relation to the household head, we hope to capture the degree of incentive for the respondent to enter adult life, i.e. to gain independence from his or her household of origin. The closer to the head (who is supposed to have attained already adulthood), the more solidarity the respondent might expect from the household and the less incentive for emancipation from the household. In economic words, we hypothesize that household members closer to the head share the same resources. This is typically the case of spouses, and the mutual support declines when the respondent is a child of the head (children are expected to move out of their parents’), a more distant relative (outside the family nucleus, such as a brother, a cousin, etc) or a non relative.
Whereas the relation to the household head has hardly any impact on employment, being out of the family nucleus is clearly an incentive for access to independent housing for men. As most of men are migrants, who already emancipated from their parents’ nucleus, this effect has a strong impact on Nairobi as a whole. The relation to the household head has however no impact on women. The few of them have access to independent housing do so not because of their position in the household but in specific family circumstances, as we have seen in the preceding section- when they have a second child or when their union dissolves.
Becoming the head of their own household is for men conducive to union formation. This is expected as most households in Nairobi are headed by men and that union usually implies that wives join their husband’s household. What is more interesting to note is that it is not independent housing that triggers union (the previous section showed that it has no effect for males) but the ‘promotion’ to the status of household head.
Females who do not belong to the household nucleus (i.e. who are not the daughter of the household head) have more chance to enter union. The evidence is weakly significant but it certainly shows that women living with their parents in Nairobi delay their union. This effect could account for the control of girls’ sexuality by parents, which would make it more difficult for young women to find a partner. However, it should be noted that the position in the household has no effect on fertility for females as well as for males. Therefore the evidence should be interpreted the other way round: for women, to enter union is a way for women out of the household nucleus to gain more support (i.e. to have access to more resources) and possibly to emancipate from the constraints imposed by siblings or non-relatives in their household of origin.
4.3.3. Human capital
Human capital, measured here by the level of education, should be naturally related to entry into adulthood inasmuch as it allows the individual to make his or her own decisions and take responsibilities for the less (or not yet) endowed. What is less predictable is the level at which human capital is making a difference. The results of regression analysis show that the effect of education is not continuous. For both men and women, it is only from post-secondary or university education that human capital increases the chance to get employed. Secondary educated men also increase their chances to get independent housing, which is further increased by university education, while only women with university education increases their chance to get independent housing. University education is clearly an accelerator for employment and housing, for men as well as for women, but it only concerns the happy few in Nairobi. The return of education investment at lower education level is not proportionate to the education level. In particular, there is no statistically significant difference between non-educated and primary-educated male and female respondents for both employment and housing. The difference between primary and secondary-educated is only significant for males regarding access to independent housing.
While a human capital effect is quite expected for access to employment and independent housing, its relation to family formation is less obvious. One common theory says that education should have a U-shape effect: the non-educated and the high-educated having more children and entering more easily into union than others. This theory is not supported by the data, which show a non-continuous effect of education on fertility and union formation, for both men and women. This haphazard and inconsistent effect of education may account for non-observed heterogeneity and, therefore, should not be interpreted too literally.
4.3.4. Macro and historical factors
The age-period variable is meant to capture residual historical trends that can be age-specific. It is independent from the generation-specific effects that are captured by the generation variable used for stratification. The generation is not part of the independent variables and is analysed mainly at the descriptive level.
Because the age-period variable is only specified by time, i.e. the position of the respondent in the past, it only represents a mean effect of a number of non-observed variables that qualify all the various influences that the city as a whole can have on the realisation of the event at stake. In absence of macro-economic or political factors that are not easily measured or not readily available for Nairobi only, the age-period effect is a proxy for non-observed historical heterogeneity.
If several non-observed variables have strong but contradictory effects on the event, then the age-period effect would not be significant. That would not mean that the population is not subjected to macro factors but simply that those factors are acting in opposite directions, annihilating each other. When the age-period effect is strong, it will nonetheless be impossible to attribute a specific macro factor to it. Therefore the age-period effect should be interpreted for no more to what it means—i.e. an average historical trend—and it should serve to motivate more research on the underlying historical macro-factors.
The first most important feature characterising the age-period effect in our regressions is that it is significant for access to independent housing and for family formation, but not for access to first employment. This could appear surprising as we identified in our descriptive analysis a rise of unemployment and informal contracts in the younger generation of males and females. Actually the absence of age-period effect makes this conclusion even stronger, because it is measuring historical trends independently from the generation effect (captured by stratification). In other words the bad economic conditions that Nairobi went through in the 90s essentially stroke the younger generation, aged less than 35 at the time of the survey in 2001, in its endeavour to enter the labour market. The other generation did not suffer so much from the economic crisis, also because being older they had already entered the labour market.
Historical trends had a stronger effect on events other than employment, especially for males. From that point of view, early entry into adulthood is more difficult as fewer men under 20 years old have now access to independent housing or enter union. This is not the case for females for whom there is no age-specific historical variation. However for males and even more for females, the chances to get independent housing decreased from the mid 90s at all ages. There would need more investigation to know if this due to decreasing household revenues, to the saturation of the housing market, or to a combination of the two effects.
This period effect on housing comes at a time when early fertility is on the rise for the younger generation of females6. We had said previously that early pregnancy among female migrants was a reason of concern. It is highly probable that these pregnancies are unwanted and that, as a consequence, the children born are probably sent in the migrant’s region of origin. The difficulty to find independent housing in Nairobi must have encouraged even more mothers to separate from their first child.
To summarise the generation and age-period effects, entry into adulthood was mainly affected by a generation factor (delayed entry into the labour market for both males and females), by age-specific factors (delay in household formation for males; acceleration of early pregnancy for females) and by a period-specific factor (reduced chances of access to housing for both males and females in the mid-90s).
CONCLUSION: the formal labour market decline explains most of the precariousness of youth and women in Nairobi
Both the descriptive analysis and the regression analysis converge to draw a picture of surprising stability of the process of entry into adult life in Nairobi. Certainly the younger generations experienced delay in this process, especially the Nairobians, but that did not put the basic principles of entry into adult life into question. The timing of events remains the same and most of the delay experienced by the younger generation can be attributed to the economic crisis of the 90s.
The difference in behaviour of the Nairobians can be mainly attributed to the family context, which gives them more support in an otherwise constrained urban context. An increasing uncertainty in the labour market and increasing number of temporary contracts are seen as major causes of delay in young persons ‘leaving home’. Another response in the labour market situations is the increase in the educational participation in order to enhance career opportunities. Parents in Nairobi judge longer education for their children to be important in view of the difficult employment opportunities. Increasing duration of education has in turn repercussions on demographic and household behaviour by delaying union for both men and women. While cultural values may push young adults to leave home (in the sense that parents do not expect the new couple to stay in the same dwelling unit) the economic trends depress the process. Men in Nairobi are expected to be the main breadwinner in the family. Difficulties in making a timely and successful transition to a stable work career affect their family formation. A low and unstable income makes it extremely difficult to establish independent household. This not only affects union formation but also creates uncertainties about his future capabilities to raise children. In addition, the high interest rates, excessive housing cost may have inhibited access to independent housing. Those living with their parents in Nairobi preferred to stay with them rather than opt for poorer housing in the informal sector.
However, the majority of Nairobi citizens are actually migrants who do not benefit from the presence in town of their immediate family. For them, the process of entry into adult life did not change much. They did not have much choice or, rather, the choice was done before the migration, at the time of the decision to come in Nairobi. Therefore it appears that migrants moved earlier to their own independent housing irrespective of their quality and cost.
Gender differences are more striking than differences by generation or by migration status. The persistence of somewhat traditional roles for women is surprising in a city like Nairobi, which appears by other standards as rather modern and occidentalised. We would expect better integration of women in the labour market, and hence similar or convergent paths to adult life. Instead, gender is still strongly operating in Nairobi. Men are still expected to act as the breadwinners in the family irrespective of the earning potential of women.
The city of Nairobi is first and foremost the main formal labour market in Kenya. This characteristic— that traces back into colonial time—, by giving the formal sector employees and entrepreneurs the priority, vastly influences the model of circular migration between the hinterland and the city and other aspects of integration of citizens (household and family formation). It also imposes specific roles to men and women in the city. Whereas employment is clearly the key to entry into adult life, it plays a marginal role for women. That might explain why the Nairobi labour market reacted to the economic crisis of the 90s by rejecting females. It could be argued that females could have retracted by their own will from the labour market but it is difficult to understand why women earning their own revenues would relinquish independence by abandoning their economic activity for the sake of preserving male employment. Discrimination against women on the Nairobi labour market should therefore be seriously considered as an explanation for their declining labour participation. We could also hypothesise that female access to the labour market was temporary and favoured by a shortage of labour in the 70s and 80s. Women would have served as a reserve labour force that was no longer needed during the crisis in the 90s.