ISSN 1566-6379 116 ©ACPIL Reference this paper: Audrezet A and Parguel B “Designing Measurement Tools to Improve Response Fluency and
Certainty: The Case of Online Customer Satisfaction Evaluation
Alice Audrezet
1and Béatrice Parguel
2 1Institut Supérieur de Gestion, Paris, France 2Paris-Dauphine University, Francealice.audrezet@isg.fr
beatrice.parguel@dauphine.fr
Abstract: Online shopping development went hand in hand with online self-administered customer satisfaction evaluation
requirement. However, the specific context of online rating, without any face-to-face clarification, raises the question of accuracy and appropriateness of the chosen tool for respondents. To address this issue, this research proposes the new concept of “response fluency” to qualify the ease with which a question is processed. Applied to the Evaluative Space Grid, a new grid that has been proposed in psychology to measure overall evaluation, this research shows how response fluency mediates the influence of measurement tool design on response certainty. More specifically, it tests the effects of two alternative tool design formats (i.e., a reduction of the grid’s response cell number and the display of labels to the response cells) in terms of response fluency and certainty. Using a between-subjects experiment, we show that the display of labels in the cells actually increases response fluency and, in turn, response certainty. By contrast, reducing the response cell number does not produce any effect. We contend that well-designed measurement tools can make the process of responding more fluent and increase respondents’ subjective confidence in their capability of conveying their true evaluations. In the end, this work advocates for new research to design measurement tools likely to engage respondents when answering surveys and prevent dropout rates, which is especially challenging within self-administered electronic settings.
Keywords: attitude certainty, processing fluency, web evaluation, online data collection, tool design, instrument
1. Introduction
Assessing overall customer satisfaction has always been a central issue in market research because it predicts other key marketing variables, such as profit and loyalty (Haumann et al., 2014, Homburg, Allmann and Klarmann, 2014). However, customer satisfaction has gained in relevance in recent years, due to the diffusion of Internet technology, which has provided both online and bricks-and-mortar companies with a quick, immediate, asynchronous, and inexpensive way to collect user-generated customer evaluations (Leimeister, Österle and Alter, 2014, Liu et al., 2014, Neirotti, Raguseo and Paolucci, 2016). As such, an increasing number of companies have adopted overall customer satisfaction as a barometer of business performance, which makes the accuracy of its measure of utmost importance.
In this perspective, working on a practically relevant, easy to use evaluation tool is of utmost importance (Hung and McQueen, 2004, Lech, 2007). To address this critical challenge, we examine how the tools measuring overall customer satisfaction on the Internet can be redesigned to collect more relevant information in general and more certain responses in particular. In a survey context, research has shown that response certainty, or “the degree of certainty or confidence a respondent has in his or her judgments about the attitude object” (Antil, 1983, p. 409), is associated with greater attitude–behaviour correspondence (e.g., Bizer et al., 2006, Törmälä and Petty, 2004) and more attitudinal persistence (e.g., Bassili, 1996). As such, market research managers make better predictions (Regier et al., 2014) and more relevant decisions when they collect certain rather than uncertain responses. However, to do so, they must exclude customers who provide uncertain responses from their survey samples, which results in an increase in survey costs. In the end, it is therefore crucial for market research managers to select the tools that naturally favour response certainty. In the present paper, we propose the new concept of “response fluency” to qualify the ease with which a question is processed and to explain how measurement tool design can improve customers’ response certainty. To test this prediction, the Evaluative Space Grid (ESG), a tool that Larsen, et al. (2009) developed in psychology to collect overall evaluations, appears to be the perfect candidate. Though drawing researchers’ attention for its theoretical and psychometrical qualities (e.g., Audrezet, Olsen and Tudoran, 2016, Cacioppo et
al., 2011, Cacioppo et al., 2009, Hibbing, Smith and Alford, 2014), some scholars consider the ESG too “cognitively demanding” (Andrade and Cohen, 2007) to be used on a wide scale in market research.
Using a between-subjects experiment on a sample of 97 undergraduate students, we manipulated the ESG response cell number through the grid’s dimension (i.e., the 5×5 original grid vs. a new 3×3 grid) and the display of verbal labels in the grid’s cells. The results show that the ESG design can actually improve response certainty, through the mediation effect of response fluency. The next sections present the ESG in more detail, the conceptual framework, the experimental methodology, and the results. Finally, we discuss contributions for academics and practitioners conducting market research.
2. Overall customer satisfaction measurement tools
2.1 Bipolar customer satisfaction measurement
To assess overall customer satisfaction online, companies usually use five-point rating scales. For example, Amazon.com, one of the most visited commercial websites worldwide, and TripAdvisor, one of the largest travel sites in the world, both ask their customers to rate their satisfaction on such a scale format. As bipolar scales, these scales clearly discriminate between polarized evaluations (i.e., either strongly positive or negative evaluations). Still, their mid-point can aggregate uncertain responses (i.e. “I don’t know” answer) with ambivalent responses (i.e. a mix of moderate to high positive and negative evaluations) or indifferent responses (i.e. lowly positivity and negativity evaluations) (Kaplan, 1972, Thompson, Zanna and Griffin, 1995). This is unfortunate because these different responses reflect different attitudes, drive distinct behavioural responses (Thornton, 2011, Yoo, 2010), and could lead market research managers to make inappropriate decisions.
2.2 The Evaluative Space Grid
The ESG could help solve this methodological issue. It takes the form of a 5×5 grid that evaluates both the degree of positivity and the degree of negativity of a stimulus within a bi-dimensional matrix (seeFigure 1). The first dimension of the matrix measures the respondent’s degree of negativity (from “not at all negative” to “extremely negative”); the second dimension of the matrix measures the respondent’s degree of negativity (from “not at all positive” to “extremely positive”). Considering these two dimensions, respondents are invited to select which of the 25 cells best describes his or her evaluation.
Figure 1: Evaluative Space Grid (from Larsen et al., 2009)
Larsen et al. (2009) validated that mean positive and negative ratings obtained with the ESG correlate almost perfectly with those obtained with unipolar measurements of positivity and negativity. Going further, Audrezet, Olsen and Tudoran (2016) have recently underscored its psychometrical performance (i.e., discriminant, convergent, nomological, and predictive validity and reliability) in a service marketing context to measure overall customer satisfaction online. Although the ESG has drawn the attention of researchers in both psychology (e.g., Cacioppo et al., 2011, Cacioppo et al., 2009, Hibbing, Smith and Alford, 2014) and consumer
research (Andrade and Cohen, 2007, Audrezet, Olsen and Tudoran, 2016), it has not yet been widely employed by practitioners in market research.
In order to understand the reason why they prefer other tools, we interviewed five market research professionals from specialized companies (i.e., GfK, TNS Sofrès, TripAdvisor, Millward Brown, and Vinivi). They noted potential difficulties in clearly recognizing its potential to capture more insightful evaluations. More precisely, they speculated that the grid’s unfamiliarity could disturb respondents, who may consider puzzling (1) to assess on a grid variables they usually assess on a continuum, (2) to make sense of specific cells (e.g., cells located on the dissatisfaction dimension), and (3) to face a 25-possibility response set instead of a 5- or 7-possibility response set.
Anticipating these problems, Larsen et al. (2009) formulated practical instructions, including a two-minute generic explanation and the company of an experimenter to present the grid and clarify the task before inviting respondents to answer using paper-and-pencil or computerized versions of the ESG. Still, Larsen et al. (2009) did not consider whether filling the grid could be an easy task in a self-administered context, such as electronic surveys, which represent a critical challenge for at least two reasons. First, electronic surveys have recently become the most common mode of administration for the assessment of customer satisfaction (ESOMAR, 2015). Second, as the Internet suppresses the ability to employ oral speech, it often results in a decrease in communication fluency and an increase in communication ambiguity and perceived cognitive effort (Kock, 2009, Kock and DeLuca, 2007). These observations clearly call for further research to try to make the ESG more effective in a self-administered electronic context. To answer this call, in the next section we draw on the methodological literature to build an appropriate conceptual framework.
3. Conceptual framework
Processing fluency refers to “the subjective experience of ease or difficulty with which [individuals] are able to process information” (Oppenheimer, 2008, p. 237). Some researchers have focused on “perceptual fluency,” or the ease of processing stimuli (Whittlesea, 1993, Winkielman et al., 2003), while others have focused on “conceptual fluency,” or the ease of performing mental operations (Tulving and Schacter, 1990). Without addressing the source of such ease in completing a cognitive task, research has shown that processing fluency affects a wide array of judgments and behaviours. For example, something that is fluent tends to be perceived as truer, more likable, and more familiar (Schwarz, in press), and thus may influence brand preference (Labroo and Lee, 2006, Lee and Labroo, 2004), product choice (Novemsky et al., 2007), and even behaviours of eating (Capaldi, 1996) or recycling (White, MacDonnell and Dahl, 2011).
While processing fluency has already been considered in prior research conducted in psychology and marketing, methodological research has largely ignored its potential effects. Yet processing fluency can be associated with virtually any form of cognitive activity, such as the completion of a survey. From this perspective, we extend previous research on processing fluency by defining response fluency as the ease with which a question is processed. Going further, we hypothesize that measurement tool design can influence response fluency by improving the respondent’s ability to use the measurement tool.
Regarding the ESG design, the market research professionals we interviewed suggested two potential improvements that could help the grid’s spontaneous understanding: (1) a reduction of the ESG response cell number through a reduction of the grid’s dimension from a 5×5 to a 3×3 dimension and (2) the display of verbal labels in the ESG cells to clarify each response alternative. Although these suggestions appear promising, they have not been empirically tested. Our conceptual framework, which is based on prior methodological research conducted on verbal labels effect and the optimal number of response alternatives, thus explores their relevance.
3.1 Reducing the number of ESG response alternatives
Regarding the debate on the optimal number of response alternatives, Lehmann and Hulbert (1972) suggest that respondents may randomly answer when few response alternatives are available. On the other side, having a limited ability to detect small stimuli variations (Pollack, 1952), most respondents may find difficult to make sense of too many alternatives (Green and Rao, 1970, Hulbert, 1975) thus resulting in random answer. Considering these two rationales, a curvilinear relationship might exist between the number of alternatives and measurement reliability. However, when comparing tools displaying from 2 to 11 alternatives, Alwin and
Krosnick (1991) observe only a monotonic relationship. Alwin (1997) and Peterson (1997) confirm that measurement reliability improves in a linear way as the number of response alternatives increases up to 11. Though lacking empirical evidence regarding individuals’ ability to discriminate between more than 11 response alternatives, the ESG and its 25 response alternatives update the curvilinear hypothesis postulated by Alwin and Krosnick (1991). According to their reasoning, a 3×3 ESG (i.e., 9 alternative response cells) could be easier to process than a 5×5 ESG (i.e., 25 alternative response cells). This expectation is also in line with previous findings showing that questions with a larger number of answer categories impose greater burden on respondents, leading to an increase in response time (Yan and Tourangeau, 2008) and, therefore, a decrease in response fluency.
In addition, individuals are used to answering questionnaires in their daily lives and seem more familiar with measurement tool formats displaying limited response alternatives. Peterson (1997, p. 11) notes that in paper-and-pencil face-to-face satisfaction surveys, “the most frequently used rating scale contains seven categories." Respondents are therefore assumed to be more familiar with reduced tools such as a 3×3 ESG than with expanded tools such as a 5×5 ESG. Then, research indirectly suggests that what is familiar facilitates processing fluency (Schwarz, in press). More precisely, research has shown that repetition, recency, and duration of exposure to a stimulus, all of which make it more familiar, induce processing fluency (Alter and Oppenheimer, 2008, Oppenheimer, 2008). As such, because respondents should perceive the 3×3 ESG as more familiar than the 5×5 ESG, their response fluency should also be higher when answering a question using a 3×3 ESG. Thus, we formulate the following hypothesis:
H1a: The 3×3 ESG will result in higher response fluency than the 5×5 ESG.
However, as Cox III (1980, p. 420) argues, “even a few response alternatives may be too many for the respondent if comprehensible instructions and labelling of response alternatives are not included”, which invites to explore further the potential benefits of using verbal labels to clarify the meanings of the ESG alternatives.
3.2 Displaying verbal labels in the ESG cells
Adding verbal labels to clarify the meaning attributed to the alternative response cells could also improve the fluency of the ESG. In fact, verbal labels are likely to reduce the perceived ambiguity between alternatives, to increase measurement reliability (Alwin and Krosnick, 1991) and scales’ ease of use. More precisely, Garland (1990) shows that labelling measurement tools makes them easier to understand and complete because they reassure respondents about the alternatives’ exact meaning. As such, respondents usually prefer labeled measurement tools that reduce their cognitive effort and, therefore, increase response fluency.
Using this rationale, an unlabeled ESG may appear challenging to process for respondents who need to infer the meaning of the alternative responses by combining the information from the two dimensions of the grid. On the contrary, adding verbal labels to the ESG cells allows direct interpretation of each response alternative and implies less effort to fill the online survey, which should, in turn, enhance response fluency. We therefore formulate the following hypothesis:
H1b: A labeled ESG will result in higher response fluency than an unlabeled ESG. 3.3 Mediating role of response fluency
Alter and Oppenheimer (2008) show that processing fluency can influence the level of abstractness with which people construe information, with more fluent processing leading to a more concrete way of representing information. Following the same reasoning, response fluency could be associated with a more concrete way of representing the object under evaluation in respondents’ minds. In the end, because respondents should be more confident in what their response should be when evaluating concrete objects than abstract ones (Franks and Bransford, 1974), we contend that response fluency should increase response certainty (Petrocelli and Whitmire, 2017).
As another rationale, Song and Schwarz (2008) demonstrate that an individual’s difficulty in reading behavioural instructions results in barriers to executing the proposed behaviour. In the same vein, White, MacDonnell and Dahl (2011) suggest that the perceived ease of processing information enhances perceptions of the ease of engaging in the advocated behaviour. In other words, when an information is perceive as easy to
process (i.e., it seems fluent) it is more likely to engage in a behavior. This highlights the mediating role of individuals’ self-efficacy (i.e., “beliefs about their capabilities to produce effects”; Bandura, 1994) in the explanation of the impacts of processing fluency.
Extending this rationale to the domain of response behaviours, we suggest that people sometimes have difficulty in accessing the reasons why they hold a given attitude (Wilson et al., 1989), suggesting that they often lack ready-made answers when asked to report their attitudes (Hastie and Park, 1986). In this situation, response fluency should increase their beliefs about their capability of accessing their true attitudes, their engagement in the act of finding a consistent answer, and, therefore, their response certainty. Conversely, when individuals experience response disfluency, they will feel less capable of accessing their true attitudes, leading to random response behaviour and response error, which can result in response uncertainty (Regier et al., 2014).
In line with these developments, we hypothesize that the ESG format should affect response fluency, thus influencing respondents’ beliefs in their capacity to access their attitudes, and response certainty. We postulate:
H2: Response fluency mediates the influence of the ESG format on response certainty.
4. Research design
To test our conceptual model, we conducted a between-subjects online experiment manipulating three stimuli: the classic 5×5 unlabeled ESG (Larsen et al., 2009), which we use as a control manipulation, a 3×3 unlabeled ESG, and a 3×3 labeled ESG (see Figure 2).
97 undergraduate students of a major Parisian university (mean age = 21 years, 50% women) were randomly assigned to one of the three experimental conditions. Their last visit to their doctor was considered as the pretext to measure their satisfaction, and so doing, test the influence of the ESG formats on response fluency and certainty.
We chose the context of a physician evaluation because increasingly more Internet platforms, such as Yelp and Healthgrades, allow patients to rate their physicians and review other physicians’ ratings in light of increasing demands for high-quality care and transparency, combined with a rise in health-care costs for families. A growing number of hospitals also publish physicians’ ratings, both good and bad, on their websites (Jha, 2015). We propose that the ESG could be relevant in this evaluation context because patients’ satisfaction surveys typically focus on measuring physicians’ performance at the overall level. Furthermore, the ESG was initially intended to measure ambivalent evaluations, which could be adequate to account for the multi-dimensional nature of the physician evaluation, which integrates various attributes such as “the time spent with the patient,” “the thoroughness of advice,” and “the quality of waiting room” (Mittal and Baldasare, 1996). Of note, the main purpose of focusing on the last visit to the doctor was to help respondents form a clear picture or memory to serve as the basis for completion of the survey. This ensures that respondents are consistent in reflecting their perceived experience and avoids biases in the data collection process (Wu, 2013).
While the use of undergraduate students in studies is often questionable, students offer two benefits for the current research. First, in addition to their greater accessibility for research, they are actual consumers of physician services but usually do not have a long-time relationship with a specific practitioner, as they are likely to move for the purpose of their studies. Second, as a homogeneous sample, students allow researchers to control for variables such as individual PC skills and general health needs, which can influence data collection (Udo, Bagchi and Kirs, 2010). This sample is therefore suitable from both an external and internal perspective.
From a practical standpoint, respondents first participated in a training session to become more familiar with the ESG. Concretely, they were randomly assigned to one of the three ESGs under review (i.e., the classic 5×5 unlabeled ESG, a 3×3 unlabeled ESG, and a 3×3 labeled ESG) and invited to participate in three different training evaluation tasks, all using the same ESG format. They then needed to evaluate how well they understood how to use the grid on a single item. Respondents then assessed their overall satisfaction with their doctor using the ESG to which they had been randomly assigned during the training session. Finally, they rated response fluency and certainty. Response fluency was measured using six items inspired by Lee and Aaker (2004) (i.e., “Using this grid to evaluate my last consultation was: simple / clear / obvious / ambiguous [reversed item] / natural / complicated [reversed item]”) and response time to fill the ESG. Previous research has often used reaction time as a proxy for processing fluency (e.g., Schooler and Hertwig, 2005, Tourangeau and Ellsworth, 1979). Four items from Petrocelli, Tormala, and Rucker were borrowed (2007) to measure response certainty: “I am certain that the attitude I expressed toward my last consultation really reflects my true thoughts and feelings,” “My true attitude toward my last consultation is very clear in my mind,” “I am certain that I know my true attitude on my last consultation,” and “I am certain that the attitude I just expressed toward my last consultation is really the attitude I have.” We also recorded respondents’ frequency of visits to their doctor to control for their intrinsic involvement, which could affect their overall satisfaction (Cho et al., 2004).
We checked the normality, unidimensionality, and reliability of response fluency (m = 4.69, σ = 1.28, β1 = .42,
β2 = .39, α = .87) and certainty (m = 5.10, σ = 1.52, β1 = .68, β2 = .03, α = .93). Analysis reveals no significant
differences across the three experimental groups in terms of the respondents’ frequency of visits to their doctor (F(2, 94) = .51, p > .10) or on how well they understood how to use the grid (F(2, 94) = .27, p > .10; m = 6.57,
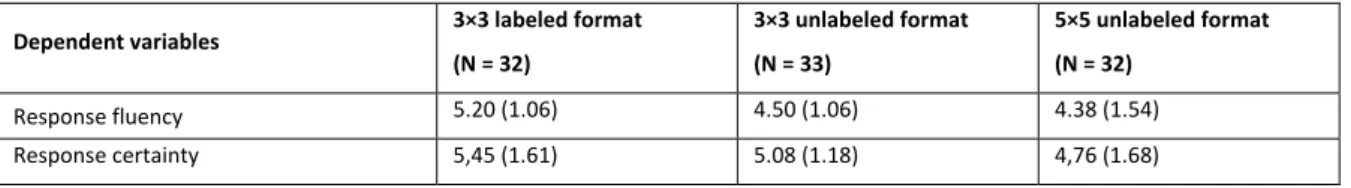
σ =.93). Table 1 provides descriptive statistics for the three experimental groups.
Table 1: Descriptive statistics (m, σ)
Dependent variables 3×3 labeled format (N = 32) 3×3 unlabeled format (N = 33) 5×5 unlabeled format (N = 32) Response fluency 5.20 (1.06) 4.50 (1.06) 4.38 (1.54) Response certainty 5,45 (1.61) 5.08 (1.18) 4,76 (1.68)
5. Data analysis and results
The first analyses pertain to the relative effects of the different ESG formats tested on response fluency. Analyses of variance, which controlled for respondents’ frequency of visits to their doctors as a covariate, show that the ESG format influences response fluency (F(2, 94) = 3.91, p < .05). Regarding the comparison of the
5×5 and 3×3 formats, post hoc tests reveal no significant influence on response fluency (M5×5 = 4.38, M3×3 =
4.50; F(1, 62) = .10, n.s.). H1a is not corroborated. Going further, they show significant differences depending on
the presence of labels. Precisely, the response task appeared more fluent in the case of the 3×3 labeled format than in the cases of the 3×3 unlabeled format (M3×3labeled = 5.20, M3×3 = 4.50; F(1, 62) = 6.61, p < .05) and the 5×5
unlabeled format (M3×3labeled = 5.20, M5×5 = 4.38; F(1, 61) = 6.34, p < .05), which corroborates H1b.
Regarding the response time to provide the visit evaluation, we removed 14 respondents who took less than nine seconds to answer. Analyses of variance confirm our first results. For the comparison of the 5×5 and 3×3 formats, post hoc tests reveal no significant influence on response time (M5×5 = 18.25, M3×3 = 17.13; F(1, 52) =
.29, n.s.). Again, H1a is not corroborated. However, they again show significant differences depending on the
presence of labels. Precisely, response time appeared shorter in the case of the 3×3 labeled format than in the cases of the 3×3 unlabeled format (M3×3labeled = 15.08, M3×3 = 17.13; F(1, 54) = 2.28, p < .10) and the 5×5
unlabeled format (M3×3labeled = 15.08, M5×5 = 18.25; F(1, 51) = 2.00, p < .10). Although these results are only
marginally significant, they are in line with H1b.
** p < .05; * p < .10.
Figure 3: Univariate analysis results
Though not an objective of any hypothesis, we note that the experimental stimuli only marginally influence response certainty (F(2 ,94) = 1.73, p < .10), such that responses are marginally more certain in the case of the
3×3 labeled format than in the case of the 5×5 unlabeled format (M3×3labeled = 5.45, M5×5 = 4.76; F(1, 61) = 2.27, p
< .10). To be noted, respondents’ frequency of visits to their doctors did not show any influence on response fluency nor on response certainty (all Fs > .40). Figure 3 displays the pattern of our results.
Turning to the test of the mediating role of response fluency to explain the impact of the ESG format on response certainty, we used a bootstrapping procedure with 5,000 samples to counteract the assumption of normality of the sampling distribution of the indirect effect (ab) as required by the Sobel test (Hayes, 2009). The 3×3 labeled condition was coded “1”, such that a positive effect of the independent variable on the mediator in the indirect path indicates the effect of the 3×3 labeled format. As in previous analyses, mediation analyses controlled for respondents’ frequency of visits to their doctor.
First, when compared with the 5×5 unlabeled format, the 3×3 labeled format exerts a positive indirect effect (ab = .19) on response certainty through response fluency (confidence interval of [.0327; .4474]). More precisely, when compared with the 5×5 unlabeled format, the 3×3 labeled format increases response fluency (a = .42), which in turn increases response certainty (b = .45). Second, when compared with the 3×3 unlabeled format, the 3×3 labeled format exerts a positive indirect effect (ab = .23) on response certainty through response fluency (confidence interval of [.0239; .6028]). More precisely, when compared with the 3×3 unlabeled format, the 3×3 labeled format increases response fluency (a = .69), which in turn increases response certainty (b = .33). Together, these results emphasize the role of response fluency as a mediator of the effect of the ESG format on response certainty, thus corroborating H2 (see Table 2).
Table 2: Mediation results
5×5 Unlabeled Format Compared with 3×3 Labeled Format
Direct Model Coefficient T
ESG format → Response fluency .42 2.52***
Response fluency → Response certainty .45 3.01***
ESG format → Response certainty .16 .75
Indirect Model
Coefficient of mediation .19
Confidence interval [.0327; .4474]
3×3 Unlabeled Format Compared with 3×3 Labeled Format
Direct Model Coefficient T
ESG format → Response fluency .69 2.57***
Response fluency → Response certainty .33 2.00**
ESG format → Response certainty .18 .49
Indirect Model
Coefficient of mediation .23
Confidence interval [.0239; .6028]
*** p < .01; ** p < .05; * p < .10.
6. Discussion
In this research, we ran a between-subjects experiment to assess the impact of measurement tool design on response fluency and certainty in online customer surveys. The experiment showed that the display of verbal labels in the ESG cells positively influences response fluency, which in turn mediates the relationship between the grid’s format and response certainty. No such effects appeared when reducing the grid’s response cell number by decreasing the ESG dimensions. Of note, response times confirmed these findings. The display of verbal labels in the ESG cells had a positive effect on response time, though this influence was only marginally significant. The fact that fully labeled rating scales might result in increased time to read the options (Yan and Tourangeau, 2008) could explain this somewhat disappointing result. Also confirming the absence of results with the measure of response fluency, the 3×3 ESG did not take less time to fill out than the 5×5 ESG. These findings bear several theoretical contributions.
First, this research contributes to the methodological literature by extending the concept of processing fluency, initially developed in psychology, to the methodological field. Currently limited to the examination of traditional marketing stimuli (e.g., Reber and Schwarz, 1999, White, MacDonnell and Dahl, 2011), this concept gives birth to a new construct—namely, response fluency, which we define as the ease with which a question is processed. This new concept seems promising when developing new measurement tools, and therefore we invite scholars to consider it more systematically in future academic methodological research. As such, the concept of response fluency also deserves the development of a more robust measure beyond the ad hoc items we used herein. Going further, showing that response fluency mediates the impact of measurement tool design on response certainty, we also provide an explanation of the cognitive process at stake when considering improving measurement tools. Furthermore, we suggest that perceived self-efficacy is at play behind this cognitive process, in that response fluency makes respondents believe in their capability of giving their true evaluation. Still, we could not test this in the current research, and we encourage researchers to conduct new experiments to understand the mechanisms at stake in the influence of measurement tool design. Regarding self-efficacy, further research could also test new survey designs likely to engage respondents’ in the response task and prevent survey dropout rates, through the indirect suggestion that it is easy to achieve.
Second, regarding the literature on customer satisfaction measurement, we extended Larsen et al.’s (2009) work by showing that the ESG could be easily used in a self-administered online context, without any face-to-face clarification of the grid and the response task. Furthermore, we extended Audrezet, Larsen and Tudoran’s (2016) work by suggesting potential simplifications of the ESG to facilitate respondents’ appropriation and
improve response certainty. Finally, considering a health setting, we also applied the ESG in a context that research has not considered previously and suggest that the ESG could be used effectively in a wide variety of domains. As such, our study answers the call to invest efforts to improve measurement of satisfaction and quality, especially on the Internet (Stamenkov and Dika, 2016, Udo, Bagchi and Kirs, 2010). From a more specific perspective, the current research tests different formats that could be easier to process in an online self-administered setting. In line with the literature, which provides no definitive answer about the optimal number of response alternatives in rating scales, we do not find any impact of the reduction of the grid’s dimension from 25 to 9 alternative response cells on response fluency and certainty. The grid’s unexpected square design may have counterbalanced this potential gain, thus suggesting that respondents did not address the grid considering its two axes modalities very cautiously, but rather viewed it as a continuous integrated bi-dimensional space, which appears quite relevant to form an overall evaluation. Furthermore, in support of the methodological literature on the benefits of verbal labels (Alwin and Krosnick, 1991, Garland, 1990), the display of verbal labels in the ESG cells seems to clarify the meaning of the different response alternatives, therefore enhancing response fluency, and in turn response certainty.
Finally, although this research produced relevant theoretical contributions, several limitations may be inherent in it. First, we ran this study on a sample of undergraduate students, though research has shown that education level affects response behaviours (Alwin and Krosnick, 1991). We acknowledge that more educated respondents would likely experience less difficulty when filling out questionnaires. However, if so, they should be less biased by the design of measurement tools than less educated respondents. We also argue that if more educated respondents actually perceive differences in response fluency between different measurement tools, these differences should appear even stronger among less educated respondents. However, such assertion calls a replication using a more representative sample. Beyond the context of the last visit to the doctor, replications in other contexts of evaluation, especially for companies relying on ratings to expand (e.g., apps downloading), could also empirically ensure generalizability. More broadly, data collection might suffer from a lack of fluency in various domains. For example, most online shops apply recommender systems using a user’s transactional data or other users’ social media data available to make product recommendations (Akter and Wamba, 2016, Heimbach, Gottschlich and Hinz, 2015). Navigation on online shops or social media platforms not fluently designed might result in poor user data quality, leading to inappropriate product recommendations. From this standpoint, we call for further research on online data collection fluency.
7. Conclusion
Online shopping development went hand in hand with online self-administered customer satisfaction evaluation requirement. However, the specific context of online rating, without any face-to-face clarification, raises the question of accuracy and appropriateness of the chosen tool for respondents. To address this issue, this research proposes the new concept of “response fluency” to qualify the ease with which a question is processed. Applied to the Evaluative Space Grid, a new grid that has been proposed in psychology to measure overall evaluation, this research shows how response fluency mediates the influence of measurement tool design on response certainty. In other words when it is easier to rate satisfaction on a simplified labeled tool respondents are more likely to be certain of the level of satisfaction they expressed. Because certain evaluation is associated with greater attitude–behaviour correspondence, market research managers could expect to make better predictions.
These findings shed light on the influence of measurement tool formats on data quality in market research. In line with previous research (Couper, Traugott and Lamias, 2001, Deutskens et al., 2004, Hu, Toh and Lee, 1996, Manfreda, Batagelj and Vehovar, 2002, Sheehan and McMillan, 1999), we consider measurement tool design a frame likely to produce framing effects. As such, small modifications of measurement tool design can significantly improve data quality. Similar to other “choices architectures” (Thaler and Sunstein, 2003), the design of measurement tools deserves a more systematic exploration of how they can “nudge” participants into giving better-quality responses.
Also showing that response fluency increases response certainty invites practitioners to take into account how their measurement tools and surveys perform in terms of response fluency, as it can significantly improve the quality of the data they collect. As such, designing smarter measurement tool could drive more relevant managerial insights and predictions. In light of the dictatorial rule of “five questions, two minutes completion” put forward by market research institutes when building questionnaires, this new approach offers promising
ways to address online survey challenges, in which respondents usually do not like to spend too much time reading instructions or answering surveys (Dolnicar, Grün and Leisch, 2011).
Going further, our findings also provide practitioners with a new rationale for explaining results they can sometimes observe when interrogating consumers. For example, previous research shows that enhancing questionnaires with visual elements, such as pictures, can improve response quality (Deutskens et al., 2004). In light of our findings, this may be because pictures increase response fluency. As previous research highlights, improving consumer certainty positively affects consumer behaviour predictions (e.g., Maier, Wilken and Dost, 2014). In the context of online data collection, response certainty improvement offers respondents a more comfortable posture, which again may result in stronger agreement to participate in surveys and prevent survey dropout.
We hope that this work on response fluency will provide guidelines regarding measurement tool design in order to encourage practitioners to expand use new tool, such as the ESG, likely to capture rich and detailed information.
Acknowledgments
The authors wish to acknowledge the support of the AFNOR Chair Performance des Organisations of the Fondation of Paris-Dauphine which funded the data collection.
References
Akter, S. and Wamba, S. F., 2016. Big data analytics in e-commerce: a systematic review and agenda for future research. Electronic Markets, 26(2), pp. 173-194.
Alter, A. L. and Oppenheimer, D. M., 2008. Effects of fluency on psychological distance and mental construal (or why New York is a large city, but New York is a civilized jungle). Psychological Science, 19(2), pp. 161-167.
Alwin, D. F., 1997. Feeling Thermometers Versus 7-Point Scales Which are Better? Sociological Methods & Research, 25(3), pp. 318-340.
Alwin, D. F. and Krosnick, J. A., 1991. The Reliability of Survey Attitude Measurement: The Influence of Question and Respondent Attributes. Sociological Methods & Research, 20(1), pp. 139-181.
Andrade, E. B. and Cohen, J. B., 2007. On the Consumption of Negative Feelings. Journal of Consumer Research, 34(3), pp. 283-300.
Antil, J. H., 1983. Uses of response certainty in attitude measurement. Advances in Consumer Research, 10(1), pp. 409-415. Audrezet, A., Olsen, S. O. and Tudoran, A. A., 2016. The GRID Scale: a New Tool for Measuring Service Mixed Satisfaction.
Journal of Services Marketing, 30(1), pp. 29-47.
Bandura, A., 1994. Self-efficacy. In: V. S. Ramachaudran, ed. Encyclopedia of human behavior. New York: Academic Press. pp. 71-81.
Bassili, J. N., 1996. Meta-Judgmental versus Operative Indexes of Psychological Attributes: The Case of Measures of Attitude Strength. Journal of Personality and Social Psychology, 71(4), pp. 637–653.
Bizer, G. Y., Tormala, Z. L., Rucker, D. D. and Petty, R. E., 2006. Memory-Based versus On-Line Processing: Implications for Attitude Strength. Journal of Experimental Social Psychology, 42(5), pp. 646–653.
Cacioppo, J. T., Berntson, G. G., Bechara, A., Tranel, D. and Hawkley, L. C., 2011. Could an Aging Brain Contribute to Subjective Well-Being? The Value Added by a Social Neuroscience Perspective. In: A. Todorov, S. Fiske and D. A. Prentice, eds. Social neuroscience: Toward understanding the underpinnings of the social mind. USA: Oxford University Press. pp. 249-262.
Cacioppo, J. T., Norris, C. J., Decety, J., Monteleone, G. and Nusbaum, H., 2009. In the Eye of the Beholder: Individual Differences in Perceived Social Isolation Predict Regional Brain Activation to Social Stimuli. Journal of cognitive neuroscience, 21(1), pp. 83-92.
Capaldi, E. D., 1996. Why we eat what we eat: The Psychology of Eating. Washington, DC: American Psychological Association.
Cho, W. H., Lee, H., Kim, C., Lee, S. and Choi, K. S., 2004. The Impact of Visit Frequency on the Relationship Between Service Quality and Outpatient Satisfaction: a South Korean Study. Health services research, 39(1), pp. 13-34.
Couper, M. P., Traugott, M. W. and Lamias, M. J., 2001. Web Survey Design and Administration. Public opinion quarterly, 65(2), pp. 230-253.
Cox III, E. P., 1980. The Optimal Number of Response Alternatives for a Scale: A Review. Journal of Marketing Research, 17(November), pp. 407-422.
Deutskens, E., De Ruyter, K., Wetzels, M. and Oosterveld, P., 2004. Response Rate and Response Quality of Internet-Based Surveys: An Experimental Study. Marketing Letters, 15(1), pp. 21-36.
Dolnicar, S., Grün, B. and Leisch, F., 2011. Quick, Simple and Reliable: Forced Binary Survey Questions. International journal of market research, 53(2), pp. 231-252.
Franks, J. J. and Bransford, J. D., 1974. A brief note on linguistic integration. Journal of Verbal Learning and Verbal Behavior, 13(2), pp. 217-219.
Garland, R., 1990. A Comparison of Three Forms of the Semantic Differential. Marketing Bulletin, 1(1), pp. 19-24. Green, P. E. and Rao, V. R., 1970. Rating Scales and Information Recovery. How Many Scales and Response Categories to
Use? Journal of Marketing, 34(3), pp. 33-39.
Hastie, R. and Park, B., 1986. The Relationship Between Memory and Judgment Depends on Whether the Judgment Task is Memory-based or On-line. Psychological Review, 93(3), pp. 258-268.
Haumann, T., Quaiser, B., Wieseke, J. and Rese, M., 2014. Footprints in the Sands of Time: A Comparative Analysis of the Effectiveness of Customer Satisfaction and Customer–Company Identification over Time. Journal of Marketing, 78(6), pp. 78-102.
Hayes, A. F., 2009. Beyond Baron and Kenny: Statistical Mediation Analysis in the new Millennium. Communication monographs, 76(4), pp. 408-420.
Heimbach, I., Gottschlich, J. and Hinz, O., 2015. The value of user’s Facebook profile data for product recommendation generation. Electronic Markets, 25(2), pp. 125-138.
Hibbing, J. R., Smith, K. B. and Alford, J. R., 2014. Differences in Negativity Bias Underlie Variations in Political Ideology. Behavioral and Brain Sciences, 37(03), pp. 297-307.
Homburg, C., Allmann, J. and Klarmann, M., 2014. Internal and External Price Search in Industrial Buying: The Moderating Role of Customer Satisfaction. Journal of Business Research, 67(8), pp. 1581-1588.
Hu, M. Y., Toh, R. S. and Lee, E., 1996. Impact of the Level of Aggregation on Response Accuracy in Surveys of Behavioral Frequency. Marketing Letters, 7(4), pp. 371-382.
Hulbert, J., 1975. Information Processing Capacity and Attitude Measurement. Journal of Marketing Research, 12(1), pp. 104-106.
Hung, W.-H. and McQueen, R. J., 2004. Developing an evaluation instrument for e-commerce web sites from the first-time buyer’s viewpoint. Electronic Journal of Information Systems Evaluation, 7(1), pp. 31-42.
Jha, A. K., 2015. Health Care Providers Should Publish Physician Ratings. Harvard Business Review, October. Kaplan, K. J., 1972. On the Ambivalence-Indifference Problem in Attitude Theory and Measurement: a Suggested
Modification of the Semantic Differential Technique. Psychological Bulletin, 77(5), pp. 361-372.
Kock, N., 2009. The evolution of costly traits through selection and the importance of oral speech in e-collaboration. Electronic Markets, 19(4), pp. 221-232.
Kock, N. and DeLuca, D., 2007. Improving business processes electronically: An action research study in New Zealand and the US. Journal of Global Information Technology Management, 10(3), pp. 6-27.
Labroo, A. A. and Lee, A. Y., 2006. Between two Brands: A Goal Fluency Account of Brand Evaluation. Journal of Marketing Research, 43(3), pp. 374-385.
Larsen, J. T., Norris, C. J., McGraw, A. P., Hawkley, L. C. and Cacioppo, J. T., 2009. The Evaluative Space Grid: A Single-Item Measure of Positivity and Negativity. Cognition and Emotion, 23(3), pp. 453-480.
Lech, P., 2007. Proposal of a compact IT value assessment method. The Electronic Journal of Information Systems Evaluation, 10(1), pp. 73-82.
Lee, A. Y. and Aaker, J. L., 2004. Bringing the frame into focus: the influence of regulatory fit on processing fluency and persuasion. Journal of Personality and Social Psychology, 86(2), pp. 205.
Lee, A. Y. and Labroo, A. A., 2004. The effect of conceptual and perceptual fluency on brand evaluation. Journal of Marketing Research, 41(2), pp. 151-165.
Leimeister, J. M., Österle, H. and Alter, S., 2014. Digital services for consumers. Electronic Markets, 24(4), pp. 255-258. Liu, H.-C., Jeng, B.-C., Mai, Y.-T., Jheng, Y.-D. and Lin, H.-T., 2014. Design of online survey system with an advanced IPA discrimination index for customer satisfaction assessment. Electronic Commerce Research, 14(3), pp. 223-243. Maier, E., Wilken, R. and Dost, F., 2014. The Double Benefits of Consumer Certainty: Combining Risk and Range Effects.
Marketing Letters, 26(4), pp. 473-488.
Manfreda, K. L., Batagelj, Z. and Vehovar, V., 2002. Design of Web Survey Questionnaires: Three Basic Experiments. Journal of Computer-Mediated Communication, 7(3), pp. 1-28.
Mittal, V. and Baldasare, P. M., 1996. Eliminate the Negative: Managers Should Optimize Rather Than Maximize Performance to Enhance Patient Satisfaction. Journal of health care marketing, 16(3), pp. 24-31.
Neirotti, P., Raguseo, E. and Paolucci, E., 2016. Are customers’ reviews creating value in the hospitality industry? Exploring the moderating effects of market positioning. International Journal of Information Management, in press.
Novemsky, N., Dhar, R., Schwarz, N. and Simonson, I., 2007. Preference fluency in choice. Journal of Marketing Research, 44(3), pp. 347-356.
Oppenheimer, D. M., 2008. The secret life of fluency. Trends in cognitive sciences, 12(6), pp. 237-241.
Peterson, R., 1997. A Quantitative Analysis of Rating-scale Response Variability. Marketing Letters, 8(1), pp. 9-21. Petrocelli, J. V., Tormala, Z. L. and Rucker, D. D., 2007. Unpacking Attitude Certainty: Attitude Clarity and Attitude
Correctness. Journal of Personality and Social Psychology, 92(1), pp. 30-41.
Petrocelli, J. V. and Whitmire, M. B., 2017. Emotion Decoding and Incidental Processing Fluency as Antecedents of Attitude Certainty. Personality and Social Psychology Bulletin, 43(7), pp. 924-939.
Pollack, I., 1952. The Information of Elementary Auditory Displays. Journal of the Acoustical Society of America, 24(6), pp. 745-749.
Reber, R. and Schwarz, N., 1999. Effects of perceptual fluency on judgments of truth. Consciousness and cognition, 8(3), pp. 338-342.
Regier, D. A., Watson, V., Burnett, H. and Ungar, W. J., 2014. Task Complexity and Response Certainty in Discrete Choice Experiments: An Application to Drug Treatments for Juvenile Idiopathic Arthritis. Journal of Behavioral and Experimental Economics, 50(June), pp. 40-49.
Schooler, L. J. and Hertwig, R., 2005. How forgetting aids heuristic inference. Psychological Review, 112(3), pp. 610. Schwarz, N., in press. Of fluency, beauty, and truth: Inferences from metacognitive experiences. In: J. Proust and M. Fortier,
eds. Metacognitive diversity: an interdisciplinary approach. New York: Oxford University Press.
Sheehan, K. B. and McMillan, S. J., 1999. Response Variation in E-mail Surveys: An Exploration. Journal of advertising research, 39(4), pp. 45-54.
Song, H. and Schwarz, N., 2008. If it's Hard to Read, it's Hard to do: Processing Fluency Affects Effort Prediction and Motivation. Psychological Science, 19(10), pp. 986-988.
Stamenkov, G. and Dika, Z., 2016. Bank employees’ internal and external perspectives on e-service quality, satisfaction and loyalty. Electronic Markets, 26(3), pp. 291-309.
Thaler, R. S. and Sunstein, C., 2003. Nudge: Improving Decisions about Health, Wealth and Happiness. New York, NY: Penguin Books.
Thompson, M. M., Zanna, M. P. and Griffin, D. W., 1995. Let's not Be Indifferent About (Attitudinal) Ambivalence. In: R. E. Petty and J. A. Krosnick, eds. Attitude Strength: Antecedents and Consequences. Mahwah, NJ: Lawrence Erlbaum. pp. 361-386.
Thornton, J. R., 2011. Ambivalent or Indifferent? Examining the Validity of an Objective Measure of Partisan Ambivalence. Political Psychology, 32(5), pp. 863-884.
Törmälä, Z. L. and Petty, R. E., 2004. Resistance to Persuasion and Attitude Certainty: The Moderating Role of Elaboration. Personality and Social Psychology Bulletin, 30(11), pp. 1446–1457.
Tourangeau, R. and Ellsworth, P. C., 1979. The role of facial response in the experience of emotion. Journal of Personality and Social Psychology, 37(9), pp. 1519.
Tulving, E. and Schacter, D. L., 1990. Priming and Human Memory Systems. Science, 247(4940), pp. 301-306.
Udo, G. J., Bagchi, K. K. and Kirs, P. J., 2010. An assessment of customers’e-service quality perception, satisfaction and intention. International Journal of Information Management, 30(6), pp. 481-492.
White, K., MacDonnell, R. and Dahl, D. W., 2011. It's the mind-set that matters: The role of construal level and message framing in influencing consumer efficacy and conservation behaviors. Journal of Marketing Research, 48(3), pp. 472-485.
Whittlesea, B. W. A., 1993. Illusions of Familiarity. Journal of Experimental Psychology: Learning, Memory, and Cognition, 19(6), pp. 1235–1253.
Wilson, T. D., Dunn, D. S., Kraft, D. and Lisle, D. J., 1989. Introspection, Attitude Change, and Attitude-Behavior Consistency: The Disruptive Effects of Explaining why we Feel the Way we do. Advances in Experimental Social Psychology, 22, pp. 287–343.
Winkielman, P., Schwarz, N., Fazendeiro, T. and Reber, R., 2003. The Hedonic Marking of Processing Fluency: Implications for Evaluative Judgment. In: J. Musch and K. C. Klauer, eds. The psychology of evaluation: Affective processes in cognition and emotion. Mahwah, NJ: Lawrence Erlbaum Associates, Inc. pp. 189-217.
Wu, L., 2013. The antecedents of customer satisfaction and its link to complaint intentions in online shopping: an integration of justice, technology, and trust. International Journal of Information Management, 33(1), pp. 166-176. Yan, T. and Tourangeau, R., 2008. Fast times and easy questions: the effects of age, experience and question complexity on
web survey response times. Applied Cognitive Psychology, 22(1), pp. 51-68.
Yoo, S.-J., 2010. Two Types of Neutrality: Ambivalence versus Indifference and Political Participation. Journal of Politics, 72(1), pp. 163-177.