UMR 225 IRD - Paris-Dauphine
UMR DIAL 225
Place du Maréchal de Lattre de Tassigny 75775 • Paris Cedex 16 •Tél. (33) 01 44 05 45 42 • Fax (33) 01 44 05 45 45
D
OCUMENT DE
T
RAVAIL
DT/2012-06
How beliefs about the impact of
immigration shape policy
preferences: Evidence from Europe
Jérôme HERICOURT
Gilles SPIELVOGEL
HOW BELIEFS ABOUT THE IMPACT OF IMMIGRATION SHAPE POLICY PREFERENCES: EVIDENCE FROM EUROPE
Jérôme HERICOURT EQUIPPE, Universités de Lille Centre d'Economie de la Sorbonne Université Paris 1 Panthéon-Sorbonne
[email protected] Gilles Spielvogel UMR Développement et Société, Université Paris 1 Panthéon-Sorbonne UMR 225 DIAL, IRD, Université Paris Dauphine
Document de travail UMR DIAL
Juin 2012
Abstract
This paper studies the joint determination of beliefs about the economic impact of immigration and immigration policy preferences, using data from the five waves of the European Social Survey (2002-2010). In addition to standard socioeconomic characteristics, this analysis takes into account individual media consumption as a determinant of opinion about immigration. Our results stress the important role of the endogenous determination of beliefs, which appear as a major determinant of policy preferences. Besides, media exposure appears as a key determinant of beliefs: individuals spending more time to get informed on social and political matters through newspapers and radio have a better opinion on the economic impact of immigration relatively to individuals which devote time to other types of contents.
Keywords: International migration, beliefs, preferences, attitudes, media.
Résumé
Cet article étudie la détermination conjointe des croyances concernant l'impact économique de l'immigration et des préférences en matière de politiques migratoires, en utilisant les données provenant des cinq vagues de l'European Social Survey (2002-2010). En plus des caractéristiques socio-économiques classiques, cette analyse prend en compte l'exposition aux médias en tant que déterminant de l'opinion sur l'immigration. Nos résultats soulignent le rôle clé de la formation endogène des croyances, qui apparaissent comme un déterminant majeur de préférences en matière de politiques migratoires. Par ailleurs, l'exposition aux médias est un déterminant important des croyances: les individus passant plus de temps à s'informer sur les questions sociales et politiques à travers la presse écrite et la radio ont une opinion plus positive de l'impact économique de l'immigration, relativement aux individus qui consacrent du temps à d'autres types de contenu.
Mots Clés : Migrations internationales, croyances, préférences, opinion, médias. JEL Codes : F22, D72, D83, J15.
1
Introduction
Growing migration flows to developed countries over the past 20 years have transformed several Euro-pean countries of emigration into countries of immigration, while patterns of migration – countries of origin and types of migration – have become increasingly diversified. The changing situation, as well as the ongoing emergence of a European immigration policy, has prompted more frequent shifts in national migration policies. The setting of migration policies is a complex process, in which public opinion plays a significant role. In the years preceding the current economic crisis, the steady improvement in the employment situation had helped calm the debate on labor migration and reduce the weight of opinion opposed to increased immigration in many developed countries. However, the crisis threatens to revive opposition to immigration and foster anti-immigrant feelings. Concerns are again being expressed in some circles over what is seen as unfair competition from immigrants in the labor market and their po-tential negative impact on public finances. Managing these popo-tential sources of social tension presents a serious challenge to governments of developed countries, especially as prevailing demographic trends will require many of them to reappraise the role of labor migration over the next few years.
A recent, growing literature in economics and political science has analyzed the determinants of individual preferences regarding migration policy, paying particular attention to the role played by per-ceptions of the economic effects of immigration and by concerns about the impact of immigration on the way of life of local populations (Scheve and Slaughter, 2001; Mayda, 2006; Sides and Citrin, 2007; Hainmueller and Hiscox, 2007; Card et al., 2012). Basically, this literature attempts to uncover the fun-damental motives which make some people more or less favorable to immigration. In dealing with the economic dimension, the literature has focused mainly on two issues: first, the impact of immigration on the national labor market; and second, the impact of new arrivals on public finances and social protection systems.
The arrival of immigrants on the domestic labor market may be seen by local workers as a source of new competition for available jobs. Assuming imperfect substitutability between different types of labor, the structure of immigrants’ qualifications is of crucial importance in understanding the impact of im-migration on the labor market. Low-skilled native-born workers will face competition from low-skilled immigrant workers just as highly qualified native-born workers will have to compete with highly qual-ified immigrant workers. Resident workers’ individual opinions about immigration will consequently depend on their qualifications, and also on the nature of migration policy. While the empirical debate is still going on, most of the literature has so far found only small or negligible effects of immigration on the wages of native-born workers (Card, 1990; Borjas, 2003; Manacorda et al., 2012; Ottaviano and Peri,
2012). However, the actual threat of competition has less influence on resident workers’ opinions about immigration than the perceived threat. Indeed, in 2002, almost 40% of Europeans were concerned about detrimental wage effects through immigration1.
As to the supposed implications for public finances, immigration could have two contradictory ef-fects. A positive effect would be that the influx of immigrants, preferably with moderate or high quali-fications, could provide an adequate solution to the growing problem of funding pay-as-you-go pension schemes presented by the ageing of the population in the developed countries. A negative effect would be that low-skilled immigrants accompanied by their families may become net beneficiaries of the so-cial protection system if, for example, they draw sickness and unemployment benefits or receive family allowances. In that case, immigration will aggravate the problem of funding pay-as-you go systems in-stead of remedying it. There is no consensus in the academic literature on either of these two effects, and studies tend to find that immigration has a minimal or negligible impact on public finances (Rowthorn, 2008; Dustmann et al., 2010).
However, it is the subjective perception of the effects (and not an objective assessment) that could lead individuals to come out for or against immigration. Furthermore, it seems quite likely that preferences about immigration are influenced not only by economic factors but also by political and cultural attitudes, which may reflect a certain conservatism, an attachment to a certain idea of national identity, or in extreme cases xenophobic feelings towards immigrants. Most of the empirical work that sets out to deal separately with the different roles played by economic factors and by political/cultural factors is faced with the problem of accounting for the influence of education in each case. As Hainmueller and Hiscox (2007) show with reference to the European Social Survey 2002, educational level is a key determinant of individual opinion about immigration, not only because it influences attitudes toward competition from immigrant workers in the job market but also because it reflects differences in cultural values. The most educated individuals are significantly more amenable to cultural diversity than the others. They are also more inclined to believe in the economic benefits of immigration. At the same time, the factors that influence individual perceptions of the effects of migration and individual views on allowing entry to immigrants are either the same or at least very closely related. However, this question of the endogenous nature of beliefs about the impact of immigration has been, to our best knowledge, neglected by the literature until now.
Besides, media influence on public opinion has been the subject of much research by political scien-tists and sociologists. A consensus has emerged that recognizes the unifying impact of the mass media on public opinion and the consequent falling away of ethnic, geographic, and socio-economic differences
1
(Shaw and Martin, 1992; Mendelsohn and Nadeau, 1996). Associated issues relating to media coverage of immigration and migration policy have been addressed in numerous studies. Because of their wide-ranging social and political implications migration issues have been attracting constant media attention since the 1970s. A number of analytical studies have shown that growing commercialization of the mass media networks has led them to adopt a routinely sensationalist approach to the issues, thereby reinforc-ing negative public perceptions (Benson, 2002; Benson and Saguy, 2005). At the same time, the effect of beliefs (individual as well as collective) on the debate is by no means negligible, and consequently helps to shape individual opinions (Boswell, 2009; Esses et al., 2001; Jackson and Esses, 2000).
Other studies describe the impact on public opinion of the positions taken by the media on im-migration issues. In the case of the United States, Akdenizli et al. (2008) analyse media coverage of immigration from 1980 onwards, but with a particular focus on the heated debates of 2006 and 2007 over the proposed reform of American immigration policy. The authors conclude that American pub-lic opinion about immigration reached an unprecedented degree of radicalism and assertiveness, which made it very difficult to find a political compromise in Congress. The study claims that this situation was the result of the increasing fragmentation of the media industry which has intensified competition for audience share. The old and new media alike are therefore more inclined to focus on immigration if it can be linked to problems of crime, economic crisis, or violent political controversy. From the same perspective, Tsoukala (2002) looks into the criminalisation of immigration in French, German, Italian and Greek news coverage during the 1990s. She observes that “far from reflecting reality, the media structures one reality, which ultimately helps to shape public opinion to varying degrees”. While it is not directly determined by the media, public opinion “tends to be determined by the ideological frame of reference supplied by the media”. According to Tsoukala, media coverage of immigration legitimises a general viewpoint that associates immigration with crime and urban violence. The author concludes that these media representations have led over time to a blurring of the distinction between illegal immi-grants, legal immiimmi-grants, and second-generation immiimmi-grants, and also between foreigners and nationals of minority ethnic or religious origin. Using survey data for the United States, Facchini et al. (2009) find evidence that – in addition to standard labor market and welfare state considerations – media exposure is significantly correlated with public opinion on illegal immigration. Nevertheless, most of these studies had a qualitative approach of the phenomenon, and none of them attended to assess precisely by which means media exposure influence beliefs and opinions about immigration, and the relative importance of the latter compared to the other standard determinants.
The study of the impact of standard socioeconomic determinants and the exposure to different type of medias on both beliefs (about the economic impact of immigration) and policy preferences (about
immigration) in this paper aims at filling these gaps. Our empirical analysis is based on five waves of the European Social Survey over the 2002-2010 time span. Our contribution is twofold.
First, we address the issue of the joint determination of beliefs about the economic impact of immi-grationand immigration policy preferences. Since it is more directly related to policy options, most of the literature has focused on the latter, and usually neglected the former. A notable exception is Sides and Citrin (2007), who look at the individual determinants of both dimensions but do not investigate the correlation between beliefs and preferences. There is evidently a strong link between these two variables, but the authors justify their approach by the ambiguity of the causation: “It may be that beliefs about consequences lead to preferred levels. Or beliefs about consequences may only be rationalizations of preferred levels” (p. 485). However, omitting a relevant covariate in a regression biases the coefficients of the other variables. Hainmueller and Hiscox (2007) include the belief variable as a determinant of policy preferences, but do not consider its potential endogeneity, which is also likely to bias the esti-mated coefficients. In order to address these issues, we propose an empirical model which explicitly accounts for both the formation of beliefs and the link between beliefs and preferences, assuming that the causation runs from beliefs about the impact of immigration to the expression of policy preferences. Second, we take into account individual media consumption as a determinant of opinion about immi-gration. We hypothesize that different patterns of media consumption may lead to different perceptions and levels of knowledge about migration issues, especially relating to education levels. Our data allows notably to distinguish between the type of media (TV, press, or radio) and contents (news and politics as opposed to other things) involved. We also attempt to check the sensitivity of our results to the fact that individuals self-select into media exposure.
The remainder of this paper is organized as follows. In the next section, we present the data used in our empirical analysis. Section 3 presents the analytical framework. Section 4 presents the results. A number of robustness checks are carried out in section 5, and section 6 concludes.
2
Data
2.1 Database
Our empirical analysis relies on five rounds of the European Social Survey (ESS2): 2002, 2004, 2006, 2008, and 2010. The ESS is an academically-driven social survey designed to explain the attitudes, beliefs and behavior patterns of its diverse populations. The survey covers more than 30 nations. The central aim of the ESS is to gather data about changing values, attitudes, attributes and behavior patterns
2
within European polities.
Our sample only includes the 16 countries for which the survey is available for the whole period3. The dataset is, however, not a panel of individuals since the samples are different for each survey.
2.2 Variables of interest
Our focus is on both openness to migration and beliefs regarding the impact of immigration on the econ-omy. The first variable scales from 1 (“Allow no people from the same race or ethnic group to live here”) to 4 (“Allow many to come and live here”)4, the second from 0 (“immigration is bad for the economy”) to 10 (“immigration is good for the economy”). Turning to explanatory variables, we first use several socio-demographic variables typically used in the literature: age, sex, education (distinguishing between primary, secondary and tertiary education) type of area of residence (large cities and suburbs vs. small cities and rural areas5), employment status and political partisanship (1 if the respondent claims to be left wing, 0 otherwise). We also include information related to the immigrant background of the respondent: this variable takes the value 0 for individuals born in their country of residence, and whose parents were also born in their country of residence, 1 otherwise. In order to get an idea of the importance of economic factors, the regional (at the NUTS2 level) rate of unemployment is also included, as well as the respon-dent’s assessment of the the state of the economy (from 0 for “extremely satisfied” to 10 “extremely dissatisfied”). Besides, one of the contributions of the paper is the introduction of variables represent-ing media exposure. At most six variables are included, representrepresent-ing the respondent’s consumption (in fraction of hours per day) of television, radio and print media, and discriminating between “news and politics” contents and other subjects.
Descriptive statistics are given in Tables 1 and 2. Table 1 displays some conventional statistics on our main variables over the whole sample. Unsurprisingly, respondents are on average a bit more open to immigration of people from the same ethnicity as the majority than from a different one. Overall, one third of the respondents indicate that their country should allow no or only a few immigrants from the same ethnic background as the majority. This proportion increases to 45% for immigrants from a different ethnic background. Concerning their beliefs regarding the impact of immigration on the economy, respondents appear on average almost neutral, with an average close to the modal answer (5). There are, however, more respondents indicating a negative belief (36% between 0 and 4) than
3
Belgium, Czech Republic, Denmark, Germany, Ireland, Finland, France, Netherlands, Norway, Poland, Portugal, Slovenia, Spain, Sweden, Switzerland and United Kingdom.
4
The original variable was actually coded the reverse way. We recoded it so that any variation of right-hand side variables can be interpreted symmetrically.
5This distinction appears more relevant than a simple urban vs. rural one. Indeed, most immigrants are located in large
a positive one (27% between 6 and 10). The distribution of media consumption variables shows that respondents consume less contents devoted to “news and politics” than to other subjects. Among the three types of media considered, television is unsurprisingly the dominating one (between 45 and 75 minutes), followed by radio (between 30 and 50 minutes); print media are far behind (around 20 minutes per day). Eventually, Table 2 reports means of our main interest variables for each year surveyed. If anything, it shows a remarkable stability of our sample across the years.
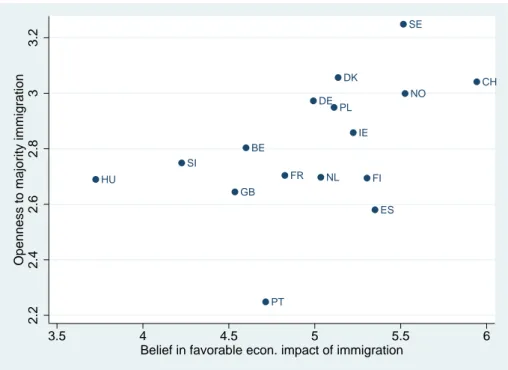
Finally, graph 1 plots country-means for the two variables “Openness to immigration from the same ethnic group” and “Belief in a favorable impact of immigration” over the 2002-2010 period. With the exception of Portugal6, a clear positive correlation between beliefs in a favorable impact of immigration on the economy and openness to immigration (at least from the same ethnic group) appears. This is indeed what our econometric analysis will suggest at the micro level.
3
Empirical framework
3.1 Model
We want to study the joint determination of beliefs regarding the economic impact of immigration (B) and preferences about immigration policy (P ). More specifically, we estimate the following model at the individual level7:
Bi= γZi+ αXi+ βMi+ δUR+ λc+ ui (1)
Pi= θBi + ωXi+ µMi+ ηUR+ λc+ vi (2)
where Xi is a vector of social, demographic and economic characteristics of the individual: gender,
age, education, employment status, immigration background, place of residence (urban vs. rural) and political preferences. Mi captures the exposure to different media contents and sources, measured by
the time devoted daily to media consumption along two dimensions: type of media source (TV, radio and newspaper) and type of content (politics, news and current affairs vs. other contents). UR is the
unemployment rate in the NUTS 2 region of residence of the individual8. Zi is an excluded instrument
uncorrelated with policy preferences (cf. section “Econometric issues” below), λc is a collection of
country dummies and u and v are error terms. In addition, when we analyze datasets covering several years, we add time dummies.
6
Portugal displays specific features that will be more thoroughly examined in the Robustness section (see below).
7
We drop time subscripts for the sake of legibility.
The recursive structure we hypothesize for of our empirical model reflects structural assumptions regarding the formation of beliefs and preferences in terms of migration policy. If beliefs and openness to immigration are likely to be co-determined by the same variables, we assume that beliefs have a causal impact on preferences, but not the other way round. In other words, the formation of beliefs comes first, preferences being determined “afterwards”, conditional on beliefs.
3.2 Econometric issues
The recursive structure of our empirical model and the nature of the dependent variables raise several estimation issues, which are not easy to tackle simultaneously. Firstly, the joint determination of equa-tions (1) and (2) may result in some correlation of error terms ui and vi. This would imply to rely on a
system estimation methodology. Secondly, the assumption we make about the causality between beliefs and preferences clearly requires to control for the endogeneity of the former. Finally, both independent variables – beliefs Bi (ordered from 0 to 10) and preferences Pi(from 0 to 4) – are clearly ordinal.
Handling all these problems simultaneously would require to combine bivariate ordered probit es-timation with IV methodology. Such an estimator would be highly complex, and its efficiency ques-tionable. Besides, preliminary investigations showed that correlation between residuals, if existent, had a negligible impact on the significance of our estimates. In such a context, turning to single-equation methodology is the most efficient option. Finally, the use of ordered probit estimations, especially for equation (1), beyond being highly costly on the computational ground, generates a large number of marginal effects uneasy to interpret, with only little information gain.
Our estimation strategy relies therefore on linear methods, combined with an Instrumental Variable (IV) approach. We implement two-stage-least-squares (2SLS)-type estimations9. Equation (1), the first stage equation, will be estimated using Ordinary Least Squares. The proper identification of θ therefore requires the inclusion of (at least) one variable Z in the Equation (1) that is not included in Equation (2) (the excluded instrument). Since policy preferences and beliefs are partly the outcomes of a same set of variables, it is inherently difficult to find an instrument uncorrelated with policy preferences. From an economic viewpoint, individual opinion about the state of the economy is a good candidate since it is presumably closely correlated with beliefs about the economic impact of immigration. Indeed, individ-uals having a negative assessment of the economic situation are unlikely to believe that immigration has a positive impact, while those having a positive outlook are unlikely to blame immigration. On the other hand, there is no reason why the opinion about the state of the economy would affect migration policy
9
Note that the first equation is not just a reduced-form expression designed only to instrument an endogenous regressor. It is a “structural” equation, belonging fully to the model.
preferences directly, independently from the link between beliefs and policy preferences.
In all IV estimations, we report the F-stat form of the Kleibergen-Paap statistic, the heteroskedastic and clustering robust version of the Cragg-Donald statistic suggested by Stock and Yogo (2005) as a test for weak instruments. Most statistics are comfortably above the critical values, confirming that our in-strument is a strong predictor of individuals’ beliefs regarding the economic impact of immigration. We also performed the Durbin-Wu-Hausman test for exogeneity of beliefs. Unsurprisingly, the null hypoth-esis of exogeneity is rejected in most cases. This clearly shows that we need to use IV methodologies to identify exogenous variations of beliefs.
More generally, section 5 will show that our results are robust to the use alternative estimation meth-ods (e.g., probit) and subsamples. Finally, in all estimations, standard errors are robust to heteroscedas-ticity and clustered at the country-year level using Froot (1989) correction.
4
Empirical results
4.1 The joint determination of beliefs and opinion
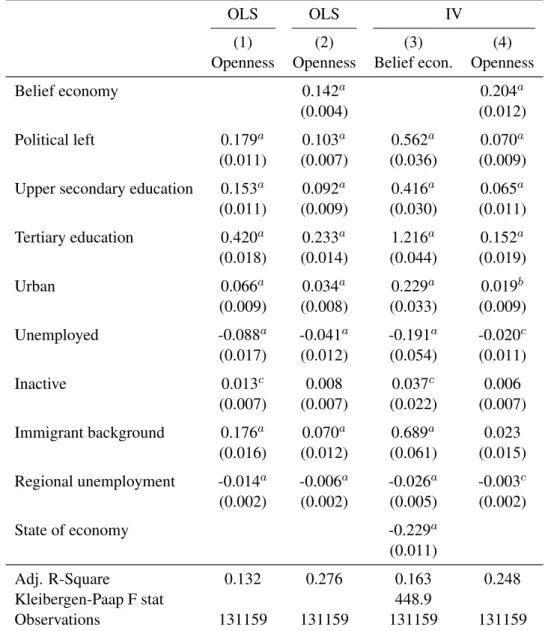
We start with a simple estimation of equation (2) by OLS in columns (1) and (2), the latter including beliefs as an explanatory variable. This specification offers a benchmark estimation of the relationship between preferences regarding migration and beliefs concerning the impact of migration on the economy on the one hand, and the other abovementioned determinants on the other hand. The comparison of columns (1) and (2) shows that omitting the beliefs variable tends to bias the other coefficients upward, confirming the relevance of this variable in the formation of preferences towards immigration. These results can be compared to estimations where beliefs are instrumented by individual opinions about the state of the economy (presented in columns (3) and (4)).
Insert table 3 here
First, estimates presented in columns (2) and (4) appear qualitatively similar. Unsurprisingly, beliefs about the economic impact of immigration have a positive impact on the openness towards immigration. Both variables are positively influenced when individuals display left-wing political preferences and an increased level of education, live an urban area rather than a rural one and have an immigrant back-ground. Conversely, unemployed people believe more frequently in a negative impact of immigration, and are consequently less open. A higher regional unemployment also impacts negatively both beliefs and preferences. However, significance tends to be weaker for some variables (mainly the unemployment and the immigrant background variales, which become insignificant at the 5% level) in the IV estimates, compared to the OLS ones. More generally, IV estimates tend to contrast quantitatively with the OLS
ones, which are affected by a downward bias on the beliefs coefficient, and an upward one (in absolute terms) on all other parameters in equation (2).
The interpretation is straightforward: in equation (2), standard OLS estimates attribute erroneously to other variables a part of the explanatory power of beliefs. On the statistical ground, the strength of our instrument is confirmed by the Kleibergen-Paap statistic, which is above the critical value. Individual opinions about the state of the economy seem indeed to affect strongly the beliefs about the economic impact of immigration (cf. column (3)): the more negative the perception of the state of the economy, the more negative the beliefs.
4.2 The role of media exposure
As mentioned in the introduction, there are many reasons to think that media impacts public opinion and preferences regarding immigration, both by homogenizing the public perceptions on that ground and fostering a sensationalist approach producing a negative bias on the related issues. Using specific information on the media consumption provided by the ESS, we propose to test directly these features, especially by discriminating between different types of media and contents (i.e. news and politics vs. others). If significant, the sign on coefficients of media variables will provide useful insight on the bias of media influence (if any) on individuals’ beliefs and preferences
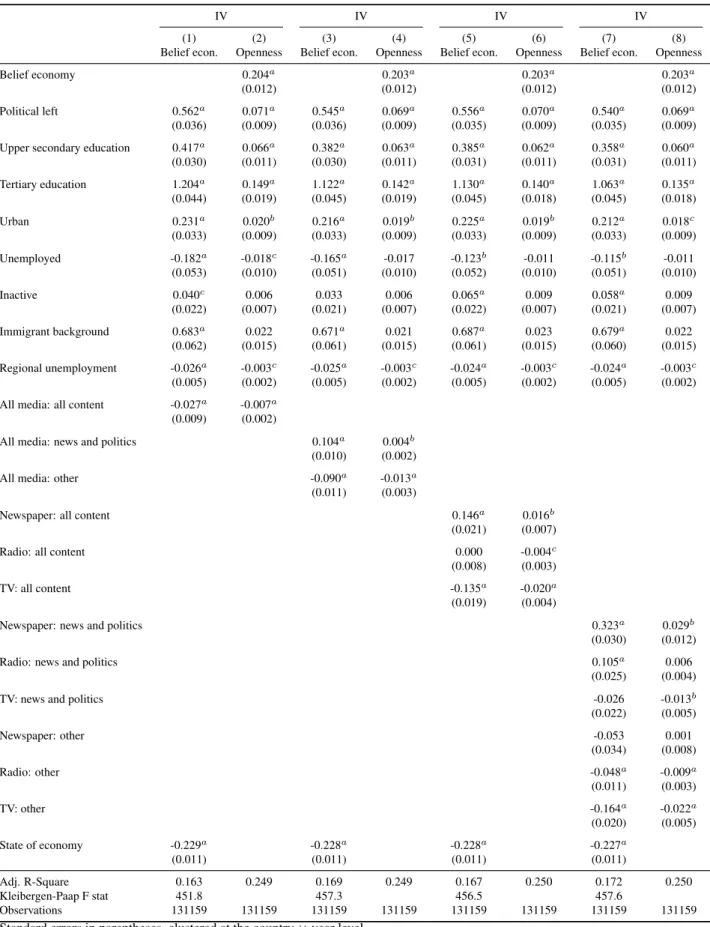
Table 4 adds in the basic regression presented above variables indicating the time devoted to each type of media consumption. In columns (1) and (2), the model includes a single variable indicating the overall time devoted to media consumption (all media and contents). Columns (3) and (4) discriminate between the type of contents, whereas columns (5) and (6) distinguish between the type of media. Finally, columns (7) and (8) cross these two dimensions, with variables reflecting the time devoted to each type of media and content.
Insert table 4 here
While the results on all other variables do not display any significant change, the estimated on media variables are interestingly heterogenous, both quantitatively and qualitatively. Overall, media exposure seems to have a much higher influence on beliefs than on preferences. Going into further details (columns (3) and (4)), we see that individuals with more interest in news and politics display significantly more positive beliefs towards immigration, and to a lesser extent, a higher openness to immigration from the same ethnic group as the majority. Conversely, the exposition to other types of content induces both more negative beliefs and less openness. This would indicate that political and news contents deliver information on immigration that make individuals more positive about its impact. Turning to the type of
media (columns (5) and (6)), it appears that radio does not exert any significant influence. Conversely, there is a clear opposition between newspaper reading and TV watching, the former having a strong positive impact, and the latter, a negative one. Strikingly, coefficients are very close in absolute value, which means that one hour spent reading the newspapers offsets the effect of one hour of TV on both beliefs and policy preferences. We go one step further by distinguishing both media types and contents (columns (7) and (8)), which confirms the positive impact of news and political contents on beliefs through newspapers and radio (whereas the average impact of the latter have been previously shown to be insignificant), only newspapers with news and politics impact also preferences, however. Conversely, TV broadcasts focused on news and politics impact only preferences, but this time, with a negative sign. Exposition to other types of contents through radio and TV (but not newspapers) exhibit a systematic negative influence on both beliefs and preferences.
In short, individuals spending more time to get informed on social and political matters through newspapers and radio have a more positive opinion of the economic impact of immigration, not onely relatively to the average individual, but also (and even more) relatively to the individuals which devote time to other types of media contents. More positive beliefs seem therefore dependent on information related to social matters. The picture is broadly the same for preferences (but once again, with much smaller quantitative impacts), with the exception of TV broadcasts on news and politics, which display a negative impact on openness to immigration. This result could be explained by editorial focuses on more sensasionalist/superficial presentations (on the whole more anxiety-producing), or by different abilities to process information among individuals.
4.3 Media and education
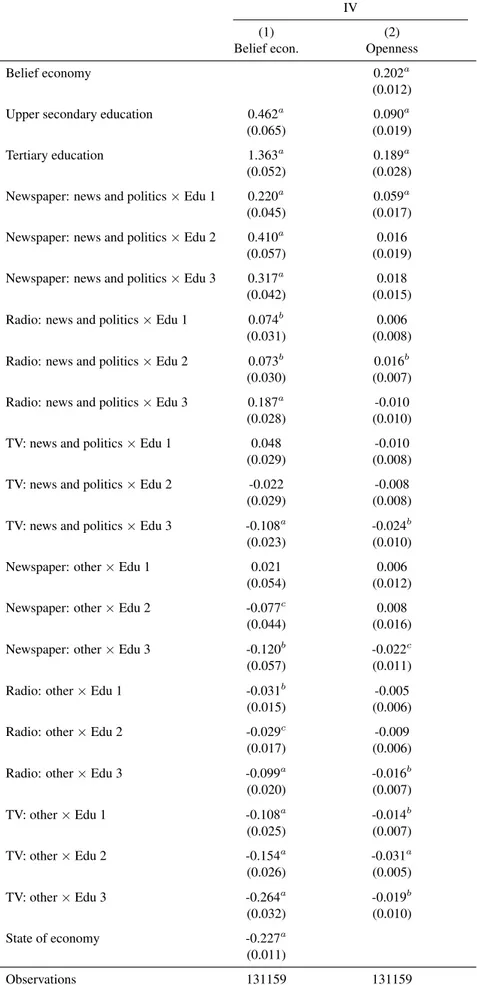
As shown by an abundant literature (Scheve and Slaughter, 2001; Mayda, 2006; Sides and Citrin, 2007; Hainmueller and Hiscox, 2007; Card et al., 2012), education is a key determinant of individual opinion about immigration, not only because it influences attitudes towards competition from immigrant workers in the job market, but also because it reflects differences in cultural values. Our assumption is that education may have an additional impact through media exposure, in terms of both the media and the content considered. Therefore, Table 5 includes, in addition to the previous regressors, interaction terms between each of our media exposure variables and the different levels of education.
Insert table 5 here
The impact of interaction terms (i.e., media consumption depending on the level of education) on public opinion on immigration goes almost only through beliefs. A striking feature of these results
seems that the third level of education (College/University degree, the highest one) magnifies the above-mentioned impacts of media exposure, but does not reverse them. Indeed, more educated people do exhibit a relatively more significant and positive impact of reading (newspapers) or listening (radio) news and political topics; but they also have more negative beliefs when watching TV broadcasts on the same subjects. In other terms, highly educated people who spend relatively more time watching TV tend to believe more to a negative economic impact of immigration. This gives credential to the idea that TV broadcasts focus on other political/social news than the ones displayed in newspapers and radio, or present the same topics in a different way. The same roughly increasing (in absolute value) relationship emerges regarding the exposure to other type of contents, whatever the media considered: more educated people tend to have more negative beliefs, holding constant the type of content.
These results suggest that both the level of education (as a reflection of individuals’ capacity to process consistently information) and the type of content are jointly crucial in explaining the shaping of beliefs regarding the economic impact of immigration.
We also proceed to the same estimation including interaction terms between the media variables and political orientation. Results shown in Table 6 indicate that the impact of media exposure on beliefs and preferences is heterogenous with regards to political orientation. In particular, for left-leaning individu-als, we find a negative impact of watching TN news on beliefs, while there is no impact for the rest of the sample.
5
Robustness checks
We check the robustness of our results to different alternative specifications and estimation methods, including : (i) a complementary variable regarding migration policy preferences; (ii) year-by-year esti-mations; (iii) country-by-country estiesti-mations; (iv) the use of probit and ordered probit estimations for the preferences equation.
5.1 Openness toward a different ethnic migration
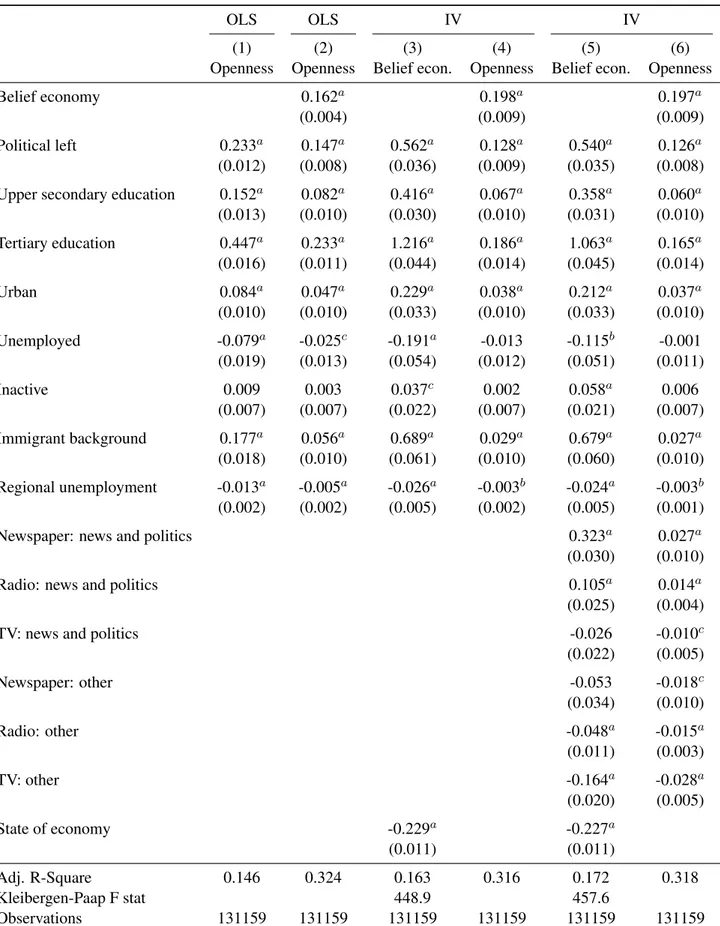
Table 7 presents the results of an estimation where the dependent variable in equation (2) is the degree of openness towards immigration from a different ethnic group than the majority of the local population. The construction of this variable is identical to the one previously used. Columns (1), (2) and (4) replicate the estimates presented in Table 3 (the estimates for column (3) remaining identical, since equation (1) is not affected), and columns (5) and (6) add the variables related to medias consumption.
Insert Table 7
Results regarding social, demographic and economic characteristics are qualitatively almost identical to the ones presented in Table 3. Quantitatively, coefficients appear somewhat higher than those based on the alternative definition of openness: if anything, preferences regarding immigration from a different ethnicity seem to be slightly more determined by these specific characteristics, and a little less by beliefs – the coefficient on the latter appears also a bit smaller in IV estimates. Turning to media exposure, estimates are also broadly similar, but once again with a slightly more marked impact on the openness variable. More specifically, radio broadcasts devoted to news and politics and newspapers dealing with other matters exhibit a significant influence they did not have on preferences regarding immigration from the same ethnic group than the majority of population. As previously, this supports the idea that individuals’ preferences towards migrants from a different ethnic group are slightly less determined by beliefs, and are more influenced by the other variables. But these differences are mostly marginal, and the picture described previously remains largely unchanged.
5.2 Yearly analysis
We further check the robustness of our results to a year-by-year splitting of our sample, that is, we estimate our model on each ESS wave separately. This is done of course to assess the stability of the esti-mates across time, but also to check if the Great Recession of 2008-2009 had any impact on individuals’ beliefs and preferences towards immigration.
Insert Table 8
From a general point of view, these results are consistent with the ones based on pooled regressions, and are qualitatively remarkably stable across the different waves of the survey: both individual deter-minants and media exposure influence much more strongly beliefs than preferences, the former being on the other hand a key explanatory factor shaping preferences towards immigration. Besides, media exposure seems to have an increasing direct impact on preferences after 2006. Quantitatively, there is a slight downward trend on the beliefs coefficient, starting from 0.24 in 2002 and ending at 0.17 in 2008 and 2010. For all other coefficients, the hierarchy remains broadly the same, and the size of the effects keeps being much larger in the beliefs equation than the openness one: an important share of the impact of individual determinants and media consumption on policy preferences goes through the shaping of individuals’ beliefs. In any case, no specific effect of the economic crisis of the late 2000’s seem to appear, neither qualitatively nor quantitatively.
5.3 Explorations for potential national specificities
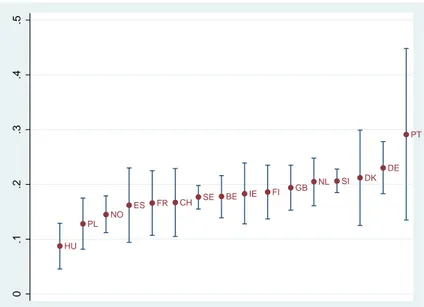
We perform an exercise symmetric to the previous one by reestimating our main two equations on a country-by-country basis. For the sake of clarity, we do not report all regression coefficients10but focus on graphic representations of the beliefs coefficient for each country. This is what reports Figure 2, together with extremities representing confidence band. Finally, Figure 4 replicates the exercise on a yearly basis, in order to have a global overview of the stability of the beliefs/preferences relationship.
Insert Figure 2 Insert Figure 4
Figure 2 shows a noticeable homogeneity in the beliefs coefficient, ranging between 0.1 and 0.2 in most cases. The one for Portugal (almost 0.3) appears as an outlier, but the estimation appears very noisy compared to other countries; to a lesser extent, the same applies to Denmark. Figure 4 confirms that, Portugal and Denmark excepted, the relationship between beliefs and preferences we highlight is robust on both dimensions (country and year).
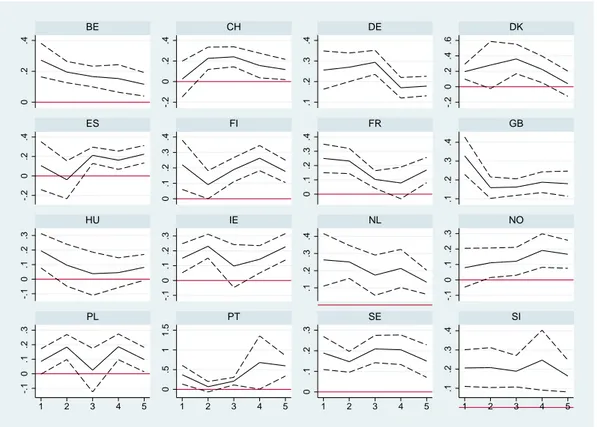
Finally, Figure 3 replicates the exercise of Figure 2 regarding the impact of our six variables related to media exposure on beliefs.
Insert Figure 3
A first striking fact is the strong cross-country heterogeneity regarding media impact. However, it is confirmed that reading of newspapers devoted to political topics and watching TV devoted to other subjects have a (respectively) positive and negative impact on beliefs for most studied countries. Radio broadcasts on news and politics also display a positive influence for a majority of countries. In the other three cases (TV: news and politics, Newspapers: other; Radio: other), the exposition to the media source and content has no significant impact for most of the considered countries. Overall, these results fit consistently with the one commented previously: newspapers and radio broadcasts focused on news on politics shape positively beliefs about the economic impact of immigration, whereas watching TV shows dealing with other topics has the opposite effect.
5.4 Alternative functional forms
Eventually, we check the robustness of our specification to alternative estimation methods. We start by reestmating equation (2) using a Probit model, relying on binary dependent variable taking the value 1 if individuals agree to allow some or many people to immigrate in the country, and 0 if individuals agree to
allow none or a few people to immigrate. Obviously, this variable is built by grouping modalities of our standard openness variable, ie, 3 and 4 (1 in the Probit model) and 1 and 2 (0 in the Probit model).
Insert Table 9
Table 9 presents these alternative estimates. The reported coefficients are marginal effects computed at means. Column (1) presents the results of a standard Probit model, and column (2) displays the estimates of an IV probit based on the same first-stage estimation and instrument than previously. Once again, the endogeneity of the beliefs variable makes the estimations of column (2) more reliable. The results are qualitatively identical to those presented previously. On the quantitative side, the elasticities are roughly equal to one half/two thirds of the ones produced by linear estimations (cf. column (8) in Table 4), confirming the existence of sizeable impacts.
We go one step further by reestimating again equation (2) using non-linear methods, but this time leaving unchanged the four modalities of the openness variable. This asks for the use of the ordered probit methodology.
Insert Table 10
Table 10 reports once again marginal effects computed at means, this time for each of the four modalities of the Openness variable. Results are consistent with the average ones previously presented. There is a clear division between individuals open to no or little immigration and those wanting to allow some or substantial immigration11: the same variables are significant in all groups, but all signs revert from one group (columns (1) and (2)) to the other ((3) and (4)). The only puzzling feature of these results is that marginal effects seem stronger in absolute value for the second modality of our dependent variable (“Allow a few”) than for the first (“Allow none”), when one would have expected the opposite.
6
Conclusion
Using a large cross-country database based on five waves of the European Social Survey for 16 coun-tries, we have studied the impact of media exposure on both beliefs regarding the economic impact of immigration and preferences concerning the immigration levels, taking into account the joint determina-tion of these two variables. Our results stress the important role of the endogenous determinadetermina-tion of the beliefs variable, which appears as a major determinant of policy preferences, along with the traditional socio-economic determinants highlighted by the literature. Otherwise, standard OLS estimates attribute erroneously to other variables a part of the explanatory power of beliefs. Besides, media exposure appear
11
as a key determinant of beliefs: individuals spending more time to get informed on social and political matters through newspapers and radio have a better opinion on the economic impact of immigration, not only relatively to the average individual, but also (and even more) relatively to the individuals which devote time to other types of contents. More positive beliefs seem therefore dependent on information related to political and social matters. Conversely, TV broadcasts on news and politics display a negative impact on openness to immigration. Editorial focuses on more sensasionalist/superficial presentations (on the whole more anxiety-producing), and different abilities to process information among individuals appear as possible explanations.
We also find that education and media exposure interact positively. In particular, it seems that a tertiary degree magnifies the impacts of media exposure. Indeed, more educated people do exhibit a relatively more significant and positive impact of reading (newspapers) or listening (radio) news and political topics; but they also have more negative beliefs when watching TV broadcasts on the same subjects. In other terms, highly educated people who spend relatively more time watching TV tend to believe more to a negative economic impact of immigration. This gives credential to the idea that TV broadcasts focus on other political/social news than the ones displayed in newspapers and radio, or present the same topics in a different way.
This paper contributes to the literature which documents the significant role played by socioeconomic determinants on both beliefs and policy preferences regarding immigration. Our results suggest that parts of the influence of these socioeconomic variables on policy preferences go actually through the beliefs. Together with the importance of media exposure, the present work also points out that both the level of education (as a reflection of individuals’ capacity to process consistently information) and the type of media content are jointly crucial in explaining the shaping of beliefs regarding the economic impact of immigration.
References
Akdenizli, B., E. Dionne, M. Kaplan, T. Rosenstiel and R. Suro, 2008, A Report on the Media and the Immigration Debate, Brookings Institution, Washington.
Benson, R., 2002, The political/literary model of French journalism: Change and continuity in immigra-tion news coverage, 1973-1991, Journal of European Area Studies, 10, 49–70.
Benson, R. and A. C. Saguy, 2005, Constructing social problems in an age of globalization: A French-American comparison, French-American Sociological Review, 70, 233–259.
Borjas, G. J., 2003, The labor demand curve is downward sloping: Reexamining the impact of immigra-tion on the labor market, Quarterly Journal of Economics, 118, 1335 – 1374.
Boswell, C., 2009, Knowledge, legitimation and the politics of risk: The functions of research in public debates on migration, Political Studies, 57, 165–186.
Card, D., 1990, The impact of the Mariel Boatlift on the Miami labor market, Industrial and Labor Relations Review, 43, 245 – 257.
Card, D., C. Dustmann and I. Preston, 2012, Immigration, wages and compositional amenities, Journal of the European Economic Association, 10, 78–119.
Dustmann, C., T. Frattini and C. Halls, 2010, Assessing the fiscal costs and benefits of A8 migration to the UK, Fiscal Studies, 31, 1–41.
Esses, V. M., J. F. Dovidio, L. M. Jackson and T. L. Armstrong, 2001, The immigration dilemma: The role of perceived group competition, ethnic prejudice, and national identity, Journal of Social Issues, 57, 389–412.
Facchini, G., A. M. Mayda and R. Puglisi, 2009, Illegal immigration and media exposure: Evidence on individual attitudes, CEPR Discussion Papers 7593, C.E.P.R. Discussion Papers.
Froot, K. A., 1989, Consistent covariance matrix estimation with cross-sectional dependence and het-eroskedasticity in financial data, Journal of Financial and Quantitative Analysis, 24, 333–355. Hainmueller, J. and M. J. Hiscox, 2007, Educated preferences: Explaining attitudes toward immigration
in Europe, International Organization, 61, 399–442.
Jackson, L. M. and V. M. Esses, 2000, Effects of perceived economic competition on people’s willingness to help empower immigrants, Group Processes & Intergroup Relations, 3, 419–435.
Manacorda, M., A. Manning and J. Wadsworth, 2012, The impact of immigration on the structure of wages: Theory and evidence from Britain, Journal of the European Economic Association, 10, 120– 151.
Mayda, A. M., 2006, Who is against immigration? A cross-country investigation of individual attitudes toward immigrants, Review of Economics and Statistics, 88, 510–530.
Mendelsohn, M. and R. Nadeau, 1996, The magnification and minimization of social cleavages by the broadcast and narrowcast news media, International Journal of Public Opinion Research, 8, 374–389.
Ottaviano, G. I. P. and G. Peri, 2012, Rethinking the effect of immigration on wages, Journal of the European Economic Association, 10, 152 – 197.
Rowthorn, R., 2008, The fiscal impact of immigration on the advanced economies, Oxford Review of Economic Policy, 24, 560–580.
Scheve, K. F. and M. J. Slaughter, 2001, Labor market competition and individual preferences over immigration policy, The Review of Economics and Statistics, 83, 133–145.
Shaw, D. L. and S. E. Martin, 1992, The function of mass media agenda setting, Journalism & Mass Communication Quarterly, 69, 902–920.
Sides, J. and J. Citrin, 2007, European opinion about immigration: The role of identities, interests and information, British Journal of Political Science, 37, 477–504.
Stock, J. H. and M. Yogo, 2005, Testing for weak instruments in linear IV regression, in: D. W. K. Andrews and J. H. Stock (eds.), Identification and Inference for Econometric Models: Essays in Honor of Thomas Rothenberg, Cambridge University Press.
Tsoukala, A., 2002, Le traitement m´ediatique de la criminalit´e ´etrang`ere en europe, D´eviance et Soci´et´e, 26, 61–82.
Table 1: Descriptive statistics, pooled sample
mean sd min max Belief economy 4.94 2.35 0 10 Openness majority 2.79 0.83 1 4 Openness minority 2.55 0.85 1 4 Political left 0.32 0.47 0 1 Age 47.37 17.31 18 100 Women 0.51 0.50 0 1 Primary education 0.32 0.47 0 1 Secondary education 0.41 0.49 0 1 Tertiary education 0.27 0.44 0 1 Large cities 0.30 0.46 0 1 Employed 0.54 0.50 0 1 Unemployed 0.06 0.23 0 1 Inactive 0.40 0.49 0 1 Newspaper: news and politics 0.27 0.36 0 3.5 Radio: news and politics 0.48 0.70 0 3.5 TV: news and politics 0.73 0.62 0 3.5 Newspaper: other 0.22 0.39 0 3.5 Radio: other 0.88 1.08 0 3.5 TV: other 1.23 0.95 0 3.5 Observations 131159
Table 2: Descriptive statistics, mean by year
2002 2004 2006 2008 2010 Belief economy 4.94 4.76 4.96 5.08 4.95 Openness majority 2.77 2.77 2.75 2.83 2.80 Openness minority 2.53 2.51 2.51 2.60 2.58 Political left 0.33 0.33 0.32 0.32 0.31 Age 46.60 46.62 47.76 47.69 48.07 Women 0.51 0.51 0.51 0.51 0.51 Primary education 0.34 0.35 0.31 0.31 0.31 Secondary education 0.41 0.42 0.42 0.39 0.40 Tertiary education 0.25 0.24 0.26 0.30 0.28 Large cities 0.31 0.32 0.30 0.30 0.28 Employed 0.53 0.53 0.55 0.55 0.54 Unemployed 0.06 0.06 0.05 0.05 0.06 Inactive 0.42 0.41 0.40 0.40 0.40 Newspaper: news and politics 0.28 0.27 0.27 0.26 0.24 Radio: news and politics 0.52 0.48 0.48 0.47 0.44 TV: news and politics 0.78 0.73 0.71 0.72 0.69 Newspaper: other 0.24 0.23 0.23 0.22 0.19 Radio: other 0.92 0.91 0.89 0.84 0.85 TV: other 1.22 1.25 1.22 1.21 1.24 Observations 25355 25996 26182 27206 26420
Figure 1: Country means of beliefs and preferences towards immigration BE CH DE DK ES FI FR GB HU IE NL NO PL PT SE SI 2.2 2.4 2.6 2.8 3 3.2
Openness to majority immigration
3.5 4 4.5 5 5.5 6
Table 3: Basic model, exogenous vs. endogenous beliefs OLS OLS IV
(1) (2) (3) (4) Openness Openness Belief econ. Openness Belief economy 0.142a 0.204a
(0.004) (0.012) Political left 0.179a 0.103a 0.562a 0.070a (0.011) (0.007) (0.036) (0.009) Upper secondary education 0.153a 0.092a 0.416a 0.065a (0.011) (0.009) (0.030) (0.011) Tertiary education 0.420a 0.233a 1.216a 0.152a (0.018) (0.014) (0.044) (0.019) Urban 0.066a 0.034a 0.229a 0.019b (0.009) (0.008) (0.033) (0.009) Unemployed -0.088a -0.041a -0.191a -0.020c (0.017) (0.012) (0.054) (0.011) Inactive 0.013c 0.008 0.037c 0.006 (0.007) (0.007) (0.022) (0.007) Immigrant background 0.176a 0.070a 0.689a 0.023 (0.016) (0.012) (0.061) (0.015) Regional unemployment -0.014a -0.006a -0.026a -0.003c (0.002) (0.002) (0.005) (0.002) State of economy -0.229a (0.011) Adj. R-Square 0.132 0.276 0.163 0.248 Kleibergen-Paap F stat 448.9 Observations 131159 131159 131159 131159
Standard errors in parentheses, clustered at the country × year level.
All estimations control for age group and sex, and include country and year dummies. Reference categories for categorical variables: Primary education; Employed; Rural; No immigrant background.
c
Table 4: Role of media exposure
IV IV IV IV
(1) (2) (3) (4) (5) (6) (7) (8)
Belief econ. Openness Belief econ. Openness Belief econ. Openness Belief econ. Openness
Belief economy 0.204a 0.203a 0.203a 0.203a
(0.012) (0.012) (0.012) (0.012)
Political left 0.562a 0.071a 0.545a 0.069a 0.556a 0.070a 0.540a 0.069a
(0.036) (0.009) (0.036) (0.009) (0.035) (0.009) (0.035) (0.009)
Upper secondary education 0.417a 0.066a 0.382a 0.063a 0.385a 0.062a 0.358a 0.060a
(0.030) (0.011) (0.030) (0.011) (0.031) (0.011) (0.031) (0.011) Tertiary education 1.204a 0.149a 1.122a 0.142a 1.130a 0.140a 1.063a 0.135a (0.044) (0.019) (0.045) (0.019) (0.045) (0.018) (0.045) (0.018) Urban 0.231a 0.020b 0.216a 0.019b 0.225a 0.019b 0.212a 0.018c (0.033) (0.009) (0.033) (0.009) (0.033) (0.009) (0.033) (0.009) Unemployed -0.182a -0.018c -0.165a -0.017 -0.123b -0.011 -0.115b -0.011 (0.053) (0.010) (0.051) (0.010) (0.052) (0.010) (0.051) (0.010) Inactive 0.040c 0.006 0.033 0.006 0.065a 0.009 0.058a 0.009 (0.022) (0.007) (0.021) (0.007) (0.022) (0.007) (0.021) (0.007) Immigrant background 0.683a 0.022 0.671a 0.021 0.687a 0.023 0.679a 0.022 (0.062) (0.015) (0.061) (0.015) (0.061) (0.015) (0.060) (0.015) Regional unemployment -0.026a -0.003c -0.025a -0.003c -0.024a -0.003c -0.024a -0.003c (0.005) (0.002) (0.005) (0.002) (0.005) (0.002) (0.005) (0.002)
All media: all content -0.027a -0.007a
(0.009) (0.002)
All media: news and politics 0.104a 0.004b
(0.010) (0.002)
All media: other -0.090a -0.013a
(0.011) (0.003)
Newspaper: all content 0.146a 0.016b
(0.021) (0.007)
Radio: all content 0.000 -0.004c
(0.008) (0.003)
TV: all content -0.135a -0.020a
(0.019) (0.004)
Newspaper: news and politics 0.323a 0.029b
(0.030) (0.012)
Radio: news and politics 0.105a 0.006
(0.025) (0.004)
TV: news and politics -0.026 -0.013b
(0.022) (0.005) Newspaper: other -0.053 0.001 (0.034) (0.008) Radio: other -0.048a -0.009a (0.011) (0.003) TV: other -0.164a -0.022a (0.020) (0.005) State of economy -0.229a -0.228a -0.228a -0.227a (0.011) (0.011) (0.011) (0.011) Adj. R-Square 0.163 0.249 0.169 0.249 0.167 0.250 0.172 0.250 Kleibergen-Paap F stat 451.8 457.3 456.5 457.6 Observations 131159 131159 131159 131159 131159 131159 131159 131159
Standard errors in parentheses, clustered at the country × year level.
All estimations control for age group and sex, and include country and year dummies. Reference categories for categorical variables: Primary education; Employed; Rural; No immigrant background.
Table 5: Role of media exposure, interacted with education
IV
(1) (2)
Belief econ. Openness
Belief economy 0.202a
(0.012) Upper secondary education 0.462a 0.090a
(0.065) (0.019)
Tertiary education 1.363a 0.189a
(0.052) (0.028)
Newspaper: news and politics × Edu 1 0.220a 0.059a
(0.045) (0.017)
Newspaper: news and politics × Edu 2 0.410a 0.016
(0.057) (0.019)
Newspaper: news and politics × Edu 3 0.317a 0.018
(0.042) (0.015)
Radio: news and politics × Edu 1 0.074b 0.006
(0.031) (0.008)
Radio: news and politics × Edu 2 0.073b 0.016b
(0.030) (0.007)
Radio: news and politics × Edu 3 0.187a -0.010
(0.028) (0.010)
TV: news and politics × Edu 1 0.048 -0.010
(0.029) (0.008)
TV: news and politics × Edu 2 -0.022 -0.008
(0.029) (0.008)
TV: news and politics × Edu 3 -0.108a -0.024b
(0.023) (0.010)
Newspaper: other × Edu 1 0.021 0.006
(0.054) (0.012)
Newspaper: other × Edu 2 -0.077c 0.008
(0.044) (0.016)
Newspaper: other × Edu 3 -0.120b -0.022c
(0.057) (0.011)
Radio: other × Edu 1 -0.031b -0.005
(0.015) (0.006)
Radio: other × Edu 2 -0.029c -0.009
(0.017) (0.006)
Radio: other × Edu 3 -0.099a -0.016b
(0.020) (0.007) TV: other × Edu 1 -0.108a -0.014b (0.025) (0.007) TV: other × Edu 2 -0.154a -0.031a (0.026) (0.005) TV: other × Edu 3 -0.264a -0.019b (0.032) (0.010) State of economy -0.227a (0.011) Observations 131159 131159
Standard errors in parentheses, clustered at the country × year level.
All estimations control for age group and sex, and include country and year dummies. Reference categories for categorical variables: Primary education; Employed; Rural; No immigrant background.
Table 6: Role of media exposure, interacted with political orientation
IV
(1) (2)
Belief econ. Openness
Belief economy 0.203a
(0.012)
Political left 0.678a 0.107a
(0.064) (0.021)
Newspaper: news and politics × No Left 0.273a 0.025c
(0.033) (0.015)
Newspaper: news and politics × Left 0.413a 0.035b
(0.046) (0.016)
Radio: news and politics × No Left 0.078a 0.003
(0.023) (0.004)
Radio: news and politics × Left 0.160a 0.013b
(0.035) (0.006)
TV: news and politics × No Left 0.008 -0.003
(0.023) (0.007)
TV: news and politics × Left -0.089a -0.034a
(0.028) (0.012)
Newspaper: other × No Left -0.008 0.000
(0.038) (0.009)
Newspaper: other × Left -0.166a 0.002
(0.053) (0.017)
Radio: other × No Left -0.049a -0.008c
(0.012) (0.004)
Radio: other × Left -0.041a -0.012a
(0.015) (0.005) TV: other × No Left -0.133a -0.017a (0.019) (0.005) TV: other × Left -0.233a -0.033a (0.030) (0.007) State of economy -0.227a (0.011) Observations 131159 131159
Standard errors in parentheses, clustered at the country × year level.
All estimations control for age group and sex, and include country and year dummies. Reference categories for categorical variables: Primary education; Employed; Rural; No immigrant background.
Table 7: Openness to dissimilar immigration, basic model and role of media exposure
OLS OLS IV IV
(1) (2) (3) (4) (5) (6) Openness Openness Belief econ. Openness Belief econ. Openness Belief economy 0.162a 0.198a 0.197a
(0.004) (0.009) (0.009) Political left 0.233a 0.147a 0.562a 0.128a 0.540a 0.126a
(0.012) (0.008) (0.036) (0.009) (0.035) (0.008) Upper secondary education 0.152a 0.082a 0.416a 0.067a 0.358a 0.060a
(0.013) (0.010) (0.030) (0.010) (0.031) (0.010) Tertiary education 0.447a 0.233a 1.216a 0.186a 1.063a 0.165a (0.016) (0.011) (0.044) (0.014) (0.045) (0.014) Urban 0.084a 0.047a 0.229a 0.038a 0.212a 0.037a (0.010) (0.010) (0.033) (0.010) (0.033) (0.010) Unemployed -0.079a -0.025c -0.191a -0.013 -0.115b -0.001 (0.019) (0.013) (0.054) (0.012) (0.051) (0.011) Inactive 0.009 0.003 0.037c 0.002 0.058a 0.006 (0.007) (0.007) (0.022) (0.007) (0.021) (0.007) Immigrant background 0.177a 0.056a 0.689a 0.029a 0.679a 0.027a (0.018) (0.010) (0.061) (0.010) (0.060) (0.010) Regional unemployment -0.013a -0.005a -0.026a -0.003b -0.024a -0.003b (0.002) (0.002) (0.005) (0.002) (0.005) (0.001) Newspaper: news and politics 0.323a 0.027a
(0.030) (0.010) Radio: news and politics 0.105a 0.014a
(0.025) (0.004) TV: news and politics -0.026 -0.010c (0.022) (0.005) Newspaper: other -0.053 -0.018c (0.034) (0.010) Radio: other -0.048a -0.015a (0.011) (0.003) TV: other -0.164a -0.028a (0.020) (0.005) State of economy -0.229a -0.227a (0.011) (0.011) Adj. R-Square 0.146 0.324 0.163 0.316 0.172 0.318 Kleibergen-Paap F stat 448.9 457.6 Observations 131159 131159 131159 131159 131159 131159
Standard errors in parentheses, clustered at the country × year level.
All estimations control for age group and sex, and include country and year dummies. Reference categories for categorical variables: Primary education; Employed; Rural; No immigrant background.
c
T able 8: Role of media exposure, analysis by year (openness to similar immigration) 2002 2004 2006 2008 2010 (1) (2) (3) (4) (5) (6) (7) (8) (9) (10) Belief econ. Openness Belief econ. Openness Belief econ. Openness Belief econ. Openness Belief econ. Openness Belief economy 0.239 a 0.194 a 0.184 a 0.173 a 0.173 a (0.024) (0.025) (0.033) (0.012) (0.011) Political left 0.531 a 0.038 b 0.534 a 0.072 a 0.553 a 0.086 a 0.576 a 0.103 a 0.511 a 0.078 a (0.092) (0.017) (0.072) (0.016) (0.066) (0.026) (0.090) (0.009) (0.063) (0.015) Upper secondary education 0.322 a 0.035 0.332 a 0.076 a 0.302 a 0.055 c 0.409 a 0.082 a 0.397 a 0.096 a (0.027) (0.028) (0.110) (0.011) (0.056) (0.029) (0.038) (0.016) (0.047) (0.012) T ertiary education 0.915 a 0.108 a 1.212 a 0.166 a 0.948 a 0.130 a 1.026 a 0.147 a 1.173 a 0.205 a (0.048) (0.036) (0.085) (0.040) (0.122) (0.045) (0.098) (0.017) (0.069) (0.021) Urban 0.246 a -0.010 0.134 0.055 a 0.263 a 0.007 0.266 a 0.031 0.138 a 0.033 a (0.073) (0.019) (0.111) (0.009) (0.050) (0.016) (0.039) (0.024) (0.030) (0.012) Unemplo yed -0.153 -0.000 -0.138 -0.011 0.011 0.022 c -0.138 -0.077 a -0.120 -0.005 (0.106) (0.022) (0.104) (0.026) (0.094) (0.014) (0.135) (0.017) (0.105) (0.012) Inacti v e 0.078 -0.014 0.079 b 0.007 0.098 b 0.024 0.000 0.000 0.031 0.031 a (0.056) (0.018) (0.035) (0.008) (0.039) (0.016) (0.043) (0.013) (0.054) (0.009) Immigrant background 0.706 a -0.021 0.674 a 0.061 b 0.681 a 0.045 a 0.658 a 0.055 0.665 a 0.019 (0.155) (0.035) (0.088) (0.027) (0.072) (0.013) (0.144) (0.034) (0.165) (0.020) Ne wspaper: ne ws and politics 0.209 b 0.029 c 0.375 a -0.007 0.354 a 0.034 0.296 a 0.070 a 0.421 a 0.038 a (0.072) (0.017) (0.049) (0.039) (0.067) (0.026) (0.041) (0.016) (0.061) (0.013) Radio: ne ws and politics 0.136 0.001 0.090 b 0.020 b 0.120 b 0.016 a 0.044 -0.003 0.143 b -0.001 (0.080) (0.008) (0.036) (0.009) (0.050) (0.006) (0.048) (0.007) (0.051) (0.005) TV : ne ws and politics -0.046 -0.009 -0.056 -0.012 -0.041 -0.025 b 0.019 -0.018 a -0.004 -0.007 (0.057) (0.011) (0.038) (0.012) (0.063) (0.011) (0.031) (0.006) (0.044) (0.015) Ne wspaper: other -0.023 -0.013 -0.147 -0.004 -0.052 0.005 0.006 -0.002 -0.075 0.012 b (0.066) (0.031) (0.093) (0.017) (0.069) (0.014) (0.048) (0.012) (0.061) (0.005) Radio: other -0.041 -0.016 -0.037 a -0.012 c -0.061 -0.015 a -0.026 -0.005 -0.082 a -0.004 (0.026) (0.012) (0.008) (0.007) (0.035) (0.005) (0.017) (0.007) (0.012) (0.004) TV : other -0.187 a -0.024 a -0.143 a -0.020 -0.175 a -0.022 c -0.168 a -0.021 -0.141 a -0.035 a (0.043) (0.008) (0.033) (0.012) (0.041) (0.013) (0.055) (0.013) (0.041) (0.007) Re gional unemplo yment -0.003 -0.000 -0.026 b 0.002 -0.018 a -0.007 b -0.056 a -0.012 a -0.029 a -0.005 c (0.005) (0.005) (0.012) (0.002) (0.005) (0.003) (0.008) (0.004) (0.009) (0.003) State of economy -0.180 a -0.248 a -0.262 a -0.228 a -0.253 a (0.010) (0.023) (0.023) (0.023) (0.015) Observ ations 25355 25355 25996 25996 26182 26182 27206 27206 26420 26420 Standard errors in parentheses, clustered at the country le v el. All estimations control for age group and se x, and include country dummies. Reference cate gories for cate gorical v ariables: Primary education; Emplo yed; Rural; No immigrant background. c p < 0 .10 , bp < 0 .05 , a p < 0 .01
Figure 2: Heterogeneity of the belief coefficient by country HU PL NO ES FR CH SE BE IE FI GB NL SI DK DE PT 0 .1 .2 .3 .4 .5
Figure 3: Heterogeneity of the media coefficients by country
IEHU SI GBDEES NLBEPTPLFR NOCH DKFI SE -.2 0 .2 .4 .6 .8
Newspaper: news and politics
FI SIDENL CHPLBENOHU SEDKES PTGB IE FR -.2 0 .2 .4
Radio: news and politics
FR GBDEHUDKIE NOSE PLNLCHBEFI SI PT ES -.4 -.2 0 .2 .4
TV: news and politics
FR IE GBBE DKNOSISEPL CHPTNLDEESFI HU -.5 0 .5 Newspaper: other DKGB NO BESEFRCH FI NL DEPT SIHUES PLIE -.2 -.1 0 .1 Radio: other DE CHGB BEFRSEIE DK FI NLNO HU ESPLSI PT -.4 -.3 -.2 -.1 0 .1 TV: other
Figure 4: Heterogeneity of the belief coefficient by country and year 0 .2 .4 -.2 0 .2 .4 .1 .2 .3 .4 -.2 0 .2 .4 .6 -.2 0 .2 .4 0 .1 .2 .3 .4 0 .1 .2 .3 .4 .1 .2 .3 .4 -.1 0 .1 .2 .3 -.1 0 .1 .2 .3 .1 .2 .3 .4 -.1 0 .1 .2 .3 -.1 0 .1 .2 .3 0 .5 1 1.5 0 .1 .2 .3 .1 .2 .3 .4 1 2 3 4 5 1 2 3 4 5 1 2 3 4 5 1 2 3 4 5 BE CH DE DK ES FI FR GB HU IE NL NO PL PT SE SI
Table 9: Probit estimations
(1) (2)
Openness - probit Openness - IV probit Belief economy 0.074a 0.110a
(0.002) (0.006) Political left 0.060a 0.040a
(0.005) (0.007) Upper secondary education 0.052a 0.036a
(0.008) (0.008) Tertiary education 0.132a 0.089a (0.011) (0.014) Urban 0.023a 0.015b (0.006) (0.006) Unemployed -0.019b -0.009 (0.009) (0.007) Inactive 0.008 0.006 (0.006) (0.006) Immigrant background 0.028a 0.000 (0.010) (0.011) Regional unemployment -0.003a -0.002 (0.001) (0.001) Newspaper: news and politics 0.032a 0.018b
(0.007) (0.008) Radio: news and politics 0.007b 0.003
(0.003) (0.002) TV: news and politics -0.010a -0.008b (0.004) (0.003) Newspaper: other -0.004 -0.002 (0.005) (0.005) Radio: other -0.007a -0.005b (0.002) (0.002) TV: other -0.017a -0.011a (0.003) (0.003) Observations 131159 131159
Standard errors in parentheses, clustered at the country × year level.
All estimations control for age group and sex, and include country and year dummies. Reference categories for categorical variables: Primary education; Employed; Rural; No immigrant background.
c
Table 10: Ordered probit estimations
(1) (2) (3) (4) Allow none Allow a few Allow some Allow many Belief economy -0.026a -0.081a 0.037a 0.070a
(0.003) (0.004) (0.003) (0.005) Political left (d) -0.010a -0.031a 0.013a 0.027a (0.001) (0.004) (0.002) (0.003) Upper secondary education (d) -0.007a -0.021a 0.009a 0.018a (0.001) (0.005) (0.002) (0.004) Tertiary education (d) -0.016a -0.054a 0.021a 0.050a (0.002) (0.008) (0.003) (0.007) Urban (d) -0.003b -0.009b 0.004b 0.008b (0.001) (0.004) (0.002) (0.003) Unemployed (d) 0.001 0.003 -0.001 -0.002 (0.001) (0.004) (0.002) (0.004) Inactive (d) -0.001 -0.004 0.002 0.004 (0.001) (0.003) (0.001) (0.003) Immigrant background (d) -0.003c -0.011c 0.005c 0.009c (0.002) (0.006) (0.003) (0.005) Regional unemployment 0.000c 0.001c -0.001c -0.001c (0.000) (0.001) (0.000) (0.001) Newspaper: news and politics -0.004b -0.012b 0.006b 0.010b
(0.002) (0.005) (0.002) (0.004) Radio: news and politics -0.001 -0.003 0.001 0.002
(0.001) (0.002) (0.001) (0.001) TV: news and politics 0.002a 0.006a -0.003a -0.005a (0.001) (0.002) (0.001) (0.002) Newspaper: other -0.000 -0.000 0.000 0.000 (0.001) (0.003) (0.002) (0.003) Radio: other 0.001a 0.004a -0.002a -0.003a (0.000) (0.001) (0.001) (0.001) TV: other 0.003a 0.010a -0.005a -0.008a (0.001) (0.002) (0.001) (0.002) Observations 131159 131159 131159 131159
Standard errors in parentheses, clustered at the country × year level.
All estimations control for age group and sex, and include country and year dummies. Reference categories for categorical variables: Primary education; Employed; Rural; No immigrant background.