Justin Revenaugh3 , Douglas A. Wiens4 , Fiona A. Darbyshire5 , Seth Stein1 , Michael E. Wysession3 , and Donna Jurdy1
1Department of Earth and Planetary Sciences, Northwestern University, Evanston, IL, USA,2Department of Geological
Sciences, University of Manitoba, Winnipeg, Manitoba, Canada,3Department of Earth Sciences, University of
Minnesota, Twin Cities, Minneapolis, MN, USA,4Department of Earth and Planetary Sciences, Washington University, St. Louis, MO, USA,5Centre de recherche GEOTOP, Université du Québec à Montréal, Montreal, Quebec, Canada
Abstract
The remains of the 1.1-Ga Midcontinent Rift (MCR) lie in the middle of the tectonically stable portion of North America. Previous and ongoing studies have imaged strong heterogeneity associated with the MCR in the crust but have not imaged such within the mantle. It is unclear whether this is due to the absence of rift-related mantle structures or these studies had insufficient resolution to image them. To address this issue, we measured 46,374 teleseismic P wave delay times from seismograms recorded by the USArray Transportable Array, Superior Province Rifting EarthScope Experiment, and surrounding permanent stations. We included these and 54,866 delay times from prior studies in our tomographic inversion. We find that high-velocity anomalies are widespread in our study area, but there are also prominent low-velocity anomalies. Two of these are coincident with high-Bouguer gravity anomalies associated with the MCR in Iowa and the Minnesota/Wisconsin border at 50- to 150-km depth. Extensive resolution testing shows that these anomalies could be the result of downward vertical smearing of relatively low velocities from rift-related material that “underplated" the crust, although we cannot exclude that the subcrustal mantle lithosphere beneath the MCR is anomalously enriched, hydrated, or warm. Other anomalies occur at syntaxes of the Penokean Orogen. One with the Superior Province and Marshfield Terrane in southern Minnesota and another with the Yavapai and Mazatzal Terranes, both at 100- to 250-km depth. In the midmantle, we image two linear high-velocity anomalies, interpreted as subducted fragments of the Farallon and Kula plates.1. Introduction
The remnants of the Midcontinent Rift (MCR), including both igneous material emplaced during rifting and associated rift basins that were filled in and covered by Mesoproterozoic and younger sediments (Miller et al., 2013; Van Schmus, 1992), lie in a tectonically inactive portion of the North American continent. When the rift initiated at 1.1 Gyr, the core of Laurentia had already been formed ∼900 My earlier through a series of Paleoproterozoic collisions between Archean cratons (Bleeker, 2003). The rift system was active for over 20 My, during which time a large amount of volcanic material was episodically emplaced into the crust from the Nipigon Embayment, north of Lake Superior to Kansas in the south (Ojakangas et al., 2001). The most prominent positive Bouguer gravity anomaly in North America is due to the high density of the volcanic material and its current shallow depth of burial (Figure 1) in the midcontinent.
The amalgamation of North America left many sutures and shear zones as a reminder of the turbulent his-tory of the continent's formation. These sutures are more easily reactivated during rifting than the creation of new rift margins, especially through cratonic material. This has been seen in the opening and closing of repeatedly rifted ocean basins such as the Atlantic (Buiter & Torsvik, 2014). A discriminating feature of the MCR is that it does not consistently follow these weakened zones as expected for a passive rift but also crosscuts them in a seemingly random manner (Ojakangas et al., 2001; Van Schmus & Hinze, 1985). Since the formation of the MCR, no major tectonic events have affected the midcontinent of North America. The crustal portion of the failed rift has since been covered by Mesoproterozoic sediments (Ojakangas & Dickas, 2002; Ojakangas et al., 2001; Van Schmus & Hinze, 1985).
• Seismic delay times around the Midcontinent Rift are consistent with known anomalies directly below the crust
• The mantle beneath the Midcontinent Rift did not retain structures related to rifting during the Proterozoic
• Shallow low-velocity anomalies at syntaxes of the Penokean orogen coincide with low electrical conductivity anomalies Supporting Information: • Supporting Information S1 Correspondence to: T. A. Bollmann, trevor@earth.northwestern.edu Citation:
Bollmann, T. A., van der Lee, S., Frederiksen, A., Wolin, E., Revenaugh, J. S., Wiens, D., et al. (2019). P wave teleseismic traveltime tomography of the North American midcontinent. Journal of Geophysical
Research: Solid Earth, 124, 1725–1742. https://doi.org/10.1029/2018JB016627
Received 5 SEP 2018 Accepted 12 JAN 2019
Accepted article online 17 JAN 2019 Published online 8 FEB 2019
©2019. American Geophysical Union. All Rights Reserved.
Figure 1. (a) The Bouguer gravity anomaly of North America from the Decade of North American Geology 6-km
spacing gravity grid (Tanner et al., 1988). The study region is shown by the box. (b) Map of the terranes/provinces of the region from Whitmeyer and Karlstrom (2007). (c) Seismic stations used in this study. Green circles are stations from the SPREE network, red are USArray Transportable Array stations, orange are permanent stations in the Global Seismic Network or United States National Seismic Network, blue are Canadian National Seismograph Network, University of Manitoba, Polaris Ontario, or Fednor stations, and purple are stations from the pre-EarthScope TW∼ST, FLED, or APT-89 experiments. Station symbols are sized by the number of measurements at each station.
Previous continental-scale tomographic studies that include this region image a fairly homogeneous upper mantle structure beneath the MCR (Bedle & van der Lee, 2009; Grand, 1994; van der Lee & Frederiksen, 2005; van der Lee & Nolet, 1997). This could be due to 1.1 Gy of mantle cooling, plate movement, and a limited role of the lithosphere during rifting or due to limits in resolving power, controlled by the dis-tribution and operational periods of the seismic stations used. Frederiksen, Bollmann, et al. (2013) used teleseismic P wave tomography to investigate the lithosphere beneath the southwestern edge of the Supe-rior Province. However, like the larger-scale tomographic studies (Bedle & van der Lee, 2009; Schmandt & Lin, 2014; Sigloch & Mihalynuk, 2013; Simmons et al., 2010; van der Lee & Frederiksen, 2005; van der Lee & Nolet, 1997), the data used had little resolving power for structures at the scale of the MCR. Other recent tomographic studies of seismic surface waves and seismic noise recorded by the 75-km spaced Trans-portable Array do show crustal structures in the shape of the MCR (Pollitz & Mooney, 2014; Shen et al., 2013) but have insufficient depth resolution to say whether the mantle retains evidence of the rifting. Here we define our study area so that the MCR, overlain by the more densely spaced stations of the SPREE project
power of our model to the level of being able to image rift structures within the MCR.
2. Geologic Background
The Superior region consists of numerous terranes that were accreted to the margins of the Superior Province (Figure 1) during its formation in the Proterozoic (Bleeker, 2003; Hoffman, 1988; Whitmeyer & Karlstrom, 2007). The Superior Province, which formed at 2.7 Gyr (Bleeker, 2003), is the largest and oldest province in this region and forms the core of the eastern Canadian Shield. On the western and northern border of the Superior is the Trans-Hudson Orogen, which affixed the Superior Province to other Archean crustal blocks during the assembly of Laurentia beginning at around 1.9 Gyr (Hoffman, 1988).
Directly to the south of the Superior Province are the Penokean Orogen and the Marshfield Terrane (Figure 1b). The former is an oceanic arc terrane, while the latter is a small piece of Archean crust that collided with the southern margin of the Penokean Orogen in a northwesterly direction (Schneider et al., 2002). Their emplacement may have been guided by offsets, from a prior rifting event, in the southern mar-gin of the Superior Province (Chandler et al., 2007; Schulz & Cannon, 2007), at least partially resulting in the arcuate shape of the province at its western syntaxis. South of here, the Yavapai and Mazatzal Provinces were accreted on a NE-SW margin. These terranes are a combination of juvenile crust from the Yavapai and Mazatzal orogenic events and are only differentiated by their Nd model ages, being 1.8–1.7 and 1.7–1.6 Gyr, respectively (Bowring & Karlstrom, 1990; Karlstrom & Humphreys, 1998; Shaw & Karlstrom, 1999). After a roughly 50-My tectonic lull, the Granite-Rhyolite Province was added to the southern margin during the following 150 My (Bowring & Karlstrom, 1990). During the accretion of the Granite-Rhyolite Province, extensive granitoid bodies were emplaced within the Granite-Rhyolite Province and, to a lesser extent, the older terranes to the northwest (Karlstrom & Humphreys, 1998; Van Schmus et al., 1996).
The cause of initial rifting is unclear but associated with the MCR are ∼2 million km3(Cannon, 1992) of 1.1-Gyr basalts distributed over a 1,000-km-long linear feature (Ojakangas et al., 2001; Van Schmus & Hinze, 1985). These iron-rich basalts are the source of the largest positive gravity anomaly in North America due to their volume, density, and proximity to the surface (Hinze et al., 1992). In the U.S. portion of the rift, the associated volcanics follow a linear path along the axis of the rift although in Canada the volcanics cover a wider area in the form of sills and flood basalts in the Nipigon Embayment and other locales along the north shore of Lake Superior (Hollings et al., 2007). The MCR's volcanic rocks show a strong iron enrichment over time (Ojakangas et al., 2001). Some of the later, most iron-rich magma may have remained in the previously depleted lithosphere. This could have been related to an underplated layer as observed by Zhang et al. (2016). The MCR crosscuts all of the above mentioned terranes, from the Superior Province southward, with the exception of the Granite-Rhyolite Province, which is too far to the south and east. Another aspect of the MCR is the path it took cutting through these provinces without following the known shear or collision zones along which the provinces were accreted (Klasner et al., 1982). Instead, as rifting of Laurentia began, it cleaved through these provinces in a fairly linear fashion. Some basaltic lava flows were deposited subaque-ously along with siltstones and shales of the Nonesuch formation, likely deposited in a series of lakes or a shallow sea (Anderson & McKay, 1997; Ojakangas et al., 2001). After rifting ceased, south of Lake Superior, the two sides of the rift were thrust back toward each other during 1060–1045 Myr (Cannon, 1994; Cannon et al., 1989; Zhang et al., 2016).
3. Data and Methods
3.1. Instrumentation
The ∼3.2 million-km2study area of this paper was covered by a number of different seismic networks. The greatest number of stations belong to the USArray Transportable Array (TA) (Meltzer et al., 1999), which cov-ered the southern half of the study area with stations spaced approximately 75 km apart. The U.S. National Seismic Network (Masse et al., 1989), Global Seismic Network (Butler et al., 2004), and the Florida to Edmon-ton Array (FLED) (French et al., 2009) added 42 stations to the station coverage that the TA provided. The Canadian portion of the study area was covered by a combination of the digital Canadian National Seis-mograph Network (North & Basham, 1993); POLARIS (Eaton et al., 2005), University of Manitoba; and the temporary deployments FedNor (Darbyshire et al., 2007), TW∼ST (Kay et al., 1999), and APT89 (Silver & Kaneshima, 1993).
With the movement of the TA through the Midwest, there was complete coverage of the U.S. portion of the study area and the southernmost portion of Ontario for the first time. This was a vast improvement over Frederiksen, Bollmann, et al. (2013), in which the TA had only reached the Minnesota-Wisconsin border. Another major improvement in our ability to image structures on the scale of the MCR was the station coverage provided by the Superior Province Rifting EarthScope Experiment (SPREE) array. SPREE was an 82-station deployment of the EarthScope Flexible Array instrumentation in the United States and Canada (Wolin et al., 2015). Its 16 Canadian stations extended the ambient coverage that the TA provided northward, while the U.S. portion of SPREE constitutes 66 closely spaced stations (∼13-km spacing on average) along and across the MCR (Figure 1c; Wolin et al., 2015). Positioning the U.S. stations in these lines, two crossing at relatively strong and weak gravity highs, respectively, and one following the rift axis of the MCR in Wisconsin and Minnesota, allows us to resolve small structures in the lithosphere and upper mantle related to the rift. Together these make up 206 new stations for which we measured teleseismic delay times for 255 earthquakes spanning a 2.5-year period from 16 April 2011 to 1 November 2013. We also include the delay measurements used by Frederiksen, Bollmann, et al. (2013) and delay times from FLED stations (French et al., 2009; Lou & van der Lee, 2014) within the study region. With this inclusion, we invert all available delay times for the study area from 8 June 1989 to 1 November 2013. This results in nearly double the number of delay times used in previous studies and much improved station coverage.
3.2. Traveltimes
Delay times of P wave first arrivals were measured in vertical component seismograms of teleseismic events at all stations within the study area recording the event. Data were downloaded and preprocessed using the Standing Order for Data (Owens et al., 2004). Standing Order for Data used the instrument response to convert seismograms to ground velocity records and applied a band-pass filter from 0.01 to 6 Hz.
The traveltimes were measured using the multichannel cross-correlation method of VanDecar and Crosson (1990) as implemented in the AIMBAT traveltime picking tool (Lou et al., 2013). This method yields absolute and relative traveltimes. The observed relative traveltime for event i and station j is
ti𝑗=Ti𝑗−Ti (1)
where Tijis the true absolute traveltime and Tiis the average of all traveltimes for the ith event. The observed relative delay times were then compared to the predictions from the model iasp91 (Kennett & Engdahl, 1991) by subtracting the iasp91 predicted traveltimes, TIASP91
i𝑗 , from the observed times as shown in equation (2).
𝛿ti𝑗=ti𝑗−Ti𝑗IASP91+T IASP91
i (2)
The residuals𝛿tijhave a zero event mean and are easily compared from event to event.
Relative delay times from a total of 255 earthquakes between 16 April 2011 and 31 October 2013 (of mag-nitude 5.5 and greater, 30–93◦from the center of the study area) were picked at 364 stations for a total of 45,006 new traveltime picks. These were added to relative delay time picks for events from the previously mentioned studies for a total of 101,233 traveltime picks (Figure 1c) for 1,720 events (Figure 2) and 460 sta-tions. At 1,205 measurements, the Canadian National Seismograph Network station ULM, in Lac du Bonnet, Manitoba, yields the most traveltimes. All delay times were corrected for topography and the ellipticity of the Earth.
3.3. Rift-Related Delay Times
We grouped delay times from stations on the rift (as identified by the Bouguer gravity high) and compared them to delay times from stations away from the rift (Figure 3). Stations in between these two domains, on the sedimentary flanks (and Bouguer gravity lows), were not included in either group in order to enhance their contrast. The standard deviations of both groups of relative delay times are similar to the standard devi-ation of all relative delays of 0.4 s. The mean delay time of the on-rift group is roughly 0.05 s later than that of the away-from-rift group (with a mean relative delay around 0 s), and the difference between the mean delay times of the two groups is approximately an order of magnitude smaller than the groups' standard devia-tions, which are similar to the standard deviation of the distribution of all relative delays in this study. This 0.05-s difference in magnitude is consistent with what one would expect from an underplated layer found along the rift by Zhang et al. (2016). The standard deviation of our relative delay times from equation (2) is 0.4 s. This is less than the standard deviation of relative delay times of 0.5 s measured for the Kenya rift
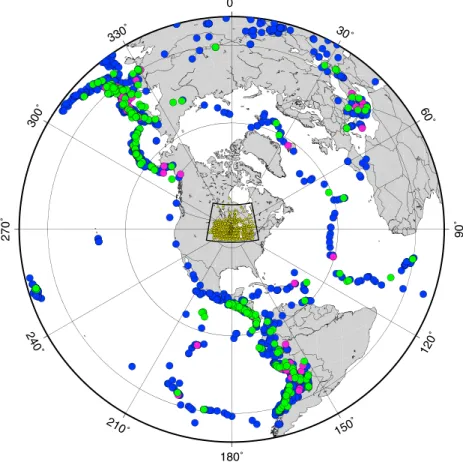
30˚ 60˚ 90˚ 120˚ 150˚ 180˚ 210˚ 240˚ 270˚ 300˚ 330˚
Figure 2. The 1,721 events used in this study. Green circles are new events, blue circles are events also used in
Frederiksen, Bollmann, et al. (2013, 2007), and purple circles are events recorded by the FLED array (French et al., 2009). Yellow triangles indicate locations of seismic stations used in this study. The box around the stations is the study region.
(Park & Nyblade, 2006) and the Ethiopian hot spot (Bastow et al., 2008), which are active segments of the East African rift. Both these studies have similar post imaging residual-delay distributions as our study does, but started from a wider distribution, suggesting that 1 billion years of postrift stability experienced by the MCR likely had a reducing effect on heterogeneity.
4. Tomographic Model
4.1. Basis
In our inversion, the traveltime (tij) consists of components for the event term (ei), station term (sj), and path component (pij) (VanDecar, 1991)
ti𝑗=ei+s𝑗+pi𝑗 (3)
The event term consists of four components and corrects for structure on the source side as well as source mislocations and origin time errors, the station term corrects for station side structure including crustal structure and site response, and the path component represents the contribution of 3-D structure along the raypath. Since we use teleseismic events, the incidence angles of the paths in the crust vary between 48◦ and 24◦from vertical, and primary crustal structure is absorbed by the station term sj. Similarly, source side structure is considered to be the same for all measurements tijfor event i because the raypaths near the source are similar due to the source-receiver distance being much greater than the aperture of the array. A number of ray crossings in the upper and middle mantle are expected (supporting information Figures S1 and S2), with the densest regions being beneath the U.S. portion of the SPREE network. The model base is at a depth of 1,500 km. Laterally, the model grid extends roughly 1.5◦on all sides outside the footprint of the array.
Figure 3. (a) Map of stations with new delay times separated by whether they are within the positive Bouguer
anomaly, the negative Bouguer anomaly, or outside the rift completely. (b) Frequency-percent histogram of delay time measurements away from the rift. (c) Frequency-percent histogram of delay time measurements from on the rift.
4.2. Inversion Parameters
We use the method of VanDecar (1991) to perform a tomographic inversion for P velocity. The model is parameterized in terms of deviations from iasp91 P wave velocities on a set of splines under tension. This allows for smooth interpolation between the nodes of the grid, shown in Figure 4, which also illustrates that our model extent is identical to that of Frederiksen, Bollmann, et al. (2013). Due to the dense spacing and therefore greater resolving power of the SPREE stations in the center of the model, the horizontal knot spacing was decreased to 0.15◦in latitude and longitude (∼17 and ∼12 km at 45◦N, respectively) in the central portion of the model space, whereas the surrounding knots have a spacing of 0.25◦(∼28 km) in latitude and 0.33◦(∼29 km at 45◦N) in longitude. At the edges of the model the knot spacing was widened to 0.66◦then 1.0◦in longitude and 0.5◦then 1.0◦in latitude. Vertical knot spacing is 25 km in the uppermost 200 km, increasing to 33 km from 200- to 700-km depth, 50 km from 700 to 800 km, and 100 km from 800 km to the base of the model at 1,500 km. This brings the total grid knots in the model to 286,638.
Additional unknowns in the inversion are 460 station terms and 4 × 1,721 event terms. Combining these terms with the grid nodes results in an inverse problem with 293,982 unknowns that is there-fore mixed determined, meaning some nodes are overdetermined while undersampled nodes are strongly underdetermined.
Figure 4. The model grid used in the inversion. Grid knots are located at the intersections of the white lines. Between
the knots, the model is interpolated according to VanDecar (1991). The center of the model is densified to take advantage of the increased density of stations, which are shown by black squares.
4.3. Regularization
Since the inverse problem has a strongly underdetermined portion, the recovered model will be very depen-dent upon the nature and strength of the regularization used. We applied a smoothing regularization (minimizing model curvature) to the model in order to favor long-wavelength structure in the final model. Small amounts of flattening (slope minimization) and damping (minimization of deviation from iasp91) were also included. We also damped the event location perturbations and station time corrections, while event time corrections were left undamped to compensate for the relative nature of the time picks. The level of smoothing was chosen using the“L-curve” method, in which the model roughness is plot-ted against data misfit for a number of different smoothing levels (Parker, 1994). The appropriate level of smoothing is determined by selecting a level at which a reasonable misfit is found, and features in the out-put model are deemed geologically feasible. Below this point represents a level of regularization where noise instead of data is being fit. The smoothing level we selected reduced the root mean square misfit from 0.40 to 0.03 s, which is comparable to the remaining misfit found for tomographic studies of the East African rift (Bastow et al., 2008; Park & Nyblade, 2006). Our data are thus fit to similar noise levels.
One of the most striking features of Figures 5 and 6 is that the station terms of the pre-EarthScope temporary networks (APT-89, TW∼ST, and FLED) do not match the sign or magnitude of the stations nearest to them. This phenomenon is most likely due to those experiments being conducted at a time that did not overlap with other stations. Therefore, the traveltimes for those stations were measured with respect to a different effective baseline. This difference in baseline is visible in Figure 5 and not in the tomographic anomalies in Figure 6, so it thus has been absorbed by the station term calculation. Other noticeable features in the station terms are that the largest negative terms of ∼ − 0.8 s occur in the Canadian Shield stations to the north, whereas the largest positive station terms of ∼0.75 s occur in the central portion of the Williston Basin in the western Dakotas (∼47◦N, ∼103◦W). These features align with the regions of the least and most sediment or rock younger than Precambrian, respectively. The large negative signature is due to the Canadian Shield having a higher velocity than the crust to the south, and the large positive signature is due to the thick stack of sediments in the Williston Basin having a lower velocity than the surrounding regions, which are not deep sedimentary basins.
Figure 5. Station statics calculated during the inversion. Station symbols are sized by the number of measurements
taken at each station.
4.4. Model Features
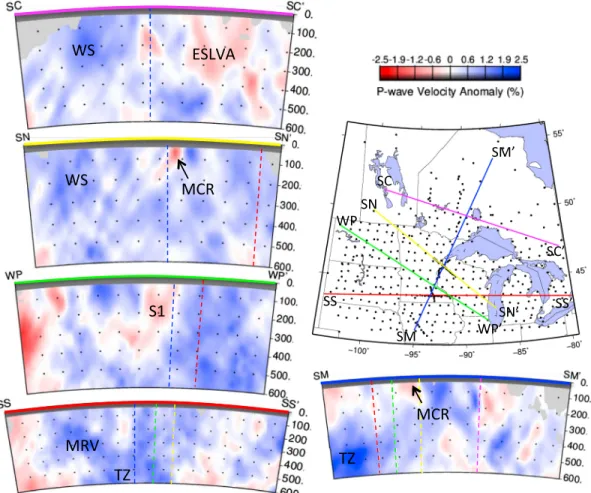
A series of plan sections taken through the final model are shown in Figure 6. The largest lithospheric anomaly in our model is a high-velocity region labeled Western Superior (WS) in Figure 6c. The eastern border of WS is well resolved, running roughly parallel to the 90◦W meridian and the WS velocity anomaly is at least 300 km thick (Figure 7). Its northwestern border is poorly resolved due to a lack of stations in that region. To the east of WS, a low-velocity region labeled Eastern Superior Low-Velocity Anomaly is located in the lithosphere and continues throughout the upper mantle. On the western edge of Eastern Superior Low-Velocity Anomaly there is a portion of the anomaly that underlies the Lake Nipigon Embayment. Another striking feature is a pair of low-velocity anomalies labeled MCR. They are located between 50 and 150 km in depth and follow the rift at the locations of the highest gravity anomalies. Other features include a high-velocity region located around 400 km deep, labeled Transition Zone (TZ); two deep linear features labeled Farallon Slab and Kula Slab at depths of 1,000 and 1,200 km, respectively; a high-velocity zone at a depth of 200 km to the northwest of TZ, labeled Minnesota River Valley (MRV); and two low-velocity zones located at the syntaxes of the Penokean Orogen that extend from 100 to 250 km in depth, labeled Syntaxis 1 and 2 (S1 and S2).
4.5. Resolution Tests
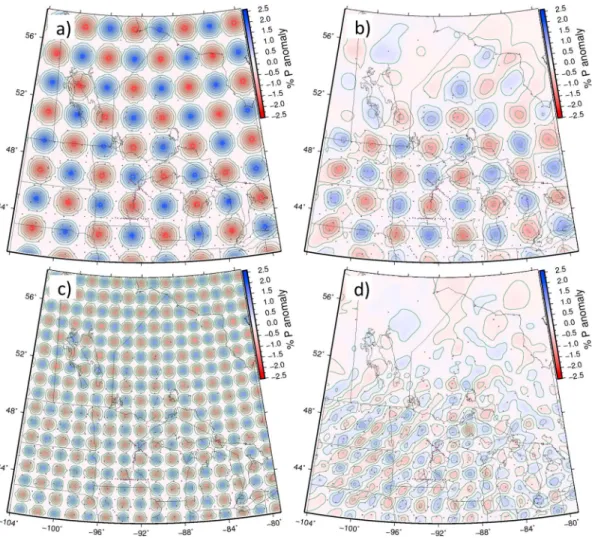
To assess the resolving power of our data set, we computed synthetic data from theoretical models. These synthetic data were then inverted to reveal what sizes of structures could be resolved in different regions of the model, and the manner in which the input structures are smeared along the teleseismic raypaths. One set of hypothetical models consists of a number of three-dimensional “checkerboards” (Figure 8). These consist of alternating polarity Gaussian anomalies whose amplitudes reach ±2% of the background velocity. We created these tests for two different 3-D spacings, 100 and 200 km. Random noise with a standard deviation of 60 ms was also added to the computed data for all forward models to mimic the noise that occurs in real measurements.
Figure 8b shows that 200-km-scale structures in the study region are easily resolved, although 100-km struc-tures in the western portion of the model become somewhat smeared in the southwest-northeast direction (Figure 8d). Reduced resolving power is also found for smaller structures beneath the eastern half of Lake Superior, which has fewer crossing raypaths than the west side of the lake.
Checkerboard resolution tests determine if small features can be detected by the model but can also mask the effects of smearing. Resolution tests with synthetic structures similar to features seen in the model were carried out to address this problem (Figure 9). Synthetic structural resolution tests illustrate which features
Figure 6. Plan sections through the final model. MCR = Midcontinent Rift; WS = Western Superior; ESLVA = Eastern
Superior Low-Velocity Anomaly; MRV = Minnesota River Valley; S1/S2 = Syntaxis Anomalies; TZ = Transition Zone; FS = Farallon Slab; KS = Kula Slab: (a) includes the outline of the MCR gravity anomaly (dark red line), (b) includes station residuals calculated during the inversion, and (c) includes terrane boundaries from Whitmeyer and Karlstrom (2007, solid black lines) and the surface expression of the Great Lakes Tectonic Zone, modeled after Holm et al., 2007 (2007, dashed line). Small black dots in sections are seismic stations.
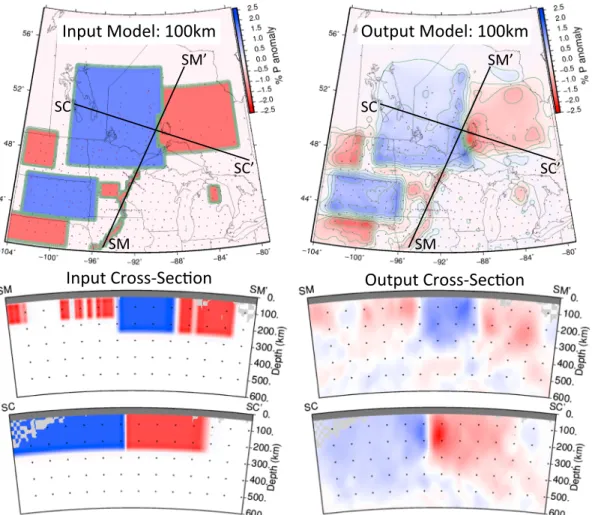
can be resolved, assess the role of smearing, and evaluate the tendency of our smoothing-dominated inverse process to evenly distribute structural anomalies even when delays can be caused by isolated anomalies. Features were assigned velocity anomalies of ±1.5% and thicknesses of 250 km. Features S1, S2, and the MCR were assigned a thickness of 100 km and are situated in the lower lithosphere from 100 to 200 km in depth to mimic the structure seen in the final model. The plan section in Figure 9 shows that the data are capable of resolving sharp lateral boundaries of the input structures and can even discern the shape of the narrow feature modeled after the MCR gravity anomaly. There is minimal lateral smearing with the exception of regions that have little-to-no station coverage. Because relative traveltimes are inverted, the centers of large anomalies appear weaker in the output model than in the input model. This is because the relative delay between two stations that pass through nearly identical anomalies would be very small or zero, whereas stations that cross a boundary between anomalies have a large relative delay. Absolute delay times would do a better job of preserving the amplitude in the features' centers but are not used in this study. Another reason for the lessened amplitude of the output model is due to the damping regularization that is necessary for the numerical stability of the inversion in combination with the relative delay times used. These factors combine to create a model that is relatively insensitive to large wavelength features and is more sensitive to abrupt changes in velocity and therefore Earth structure.
The structural test is especially effective in showing the degree of vertical smearing to expect in the final model caused by the nearly vertical nature of the teleseismic rays. The cross sections in Figure 9 show that vertical smearing is a major feature of the output model and the depths to which features are smeared depend on raypath coverage. In cross-section SC-SC′the large features are consistently smeared down to a depth of 400–450 km with some regions smearing farther, whereas in cross-section SM-SM′the features are smeared to a depth of 350–400 km. The difference in station coverage and raypath density in the areas of cross-section SM-SM′ and SC-SC′corroborates this theory, with the majority of SM-SM′having a higher station density than SC-SC′(supporting information Figure S1). When comparing the depth that features in the final model reach with those same features in the synthetic model, it is apparent that the features are most likely confined
Figure 7. Cross sections through the final model to a depth of 600 km. Dashed lines on the cross sections are
intersection points of cross sections and match the color of the section lines on the map view. Labeled features in cross sections are the same as in Figure 6. WS = Western Superior; ESLVA = Eastern Superior Low-Velocity Anomaly; MCR = Midcontinent Rift; MRV = Minnesota River Valley; S1/S2 = Syntaxis Anomalies; TZ = Transition Zone.
to the lithosphere which has a thickness of approximately 200–250 km (Darbyshire et al., 2007; Goes & van der Lee, 2002; van der Lee & Nolet, 1997). The large amplitudes of the anomalies are also not being smeared down to the location of feature TZ, so it is unlikely that it is a smearing artifact.
5. Discussion
5.1. Depth Controls on the MCR Low-Velocity Anomaly
Near the southern tip of Lake Superior and in Central Iowa, we see two low-velocity anomalies (labeled MCR in Figures 6 and 7) that coincide with the highest Bouguer gravity anomalies associated with the rift in those areas (Figure 10). Resolution tests show that the shapes of the features are reasonably well resolved, especially under the footprint of SPREE where the amplitude of the anomaly is also better preserved (Figure 9).
Since teleseismic tomography tends to smear anomalies vertically along lithospheric segments of raypaths, it is necessary to conduct more than one resolution test of geologically feasible scenarios in order to assess the resolving power for depth and depth extent of the anomalies. One test scenario was modeled after the discoveries of MCR underplating by Behrendt et al. (1990) and Zhang et al. (2016). The receiver function analysis by Zhang et al. (2016) of all SPREE receiver functions revealed a complex crustal structure beneath the MCR that is remarkably consistent along the axial gravity high of the MCR. Together with the results and interpretation of Behrendt et al. (1990), these SPREE findings on crustal structure provide a strong interpretation framework for inconclusive results from receiver function studies for a handful of individual stations on the MCR's gravity high (French et al., 2009; Moidaki et al., 2013; Shen et al., 2013). At first glance, receiver functions produce sharp peaks for Moho conversions away from the gravity high, but these peaks are
Figure 8. Selected checkerboard resolution tests. (a) Coarse input at 200-km depth. (b) Coarse output at 200-km depth.
(c) Fine input at 266-km depth. (d) Fine output at 266-km depth.
weaker, broader, and less consistent for Moho conversions beneath the gravity high. A closer inspection of the individual receiver functions showed that seismic waves from different azimuths produce weak positive conversions from two different discontinuities, one above and one below the regional Moho depth (Zhang et al., 2016). The distance between these weaker discontinuities decreases with increasing distance from the rift axis, and the intermediate impedance material between the two discontinuities is interpreted as “under-plated,” following Behrendt et al. (1990) and dozens of additional publications of crustal structure of the MCR beneath Lake Superior. Zhang et al. (2016) infer that the underplated “layer” is located at 30–50 km in depth and extends axially along the segment of the MCR between Lake Superior and Iowa and likely beyond (supporting information Figure S11). A second test scenario is an identically shaped low-velocity anomaly but residing in the upper mantle lithosphere at depths of 100–120 km (supporting information Figure S12). These scenarios were then compared to the MCR resolution test with a low-velocity anomaly of 100-km thickness (Figure 11). A side-by-side comparison of the final tomographic model and the three scenarios (supporting information Figure S13) shows subtle differences between these resolution tests. Supporting information Figure S13 shows that if there is a substantial mantle signature of the rift, our data would “see” it. However, our model shows weak intermittent structures, similar in character to the tests shown in sup-porting information Figures S11 and S12, suggesting that rift-related anomalies are relatively thin but that their depths cannot be uniquely established. We thus conclude that the MCR anomaly seen in our tomo-graphic model could either be caused by smearing of a crustal underplating associated with the rift or from a structure in the upper mantle lithosphere. We know from Zhang et al. (2016) that a slowing underplated layer exists along the entire rift segment covered by SPREE stations, and its modeled effects on P velocity
Figure 9. Structural resolution test to quantify the amount of lateral and downward smearing of features similar to
those seen in the final model. Cross-section locations are the same as in Figure 7.
delay times are of the same order of magnitude as the difference between mean delay times measured on and away from the rift (Figure 3).
5.2. MCR
With the MCR forming at 1.1 Gyr, the large thermal signature that comes with magmatic intrusion has long since faded (Turcotte & Schubert, 2014). However, the basalts of the MCR are enriched in iron, with later basalts richer than earlier ones (Ojakangas et al., 2001). Moreover, these basalts were not devoid of volatiles (Hollings et al., 2007, 2012, 2010). If these volatiles and iron were extracted from the deeper litho-sphere, it would have increased the seismic velocity of the cooled lithosphere rather than decreased it. If the extraction depth was sublithospheric, the depletion and an associated stiffening would have thickened the high-velocity lithosphere (Goes & van der Lee, 2002; van der Lee & Wiens, 2006). Contrary to these expecta-tions, we observe low-velocity anomalies beneath the MCR. To explain the absence of high-velocity, depleted mantle beneath the rift, we propose that the source of the deposited basalts was located deep beneath the lithosphere and is no longer geographically connected or the surrounding lithosphere is equally depleted from prior melting events.
Wave paths through the mantle lithosphere beneath the Lake Superior portion of the MCR do not need to cross through the rift- and Lake-centered underplated layer before being recorded at stations sur-rounding the Lake and underlying rift structure. In agreement with this geometry and with inferences made by Yang et al. (2015) of electrical conductivity of the lithosphere in the SPREE study region, our seismic-tomographic model's velocities beneath the western portion of the lake indeed look similar to those of the WS high-velocity anomaly, away from the MCR. According to resolution tests (Figures 8 and 9), there
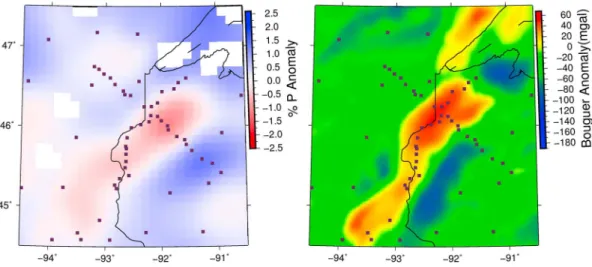
Figure 10. Zoomed in map of the northern Midcontinent Rift velocity anomaly at 50 km (left) and Bouguer gravity
anomaly (right) to show similarity in anomaly shape. Black squares are seismic stations.
is no significant lateral smearing in the western half and vertical smearing is similar to other places within the model. However, if there were a lithospheric anomaly, it would be resolved (Figure 11).
The previous study (Frederiksen, Bollmann, et al., 2013) had limited raypaths beneath Lake Superior, but the Canadian SPREE stations add crossing rays that address this issue. Data associated with these ray-paths confirm that the low-velocity anomaly beneath Lake Nipigon is not connected to the low-velocity anomaly associated with the main arm of the MCR but that it is actually connected to the Eastern Superior Low-Velocity Anomaly to the east (Figures 6a and 6c). This is in contrast with the MCR aged volcanics in place around Lake Nipigon. It is likely that the original velocity signature beneath Nipigon was similar to the WS until the process that caused the Eastern Superior Low-Velocity Anomaly overprinted this signature as it did further to the east.
Mapping of the MCR from gravity (Chase & Gilmer, 1973) and interpretation of COCORP seismic lines (Brown et al., 1982) show that there is also an arm of the rift in Michigan. However, our model shows no low-velocity lithospheric feature beneath Michigan as it does beneath some parts of the main arm of the MCR. Resolution tests (Figure 11) show that if there were a significant low-velocity structure in the mantle, it would be resolvable. However, subcrustal underplating or intracrustal anomalies would be too shallow to be resolved by our data.
Figure 11. Resolution test mimicking the spatial extent of the Midcontinent Rift Bouguer gravity anomaly between
Lastly, we reduced our residuals to the same level as those used to image portions of the East African Rift System (Bastow et al., 2008; Park & Nyblade, 2006), where strong heat-related, low-velocity anomalies are observed in the mantle beneath the EARS, corresponding to a larger spread in preimaging delay times. Our less variable preimaging delay time distribution confirms that our data support the absence of rift-related heterogeneity in the mantle lithosphere beneath the MCR.
5.3. Deeper Anomalies
In and below the TZ, there are a number of prominent anomalies. The shallowest is the anomaly labeled TZ in Figure 6d. This anomaly has a strong high velocity that is indicative of the mantle in the tectoni-cally quiet portion of the North American continent. There is an anomaly of similar extent and velocity in the tomographic model of Burdick et al. (2014). Two linear high-velocity anomalies, labeled Farallon Slab and Kula Slab, occur at 1,000 and 1,200 km in depth, respectively. These anomalies are interpreted as fragments of the Farallon and Kula Plates due to their linear nature and the fact that they are in the cor-rect location both laterally and vertically to be slab fragments of the previously subducted plates (Bunge & Grand, 2000; Grand, 1994; Liu, 2015). Alternatively, these fragments could belong to westward subducted oceanic lithosphere from the Mezcalera and Angayucham slabs, Mesozoic predecessors of the Farallon Plate (Sigloch & Mihalynuk, 2013), but it would extend both slabs slightly more westward than projected by Sigloch and Mihalynuk (2013). Further comparison with global tomographic models shows a general con-tinuity throughout the different models in terms of size and shape of the anomalies, as predicted by both subduction models.
5.4. Syntaxis Anomalies
To the southwest of the northern MCR anomaly lies the semicircular low-velocity anomaly S1 (Figure 6c). This feature does not correlate with the gravity anomaly and continues to a greater depth than the imaged MCR anomalies. The location of this low-velocity anomaly coincides with (1) the surface expression of the rift as it turns to the southeast and is offset by the Belle Plaine fault (Chandler et al., 2007), (2) the west-ern syntaxis of the Penokean Province, which is the suture zone where the Penokean Province and the Marshfield Terrane collided with the Superior Province (Whitmeyer & Karlstrom, 2007), (3) the East Cen-tral Minnesota Batholith, a 1.78- to 1.76-Gyr post Penokean granitic magmatic event (Holm et al., 2005), and (4) the location of a high electrical conductivity anomaly imaged by Yang et al. (2015).
A low-velocity anomaly of similar size and shape to S1, named S2, is located in the lower peninsula of Michigan near the eastern syntaxis of the Penokean Province, where it abuts the Yavapai and Mazatzal provinces (Whitmeyer & Karlstrom, 2007). The anomaly is also near a 1.472-Gyr anorogenic volcanic intru-sion (Goodge & Vervoort, 2006; Windley, 1993) and also has a counterpart in Yang et al's (2015) electrical conductivity model. With S1 and S2 having nearly identical velocities and sizes it is possible that they may have similar causes, making a relationship with the Penokean Orogeny likely.
These anomalies are beneath the syntaxes of the Penokean Province. This correspondence may indicate that the Penokean Orogeny created weak zones in the lithosphere, which may have attracted some of the MCR volcanics to become entrained. A second possibility for these low-velocity anomalies is that they represent the fossil remnants of slab crust or subduction-induced metasomatism, trapped by the Penokean or Mazatzal collisions in the continental lithosphere. Using a GLIMPCE seismic profile (Green et al., 1989) in Lake Michigan between S1 and S2, Cannon et al. (1991) suggest that young ocean basin lithosphere subducted during the final stages of the Penokean orogeny in a northerly direction. This created the possibility for portions of the young slab's low-velocity crust, or its transformation products, to be trapped by the collision. The suture between this orogeny and the Superior Craton is known for its sulfide deposits and ophiolites (Schulz & Cannon, 2007; Sims et al., 1989). Yang et al. (2015) imaged high conductivities along this suture, including in the lower crust at the western syntaxis, where we image low velocities, which they attribute to graphitic carbon or sulfides, both associated with subducted seafloor sediments.
A third possibility pertains to the previously stated volcanic intrusions near the anomalies. These could have caused the low-velocity anomalies at different times, both well predating the MCR, depending on the composition of the emplaced magma and alteration of the lower crust by the migrating magma. It seems that the conductivity images of Yang et al. (2015) would favor the second explanation.
We interpret the large high-velocity anomaly (WS) as the cratonic lithospheric root of the Superior Province, in agreement with prior studies (Bedle & van der Lee, 2009; Frederiksen, Bollmann, et al., 2013; van der Lee & Frederiksen, 2005). With improved resolution provided by the SPREE stations, we find that lithospheric velocities in this region are on average at least 1.5% higher than the iasp91 velocities for the model. How-ever, this is most likely an underestimate due to the weaknesses of using relative delay times, as discussed in section 5.4. Our model shows that this high-velocity region extends through the western portion of Lake Superior and northern Wisconsin. In Figure 7, cross-section WP-WP′
shows that above 200 km in depth the lithosphere between feature S1 and the low-velocity at the northwestern edge of the model is similar in velocity to that of the lithosphere beneath the WS Province (cross-section SC-SC′
; Figure 7). Below that (200–400 km in cross-section WP-WP′; Figure 7) there is a weak low-velocity zone that extends from feature S1 to the northwest. This low-velocity zone is the same as the low-velocity “channel” noted in the Frederik-sen, Bollmann, et al. (2013) tomography, and it separates features WS and MRV, which roughly correlate to the locations of two subprovinces of the Superior Province, the Wawa, and MRV (Chandler et al., 2007). Chandler et al. (2007) indicate that the southern portion of the Superior Province, the MRV subprovince, was accreted to the southern margin of the Superior Province at 2.6 Gyr. It also has a vastly different geology, both in age and composition, than the Wawa subprovince to the north. The crustal boundary between the Wawa and MRV subprovinces is the Great Lakes Tectonic Zone (GLTZ; Figure 1b), which runs west-southwest to east-northeast between the two subprovinces (Sims et al., 1980). This does not seem to be the case in the lithosphere as the previously mentioned low-velocity zone in central/western Minnesota departs from the Becker Embayment to the northwest instead of following the GLTZ to the southwest. This low-velocity zone also seems to be a line of demarcation where the shear wave splitting of Frederiksen, Deniset, et al. (2013) and Ola et al. (2016) decreases in split time moving to the southwest and crossing the previously mentioned low-velocity zone. Either the GLTZ is too small to image with the resolution of the model or it does not have a lithospheric signature. It is possible that the rifting and material associated with the MCR could have further modified this portion of the lithosphere due to its already weakened nature from the northwest directed collision of the Marshfield Terrane with the Penokean Orogen and Superior Province (Foster et al., 2017; Holm et al., 2007).
6. Conclusions
Inversion of teleseismic P delays from permanent, TA, and SPREE, and other short-term seismic station deployments show a number of low-velocity zones in the North American midcontinent that agree with the tectonic history of the area. Some of the low-velocity patches appear associated with the Midcontinent Rift but cannot be uniquely ascribed to mantle structure. It is more likely that the observed anomalies are asso-ciated with P wave delay times caused by an along-rift subcrustal layer of igneous origin, as found by Zhang et al. (2016). In other words, and despite our data having sufficient resolving power to image anomalies in the mantle lithosphere, our results show no convincing evidence of one billion-year-old rift-related struc-tures remaining as anomalies in the mantle lithosphere. The resolving power of our analysis was enabled by the combined data coverage of the midwestern portion of the Transportable Array and densely spaced SPREE stations along and across the rift. Other interesting features include anomalies that occur at two dif-ferent syntaxes of Proterozoic crustal terranes, the WS Craton, and the presence of the subducted Farallon and Kula plates. These syntaxis anomalies had not been previously imaged seismically, but they do align very well with the provincial boundaries shown in Figure 1b and coincide with electrical conductivity anomalies images by Yang et al. (2015). The locations of the WS Craton and Farallon and Kula plates match very well with previous studies, albeit with a clearer image due to our increased resolution, especially in the case of the WS Craton.
References
Anderson, R., & McKay, R. (1997). Clastic rocks associated with the Midcontinent Rift system in Iowa, 1989. Reston, VA: US Geological Survey.
Bastow, I., Nyblade, A., Stuart, G., Rooney, T., & Benoit, M. (2008). Upper mantle seismic structure beneath the Ethiopian hot spot: Rifting at the edge of the African low-velocity anomaly. Geochemistry, Geophysics, Geosystems, 9, Q12022. https://doi.org/10.1029/2008GC002107 Bedle, H., & van der Lee, S. (2009). S velocity variations beneath North America. Journal of Geophysical Research, 114, B07308.
https://doi.org/10.1029/2008JB005949
Behrendt, J. C., Hutchinson, D., Lee, M., Thornber, C., Trehu, A., Cannon, W., & Green, A. (1990). GLIMPCE seismic reflection evidence of deep-crustal and upper-mantle intrusions and magmatic underplating associated with the Midcontinent Rift system of North America.
Tectonophysics, 173(1-4), 595–615.
Bleeker, W. (2003). The late Archean record: A puzzle in ca. 35 pieces. Lithos, 71(2), 99–134.
Bowring, S. A., & Karlstrom, K. E. (1990). Growth, stabilization, and reactivation of Proterozoic lithosphere in the southwestern United States. Geology, 18(12), 1203–1206.
Brown, L., Jensen, L., Oliver, J., Kaufman, S., & Steiner, D. (1982). Rift structure beneath the Michigan Basin from COCORP profiling.
Geology, 10(12), 645–649.
Buiter, S. J., & Torsvik, T. H. (2014). A review of Wilson Cycle plate margins: A role for mantle plumes in continental break-up along sutures? Gondwana Research, 26(2), 627–653.
Bunge, H.-P., & Grand, S. P. (2000). Mesozoic plate-motion history below the northeast Pacific Ocean from seismic images of the subducted Farallon slab. Nature, 405(6784), 337–340.
Burdick, S., van der Hilst, R. D., Vernon, F. L., Martynov, V., Cox, T., Eakins, J., et al. (2014). Model update January 2013: Upper mantle heterogeneity beneath North America from travel-time tomography with global and USArray transportable array data. Seismological
Research Letters, 85(1), 77–81.
Butler, R., Lay, T., Creager, K., Earl, P., Fischer, K., Gaherty, J., et al. (2004). The global seismographic network surpasses its design goal.
Eos, Transactions American Geophysical Union, 85(23), 225–229.
Cannon, W. F. (1992). The Midcontinent Rift in the Lake Superior region with emphasis on its geodynamic evolution. Tectonophysics,
213(1-2), 41–48.
Cannon, W. F. (1994). Closing of the Midcontinent Rift—A far-field effect of Grenvillian compression. Geology, 22(2), 155–158. Cannon, W., Green, A. G., Hutchinson, D. R., Lee, M., Milkereit, B., Behrendt, J. C., et al. (1989). The North American Midcontinent Rift
beneath Lake Superior from GLIMPCE seismic reflection profiling. Tectonics, 8(2), 305–332.
Cannon, W. F., Lee, M. W., Hinze, W., Schulz, K. J., & Green, A. G. (1991). Deep crustal structure of the Precambrian basement beneath northern Lake Michigan, midcontinent North America. Geology, 19(3), 207–210.
Chandler, V., Boerboom, T., & Jirsa, M. (2007). Penokean tectonics along a promontory-embayment margin in east-central Minnesota.
Precambrian Research, 157(1), 26–49.
Chase, C. G., & Gilmer, T. H. (1973). Precambrian plate tectonics: The midcontinent gravity high. Earth and Planetary Science Letters, 21(1), 70–78.
Darbyshire, F. A., Eaton, D. W., Frederiksen, A. W., & Ertolahti, L. (2007). New insights into the lithosphere beneath the Superior Province from Rayleigh wave dispersion and receiver function analysis. Geophysical Journal International, 169(3), 1043–1068.
Eaton, D., Adams, J., Asudeh, I., Atkinson, G. M., Bostock, M. G., Cassidy, J. F., et al. (2005). Investigating Canada's lithosphere and earthquake hazards with portable arrays. Eos, Transactions American Geophysical Union, 86(17), 169–173.
Foster, A. E., Darbyshire, F., & Schaeffer, A. (2017). A surface wave's view of the Midcontinent Rift (abstract #T41E-07). Presented at American Geophysical Union, Fall Meeting 2017, New Orleans, LA. http://adsabs.harvard.edu/abs/2017AGUFM.T41e..07F
Frederiksen, A., Bollmann, T., Darbyshire, F., & van der Lee, S. (2013). Modification of continental lithosphere by tectonic processes: A tomographic image of central North America. Journal of Geophysical Research: Solid Earth, 118, 1051–1066. https://doi.org/10.1002/jgrb.50060
Frederiksen, A., Deniset, I., Ola, O., & Toni, D. (2013). Lithospheric fabric variations in central North America: Influence of rifting and Archean tectonic styles. Geophysical Research Letters, 40, 4583–4587. https://doi.org/10.1002/grl.50879
Frederiksen, A., Miong, S.-K., Darbyshire, F., Eaton, D., Rondenay, S., & Sol, S. (2007). Lithospheric variations across the Superior Province, Ontario, Canada: Evidence from tomography and shear wave splitting. Journal of Geophysical Research, 112, B07318. https://doi.org/10.1029/2006JB004861
French, S., Fischer, K., Syracuse, E., & Wysession, M. (2009). Crustal structure beneath the Florida-to-Edmonton broadband seismometer array. Geophysical Research Letters, 36, L08309. https://doi.org/10.1029/2008GL036331
Goes, S., & van der Lee, S. (2002). Thermal structure of the North American uppermost mantle inferred from seismic tomography. Journal
of Geophysical Research, 107(B3), 2050. https://doi.org/10.1029/2000JB000049
Goodge, J. W., & Vervoort, J. D. (2006). Origin of mesoproterozoic A-type granites in Laurentia: Hf isotope evidence. Earth and Planetary
Science Letters, 243(3), 711–731.
Grand, S. P. (1994). Mantle shear structure beneath the Americas and surrounding oceans. Journal of Geophysical Research, 99(B6), 11,591–11,621.
Green, A. G., Cannon, W. F., Milkereit, B., Hutchinson, D. R., Davidson, A., Behrendt, J. C., et al. (1989). A “glimpse” of the deep crust beneath the Great Lakes. Properties and Processes of Earth's Lower Crust, 51, 65–80.
Hinze, W. J., Allen, D. J., Fox, A. J., Sunwood, D., Woelk, T., & Green, A. G. (1992). Geophysical investigations and crustal structure of the North American Midcontinent Rift system. Tectonophysics, 213(1), 17–32.
Hoffman, P. F. (1988). United plates of America, the birth of a craton: Early Proterozoic assembly and growth of Laurentia. Annual Review
of Earth and Planetary Sciences, 16, 543–603.
Hollings, P., Richardson, A., Creaser, R. A., & Franklin, J. M. (2007). Radiogenic isotope characteristics of the Mesoproterozoic intrusive rocks of the Nipigon Embayment, northwestern Ontario. Canadian Journal of Earth Sciences, 44(8), 1111–1129.
Hollings, P., Smyk, M., & Cousens, B. (2012). The radiogenic isotope characteristics of dikes and sills associated with the Mesoproterozoic Midcontinent Rift near Thunder Bay, Ontario, Canada. Precambrian Research, 214, 269–279.
Hollings, P., Smyk, M., Heaman, L. M., & Halls, H. (2010). The geochemistry, geochronology and paleomagnetism of dikes and sills associated with the Mesoproterozoic Midcontinent Rift near Thunder Bay, Ontario, Canada. Precambrian Research, 183(3), 553–571. Holm, D., Anderson, R., Boerboom, T. J., Cannon, W. F., Chandler, V., Jirsa, M., et al. (2007). Reinterpretation of Paleoproterozoic
accretionary boundaries of the north-central United States based on a new aeromagnetic-geologic compilation. Precambrian Research,
157(1–4), 71–79.
Acknowledgments
The relative P wave velocity model with respect to iasp91 and the traveltime pick files used to derive the model we present in this paper are available for download at http://geophysics.earth. northwestern.edu/seismology/SPREE18/. Data from the USArray Transportable Array and SPREE were obtained from the IRIS Data Management Center (http://www.iris.edu; last accessed April 2014). Network Codes and years of operation: SPREE-XI (2011–2013), USArray TA-TA (2003 to present), z-US (1990 to present), CNSN-CN (1980 to present), GSN-II (1980 to present), FedNor-WU (1991 to present), POLARIS-PO (2000 to present), FLED-XR (2001–2002), APT-89-91-003-APT (1989), and TW ST-XK (1997). Maps were created with the Generic Mapping Tools (GMT; Wessel et al., 2013). All picking of traveltimes were completed using the AIMBAT traveltime picking tool (Lou et al., 2013). This research was supported by NSF grant EAR-0952345. The Superior Province Rifting Earthscope Experiment (SPREE) was supported by the Earthscope program through NSF grant EAR-0952154. This project would not have been possible without the support of the landowners that allowed for the installation of TA and SPREE seismic stations. Please see ttps://www.earth.northwestern.edu/ spree/People.html for full acknowledgments. In addition, we thank Basil Tikoff for discussion about our velocity anomalies with respect to the structural and tectonic history of the midcontinent.
Paleoproterozoic plutons from the northern midcontinent, USA: Evidence for subduction flip and continued convergence after geon 18 Penokean orogenesis. Geological Society of America Bulletin, 117(3-4), 259–275.
Karlstrom, K. E., & Humphreys, E. D. (1998). Persistent influence of Proterozoic accretionary boundaries in the tectonic evolution of southwestern North America Interaction of cratonic grain and mantle modification events. Rocky Mountain Geology, 33(2), 161–179. Kay, I., Sol, S., Kendall, J.-M., Thomson, C., White, D., Asudeh, I., et al. (1999). Shear wave splitting observations in the Archean craton of
Western Superior. Geophysical Research Letters, 26(17), 2669–2672.
Kennett, B., & Engdahl, E. (1991). Traveltimes for global earthquake location and phase identification. Geophysical Journal International,
105(2), 429–465.
Klasner, J., Cannon, W., & Van Schmus, W. (1982). 4: The pre-Keweenawan tectonic history of southern Canadian Shield and its influence on formation of the Midcontinent Rift. Geological Society of America Memoirs, 156, 27–46.
Liu, L. (2015). The ups and downs of North America: Evaluating the role of mantle dynamic topography since the mesozoic. Reviews of
Geophysics, 53, 1022–1049. https://doi.org/10.1002/2015RG000489
Lou, X., & van der Lee, S. (2014). Observed and predicted North American teleseismic delay times. Earth and Planetary Science Letters,
402, 6–15.
Lou, X., van der Lee, S., & Lloyd, S. (2013). AIMBAT: A python/matplotlib tool for measuring teleseismic arrival times. Seismological
Research Letters, 84(1), 85–93.
Masse, R. P., Filson, J. R., & Murphy, A. (1989). United States national seismograph network. Tectonophysics, 167(2-4), 133–138. Meltzer, A., Rudnick, R., Zeitler, P., Levander, A., Humphreys, G., Karlstrom, K., et al. (1999). The USArray initiative. Geological Society of
America TODAY, 9, 8–10.
Miller, J., Nicholson, S., Easton, R., Ripley, E., & Feinberg, J. (2013). Geology and mineral deposits of the 1.1 Ga Midcontinent Rift in the Lake Superior region—An overview. In J. Miller (Ed.), Field guide to the copper-nickel-platinum group element deposits of the Lake
Superior Region(pp. 13–01). Duluth, MN: Precambrian Research Center Guidebook.
Moidaki, M., Gao, S. S., Liu, K. H., & Atekwana, E. (2013). Crustal thickness and Moho sharpness beneath the Midcontinent Rift from receiver functions. Research in Geophysics, 3, 1–7. https://doi.org/10.4081/rg.2013.e1
North, R., & Basham, P. (1993). Modernization of the Canadian National Seismograph Network. Seismological Research Letters, 64, 41. Ojakangas, R. W., & Dickas, A. B. (2002). The 1.1-Ga Midcontinent Rift System, central North America: Sedimentology of two deep
boreholes, Lake Superior region. Sedimentary Geology, 147(1), 13–36.
Ojakangas, R., Morey, G., & Green, J. (2001). The Mesoproterozoic Midcontinent Rift System, Lake Superior region, USA. Sedimentary
Geology, 141, 421–442.
Ola, O., Frederiksen, A. W., Bollmann, T., van der Lee, S., Darbyshire, F., Wolin, E., et al. (2016). Anisotropic zonation in the lithosphere of Central North America: Influence of a strong cratonic lithosphere on the Mid-Continent Rift. Tectonophysics, 683, 367–381. Owens, T. J., Crotwell, H. P., Groves, C., & Oliver-Paul, P. (2004). SOD: Standing order for data. Seismological Research Letters, 75(4),
515–520.
Park, Y., & Nyblade, A. A. (2006). P wave tomography reveals a westward dipping low velocity zone beneath the Kenya Rift. Geophysical
Research Letters, 33, L07311. https://doi.org/10.1029/2005GL025605
Parker, R. L. (1994). Geophysical inverse theory. Princeton, NJ: Princeton University Press.
Pollitz, F. F., & Mooney, W. D. (2014). Seismic structure of the Central US crust and shallow upper mantle: Uniqueness of the Reelfoot Rift.
Earth and Planetary Science Letters, 402, 157–166.
Schmandt, B., & Lin, F.-C. (2014). P and S wave tomography of the mantle beneath the United States. Geophysical Research Letters, 41, 6342–6349. https://doi.org/10.1002/2014GL061231
Schneider, D., Bickford, M., Cannon, W., Schulz, K., & Hamilton, M. (2002). Age of volcanic rocks and syndepositional iron formations, Marquette Range Supergroup: Implications for the tectonic setting of Paleoproterozoic iron formations of the Lake Superior region.
Canadian Journal of Earth Sciences, 39(6), 999–1012.
Schulz, K. J., & Cannon, W. F. (2007). The Penokean orogeny in the Lake Superior region. Precambrian Research, 157(1), 4–25. Shaw, C. A., & Karlstrom, K. E. (1999). The Yavapai-Mazatzal crustal boundary in the southern Rocky Mountains. Rocky Mountain Geology,
34(1), 37–52.
Shen, W., Ritzwoller, M. H., & Schulte-Pelkum, V. (2013). Crustal and uppermost mantle structure in the central US encompassing the Midcontinent Rift. Journal of Geophysical Research: Solid Earth, 118, 4325–4344. https://doi.org/10.1002/jgrb.50321
Sigloch, K., & Mihalynuk, M. G. (2013). Intra-oceanic subduction shaped the assembly of Cordilleran North America. Nature, 496(7443), 50–56.
Silver, P. G., & Kaneshima, S. (1993). Constraints on mantle anisotropy beneath Precambrian North America from a transportable teleseismic experiment. Geophysical Research Letters, 20(12), 1127–1130.
Simmons, N. A., Forte, A. M., Boschi, L., & Grand, S. P. (2010). GyPSuM: A joint tomographic model of mantle density and seismic wave speeds. Journal of Geophysical Research, 115, B12310. https://doi.org/10.1029/2010JB007631
Sims, P., Card, K., Morey, G., & Peterman, Z. (1980). The Great Lakes tectonic zone—A major crustal structure in central North America.
Geological Society of America Bulletin, 91(12), 690–698.
Sims, P., Schmus, W. V., Schulz, K., & Peterman, Z. (1989). Tectono-stratigraphic evolution of the Early Proterozoic Wisconsin magmatic terranes of the Penokean Orogen. Canadian Journal of Earth Sciences, 26(10), 2145–2158.
Tanner, J. G., Aiken, C. L. V., Dehlinger, P., Dewhurst, W. T., de la Fuente, M., Godley, V. M., et al. (1988). Gravity anomaly map of North America. The Leading Edge, 7(11), 15–18.
Turcotte, D. L., & Schubert, G. (2014). Geodynamics. Cambridge: Cambridge University Press. Van Schmus, W. (1992). Tectonic setting of the Midcontinent Rift system. Tectonophysics, 213(1-2), 1–15.
Van Schmus, W., Bickford, M., & Turek, A. (1996). Proterozoic geology of the east-central Midcontinent basement. Geological Society of
America Special Papers, 308, 7–32.
Van Schmus, W., & Hinze, W. (1985). The Midcontinent Rift system. Annual Review of Earth and Planetary Sciences, 13, 345–383. van der Lee, S., & Frederiksen, A. (2005). Surface wave tomography applied to the North American upper mantle. In A. Levander &
G. Nolet (Eds.), Seismic Earth: Array Analysis of Broadband Seismograms, Geophysical Monograph Series (Vol. 157, pp. 67–80). Washington, DC: American Geophysical Union.
van der Lee, S., & Nolet, G. (1997). Seismic image of the subducted trailing fragments of the Farallon plate. Nature, 386(6622), 266–269. van der Lee, S., & Wiens, D. A. (2006). Seismological constraints on Earth's deep water cycle. Geophysical Monograph-American Geophysical
VanDecar, J. C. (1991). Upper-mantle structure of the Cascadia subduction zone from non-linear teleseismic travel-time inversion (PhD thesis), University of Washington, Seattle.
VanDecar, J., & Crosson, R. (1990). Determination of teleseismic relative phase arrival times using multi-channel cross-correlation and least squares. Bulletin of the Seismological Society of America, 80(1), 150–169.
Wessel, P., Smith, W. H., Scharroo, R., Luis, J., & Wobbe, F. (2013). Generic mapping tools: Improved version released. Eos, Transactions
American Geophysical Union, 94(45), 409–410.
Whitmeyer, S. J., & Karlstrom, K. E. (2007). Tectonic model for the Proterozoic growth of North America. Geosphere, 3(4), 220–259. Windley, B. F. (1993). Proterozoic anorogenic magmatism and its orogenic connections Fermor Lecture 1991. Journal of the Geological
Society, 150(1), 39–50.
Wolin, E., van der Lee, S., Bollmann, T. A., Wiens, D. A., Revenaugh, J., Darbyshire, F. A., et al. (2015). Seasonal and diurnal variations in long-period noise at SPREE stations: The influence of soil characteristics on shallow stations' performance. Bulletin of the Seismological
Society of America, 105(5), 2433–2452.
Yang, B., Egbert, G. D., Kelbert, A., & Meqbel, N. M. (2015). Three-dimensional electrical resistivity of the north-central USA from EarthScope long period magnetotelluric data. Earth and Planetary Science Letters, 422, 87–93.
Zhang, H., van der Lee, S., Wolin, E., Bollmann, T. A., Revenaugh, J., Wiens, D. A., et al. (2016). Distinct crustal structure of the North American Midcontinent Rift from P wave receiver functions. Journal of Geophysical Research: Solid Earth, 121, 8136–8153. https://doi.org/10.1002/2016JB013244