Deliverable D 7.2
Synthesis and
Recommendations
31/07/2018
BRAIN-TRAINS
Transversal assessment of new
intermodal strategies
Frank Troch, Thierry Vanelslander, Christa Sys, Koen Verhoest, Christine Tawfik, Sabine Limbourg, Angel Merchan, Angélique Léonard
BELGIAN RESEARCH ACTION THROUGH
INTERDISCIPLINARY NETWORKS
CONTENTS
CONTENTS ... 2
INTRODUCTION ... 3
1. Linking the inputs and outputs of WP 2 ‘operational’ and WP 4 ‘environmental’ ... 5
1.1. Optimal environmental modal split ... 5
1.1.1. Introduction ... 5
1.1.2. Climate change ... 8
1.1.3. Particulate matter ... 8
1.1.4. Photochemical ozone formation ... 9
1.2. Environmental impact assessment of the scenarios, obtained for the optimization of operational costs ... 10
1.2.1. Analysis of the scenarios using the method shown in deliverable D.4.4 of the BRAIN-TRAINS project ... 11
1.2.2. Analysis of the scenarios using the method shown in the deliverable D.1.3 of the BRAIN-TRAINS project ... 16
1.2.3. Synopsis of the environmental impact assessment of the scenarios ... 20
1.3. Conclusions ... 21
2. Recommendations ... 22
3. Conclusion ... 31
References... 35
Appendix I – Direct emissions to air and energy consumption used in the three scenarios of the year 2030 ... 36
a) Rail freight transport ... 36
b) Inland waterways transport ... 37
INTRODUCTION
Over the period 2014 – 2018, the BRAIN-TRAINS project analysed rail freight development within an intermodal context in Belgium. The main goal of the project is to develop a blue print, including the detailed criteria and conditions for developing an innovative intermodal network in and through Belgium, as part of the Trans-European Transport Network (TEN-T) in order to meet different market, societal and policy-making challenges. The project developed an operational framework in which effective rail freight transport and intermodal transport can be successfully established in Belgium, with attention to beneficial participation and commitment of all different stakeholders.
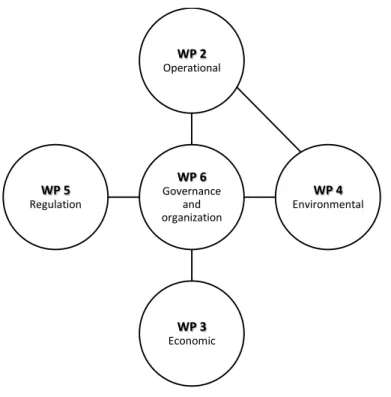
This interdisciplinary analysis is built around 7 Work Packages (WP’s), focussing on five different main topics, as shown in figure 1.
FIGURE 1. STRUCTURE OF THE BRAIN-TRAINS PROJECT
The BRAIN-TRAINS project started with an analysis of the rail freight market in WP 1. In order to provide the correct context for the rest of the project, a SWOT analysis has been performed in Deliverable 1.1 – 1.2. From this analysis, three plausible scenarios for rail freight transport development within an intermodal context have been explored in deliverable 1.3. This best-case, medium-case and worst-case scenario, together with the SWOT matrix and the SWOT analysis, served as input parameters for the quantification methodologies of the five different topics in WPs 2 to 6.
Each WP adapted or developed a topic-specific methodology, in order to quantify the impact of rail freight transport development and intermodal transport, on the observed indicators. As such, tools are provided for users of rail freight transport or governmental parties, to define strategies for rail freight transport development based on quantification of possible effects.
The output of these WPs are used in WP 7, to create a synthesis in deliverable 7.1. The scope of the current final deliverable 7.2 is to formulate some ultimate recommendations and provide more insight on possible linkages between the WPs. This deliverable will be structured around three sections, as presented in Figure 2.
FIGURE 2. STRUCTURE OF DELIVERABLE 7.2
In a first section of this deliverable, the output of WP 2 on ‘optimal corridor and hub development’, and WP 4 on ‘sustainability’ are linked and used as common input to the defined methodologies. This link is shown as a line connecting WP 2 and WP 4 in Figure 2. As such, the effects or these interlinkages on the final results can be explored.
In a second section of this deliverable, some final recommendations from the research of WP 2 to 5 are presented, shown by the 4 outer circles in Figure 2. These recommendations are formulated taking into account the realisation of the best-case scenario, where the desired modal shift of 30% of road freight over 300 km is taking place by 2030 (European Commission, 2011). As such, the pre-requisite condition of sufficient capacity is taken as an assumption for the formation of these recommendations. Nevertheless, as the creation of additional capacity requires time, this should be thoroughly monitored and necessary action should be taken in advance in order to avoid that a lack of capacity would become a bottleneck in the future. The presented recommendations are the results from the output of WPs 2 to 5 and are taking into account the interlinkages between these WPs.
WP 6 Governance and organization WP 2 Operational WP 4 Environmental WP 3 Economic WP 5 Regulation
A final section of this deliverable contains the result of applying the output of WP 6 on the recommendations of WP 2 to 5. This is indicated by the central circle containing WP 6 in Figure 2, with interlinkages to all recommendations of the previous WPs. A general recommendation for governance and organization, based on the formulated recommendations, forms a strong conclusion to this BRAIN-TRAINS project, with a positive view on the future development of rail freight transport in Belgium, within an intermodal context.
1. Linking the inputs and outputs of WP 2 ‘operational’ and WP 4
‘environmental’
This section of the deliverable aims at highlighting the links between WP 2 (optimal corridor and hub development) and WP 4 (sustainability impact of intermodality) of the BRAIN-TRAINS project.
The first part of this section identifies the resulting modal split for environmental optimizations, when the life cycle input emission values of WP 4 have been taken into account. The values computed by WP 4 regarding climate change, particulate matter formation, and photochemical ozone formation, for each particular mode, i.e. rail freight transport, inland waterways transport (IWW) and road transport, in Belgium are introduced as input parameters of the model developed by WP 2 (intermodal allocation model), in order to identify the resulting modal split in terms of environmental optimization.
In the second part of this section, the modal split values obtained by WP 2 for the economic optimization (optimization of operational costs) are used by WP 4 as an input parameter for computing the resulting environmental impact of each scenario in Belgium.
1.1. Optimal environmental modal split
1.1.1. Introduction
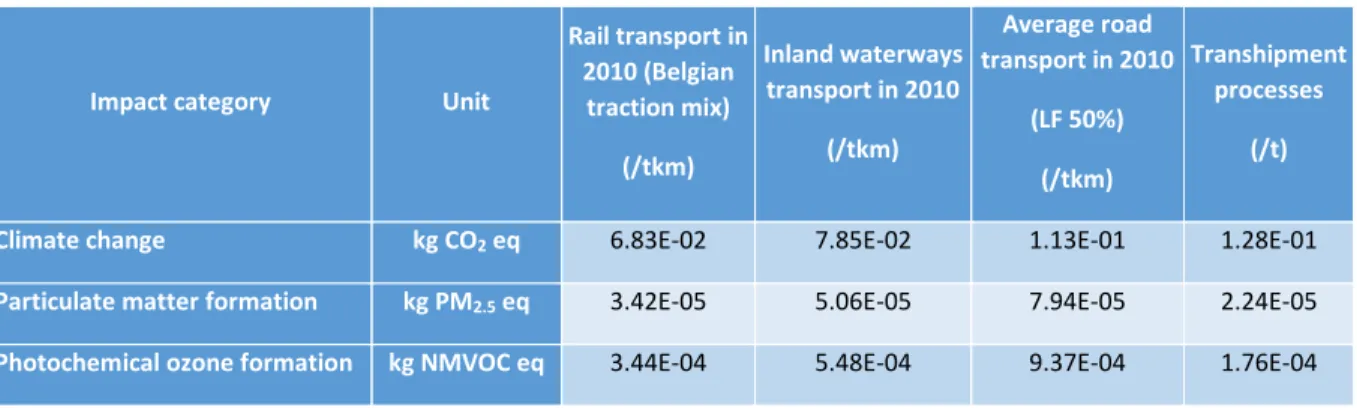
Table 1 provides the values of the environmental parameters (i.e. inputs of WP 4) used in the model in order to identify the optimal environmental modal split. The model is applied on the Belgian case study. It takes into account the already existing configuration of terminals on the network and evaluates the optimal flow distribution under the policies which optimize the transport network in terms of:
a) Climate change;
b) Particulate matter formation; c) Photochemical ozone formation.
The climate change issue is considered since it has become an important societal topic in the recent years. The interest for climate change is in particular illustrated by the organization of international conventions and events, such as the Kyoto Protocol or the regular United Nations Climate Change Conferences. The Paris agreement which entered into force in November 2016 is a further illustration of the willingness to limit climate change effect with the objective of “keeping a global temperature rise this century well below 2 degrees” (UNFCCC, 2016).
Population exposure to particulate matter and tropospheric ozone is considered as a major environmental health problem in most cities. Transport represents an important source of air pollution, especially for
particulate matter and nitrogen oxides (NOX). Particulate matter can be emitted directly from vehicles
(primary particulate matter) or be formed in the atmosphere from precursor pollutants such as sulphur oxides (SOX), NOX, ammonia (NH3) or Volatile Organic Compounds (VOC). The tropospheric ozone is formed
from other precursor pollutants such as NOX and Non-Methane Volatile Organic Compounds (NMVOC) by
photochemical reaction under the influence of solar radiation. It should be noted that stratospheric ozone is beneficial to the environment because it filters ultraviolet radiation from the sun.
TABLE 1. INPUTS OF WP 4 CONSIDERED FOR THE ANALYSIS OF THE OPTIMAL ENVIRONMENTAL MODAL SPLIT
Impact category Unit
Rail transport in 2010 (Belgian traction mix) (/tkm) Inland waterways transport in 2010 (/tkm) Average road transport in 2010 (LF 50%) (/tkm) Transhipment processes (/t)
Climate change kg CO2 eq 6.83E-02 7.85E-02 1.13E-01 1.28E-01
Particulate matter formation kg PM2.5 eq 3.42E-05 5.06E-05 7.94E-05 2.24E-05
Photochemical ozone formation kg NMVOC eq 3.44E-04 5.48E-04 9.37E-04 1.76E-04
The input values are considered for the year 2010, i.e. the latest available year in terms of data for all modes of transport in Belgium. These values represent the reference scenarios. They are based on the work of WP 4. The following three processes have been used: rail freight transport considering the Belgian traction mix of the year 2010 (83.45% of electric trains and 16.55% of diesel trains), inland waterways transport of the year 2010 and average road transport with a load factor of 50% of the year 2010. Moreover, transhipment values have been obtained by converting the energy consumption factors (in kJ) related to the transhipment of one TEU (based on Messagie et al., 2014) in terms of its impact on climate change, particulate matter formation and photochemical ozone formation. It is assumed that 12 tonnes of goods are transported in a single TEU (Janic, 2007).
The values of externalities provided in this deliverable are based on the analysis of the whole life cycle of modes of transport, i.e. they include the values related to the use of the modes, as well as their production and recycling phases. Figure 3 highlights the different stages of the Life Cycle Assessment that are taken into account.
FIGURE 3. INLAND FREIGHT TRANSPORT SYSTEM BOUNDARIES CONSIDERED IN THE LIFE CYCLE ASSESSMENT STUDY
SOURCE: OWN ELABORATION BASED ON SPIELMANN ET AL., 2007
Flow exchanges between Belgian regions and some regions of neighbouring countries (The Netherlands, Germany, France and Luxembourg) at the third-level of Nomenclature of Territorial Units for Statistics (NUTS 3) are taken into account. Sea flows originating from or leaving the country at maritime ports are also considered. A map of the terminal implementation in Belgium is given by Figure 4.
The objective is to identify the impact on flow distribution of the externalities of transport that have been computed by WP 4 specifically for the Belgian case study. The comparison of these results with the ones obtained in the previous deliverable D.2.3 of the BRAIN-TRAINS project is also performed.
1.1.2. Climate change
This section identifies the effects on flow distribution between road, intermodal rail and intermodal IWW transport of the optimization of climate change impact. This optimization policy aims at determining the optimal flow distribution on the network when an economic policy is followed. The emissions related to climate change are converted into CO2 equivalents. Figure 5 provides the flow distribution under the
minimization of climate change impacts.
FIGURE 5. FLOW DISTRIBUTION FOR THE OPTIMIZATION OF CLIMATE CHANGE (IN TKM)
From Figure 5 it can be seen that in the optimization of climate change of transport, 55% of flows are transported using intermodal rail transport, 42% by road and 3% by intermodal IWW transport. This means that the impact of intermodal rail transport is interesting compared to the one of intermodal IWW and direct road transport.
The resulting modal split highlights a kind of competition between the two intermodal solutions, resulting in a very low market share of IWW compared to rail. This result is explained by the modelling of the intermodal modes, whose structure of path is quite similar (pre-haulage, transhipment, long-haul, transhipment and post-haulage). Since transhipment emissions are assumed to be identical for rail and IWW, and since unit rail emissions are lower than unit IWW emissions, as much as possible flows are sent through intermodal rail instead of intermodal IWW transport. Doing this allows avoiding a maximum of emissions related to climate change.
1.1.3. Particulate matter formation
According to the World Health Organization (WHO), air pollution is now “the world's largest single environmental risk.” In 2012, one out of eight people who passed away died because of air pollution exposure (WHO, 2014). That is why, next to focusing on climate change, this section identifies the effects on flow distribution between road, intermodal rail and intermodal IWW transport of the optimization of particulate matters formation. This optimization policy aims at determining the optimal flow distribution on the network when an environmental policy related to air pollution is followed. The emissions are expressed in terms of PM2.5 equivalent. Figure 6 provides the flow under the minimization of particulate
matters. 42% 55% 3% Road Rail IWW
FIGURE 6. FLOW DISTRIBUTION FOR THE OPTIMIZATION OF PARTICULATE MATTERS (IN TKM)
When the focus is on particulate matter formation, intermodal rail transport is the best opportunity in most of the flow exchanges. Indeed, the intermodal rail market share is 75% whereas direct road transport and intermodal IWW transport respectively have a market share of 23% and 2%. As for the optimization related to climate change, few flows are sent using the intermodal IWW combination. This result highlights again the competition that may occur between intermodal rail and intermodal IWW transport.
The relative position of the different modes in terms of market share obtained with the updated values of emissions for Belgium are quite similar to the work of Mostert et al. (2017). Indeed, the optimization of air pollution external costs led to a modal split of 62% for intermodal rail, 30% for road, and 8% for intermodal IWW transport. The variations of the percentage values for each mode of transport can be explained by the fact that topic addressed from different perspectives: Mostert et al. (2017) use a tank-to-wheel analysis, whereas this deliverable is based on a well-to-wheel analysis (see Figure 1). This deliverable therefore takes into account the emissions generated during the whole life cycle of the modes of transport, whereas Mostert et al. (2017) focus on the emissions phase during the use of the transport mode. The comparison of these results with the ones of Mostert et al. (2017) highlights the fact that when all the effects of transport related to air pollution externalities are taken into account, road and IWW transport become less interesting from an environmental point of view.
1.1.4. Photochemical ozone formation
This section identifies the effects on flow distribution between road, intermodal rail and intermodal IWW transport of the minimization of photochemical ozone formation. This optimization policy aims at determining the optimal flow distribution on the network when an environmental policy related to the improvement of air quality is followed. Figure 7 provides the flow distribution under the policy which minimizes photochemical ozone formation.
23% 75% 2% Road Rail IWW
FIGURE 7. FLOW DISTRIBUTION FOR THE OPTIMIZATION OF PHOTOCHEMICAL OZONE FORMATION (IN TKM)
The scenario which minimizes photochemical ozone formation leads to the same modal split as the one obtained when particulate matter is optimized. This means that the most important market share is assigned to intermodal rail transport, followed by road and then by intermodal IWW transport. As particulate matter, photochemical ozone formation also contributes to air pollution. These similar results are therefore not very surprising and are also coherent with the results obtained by Mostert et al. (2017).
1.2. Environmental impact assessment of the scenarios obtained for the
optimization of operational costs
The WP 2 of the BRAIN-TRAINS project has obtained the flow distribution between rail freight transport, inland waterways transport and road transport for the optimization of operational costs. The formulation used to test the reference and worst-case scenarios is based on the intermodal location-allocation and on the intermodal allocation model developed by Mostert et al. (2017). The focus is on containerized flows of transport between several origin-destination pairs. The model minimizes the total costs of transport companies. These costs include door-to-door road costs, transshipment costs between sea and road, rail-road intermodal costs, and IWW-rail-road intermodal costs as estimated in Deliverables D2.2 and D 2.3. Table 2 shows the modal split of Belgium in the year 2010 and the values calculated for the optimization of operational costs in a reference scenario and a best, medium and worst case scenarios in the year 2030.
TABLE 2. MODAL SPLITS (%) IN BELGIUM FOR THE SCENARIOS
Year 2010
Optimization of operational costs Reference scenario Best-case in 2030 Medium-case in 2030 Worst-case in 2030 Railway 14.5 23 30 23 13 Inland waterways 17.6 4 6 4 1 Road 67.9 73 64 73 86 23% 75% 2% Road Rail IWW
On the basis of the modal splits obtained for the optimization of operational cost in Belgium, we have analysed how the change of the modal split affects the environmental impacts of inland freight transport in Belgium. Moreover, we have created several transport processes for the year 2030, thereby we can also analyse how the improvement of the environmental performance of the different modes of transport affects the environmental impacts of inland freight transport.
We have used two methods to create the transport processes of the year 2030. On one hand, a method based on the deliverable D.4.4 of the BRAIN-TRAINS project (Merchan et al., 2018), which considers the same transport processes in the three scenarios of the year 2030. Thus, this method focuses on the influence of the change of modal split. On the other hand, a method based on the deliverable D.1.3 of the BRAIN-TRAINS project (Troch et al., 2015), which considers transport processes with different direct emissions to air and energy consumptions in the three scenarios of the year 2030. This allows determining the influence of the change of technology.
As in the previous deliverables of the WP 4 of the BRAIN-TRAINS project (Merchan et al., 2017a, 2017b and 2018), the Life Cycle Assessment (LCA) methodology has been chosen to analyse the environmental impacts of the inland freight transport in Belgium. A LCA study comprises four stages. First, the goal and scope definition, which in this deliverable is to analyse the environmental impacts of the different scenarios obtained for the optimization of operational costs by WP 2. The functional unit chosen is “one tonne-kilometre of freight transported”. The second stage of an LCA is the inventory analysis. In this study the data is used as shown in the previous deliverables of WP 4 of the BRAIN-TRAINS project (Merchan et al., 2017a, 2017b and 2018). Figure 3 presents the stages considered in our study for the rail freight transport, inland waterways transport and road freight transport. The third stage is the impact assessment. All calculations in our study have been made with the SimaPro 8.0.5 software using the Life Cycle Impact Assessment (LCIA) method “ILCD 2011 Midpoint+” (version V1.06 / EU27 2010), which is the method recommended by the European Commission (European Commission, 2010). “ILCD 2011 Midpoint+” is a midpoint method including 16 environmental impact indicators. However, in this analysis it has been used only the indicators with a level of quality “I” (climate change, ozone depletion and particulate matter), and “II” (ionizing radiation – human health, photochemical ozone formation, acidification, terrestrial and freshwater eutrophication and mineral, fossil and renewable resource depletion). Finally, the fourth stage is the assessment of the results obtained in the previous stages.
The purpose of this section is to analyse how the change of the modal split and the improvement of the technology used by the different transport modes affects the environmental impacts of inland freight transport in Belgium. We have analysed the environmental impacts of the modal splits of the year 2010 (used as the reference year), a reference scenario and the three scenarios of the year 2030 considering the values showed in table 2.
1.2.1. Analysis of the scenarios using the method shown in deliverable D.4.4 of the
BRAIN-TRAINS project
In deliverable D.4.4 of the BRAIN-TRAINS project (Merchan et al., 2018), we have analysed how the increase of rail freight transport as a result of the possible development of intermodal rail freight transport affects the environmental impacts of the modal split of inland freight transport in Belgium. For this, we have studied an increase of rail demand of 133%, 64% or 10% for a best, medium and worst case scenarios. As a difference in the present deliverable with respect to the deliverable D.4.4, we have used the values of modal
split for the optimization of operational costs presented in table 2 and the transport processes of the year 2010.
In order to determine the environmental impacts of the modal splits of the year 2010 and the reference scenario for the optimization of operational costs, the following three processes have been used: rail freight transport considering the Belgian traction mix of the year 2010 (83.45% of electric trains and 16.55% of diesel trains), inland waterways transport of the year 2010 and average road transport with a load factor of 50% of the year 2010. Therefore, the only difference between both scenarios is the modal split.
For the analysis of the three scenarios in the year 2030, we have considered that the process of inland waterways transport remains the same as 2010. For rail freight transport, since the use of diesel trains is decreasing over the years in Belgium (see table 3), we have considered that the rail freight transport will be performed mostly by electric traction in Belgium in the year 2030.
TABLE 3. ELECTRIC AND DIESEL RAIL FREIGHT TRACTION SHARE IN FLANDERS (BELGIUM)
Year 2006 2007 2008 2009 2010 2011 2012 Electric traction 76.33% 76% 78.2% 83.1% 83.45% 83.8% 86.3%
Diesel traction 23.67% 24% 21.8% 16.9% 16.55% 16.2% 13.7% SOURCES: FLEMISH ENVIRONMENT AGENCY (VMM, 2008, 2009, 2010, 2012, 2013)
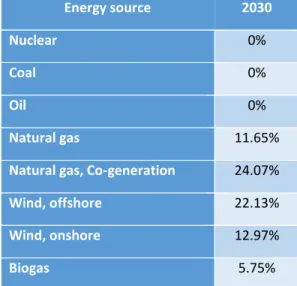
The electricity supply mix used for electric trains plays an important role in determining the environmental impact. Thereby, depending on the energy split of the country (i.e. the share of nuclear or natural gas power for example), the environmental impact of the electric rail freight transport varies. Therefore, to determine the environmental impacts related to the electricity production in the year 2030, we have estimated the energy split of Belgium for this year. Table 4 presents the energy split considered for the year 2030 in Belgium. These values are extracted from a study of Léonard and Belboom (2016) on electricity supply mix in Belgium. For the year 2030, a scenario is considered in which all targets for CO2 emission reduction have
been achieved and nuclear power is no longer used. Electricity imports from other countries are not considered, thus only the domestic production mix of Belgium is used.
TABLE 4. DOMESTIC PRODUCTION MIX CONSIDERED FOR THE ELECTRICITY PRODUCTION IN BELGIUM IN THE YEAR 2030
Energy source 2030
Nuclear 0%
Coal 0%
Oil 0%
Natural gas 11.65%
Natural gas, Co-generation 24.07%
Wind, offshore 22.13%
Wind, onshore 12.97%
Biomass 7.47%
Hydro 0.70%
Waste 2.69%
Photovoltaic 10.56%
Geothermal 2.01% SOURCE: LEONARD AND BELBOOM, 2016
For road transport in the year 2030, it is assumed that the share of the population of lorries classified by gross vehicle weight remains stable but the load factor has improved from an average 50% load factor in the year 2010 to an average 60% in the year 2030. Moreover, it has been considered that the emission engine technology Euro VI (which has been introduced in the year 2014) will be the main engine technology in the Belgian heavy duty vehicle market.
Table 5 presents the results obtained in the LCIA of one tonne-kilometre of freight transported by the different transport processes used in the modal split of the scenarios. These transport processes are as follows: rail freight transport considering the Belgian traction mix of 2010 (83.45% of electric trains and 16.55% of diesel trains), inland waterways transport of the year 2010, average road transport with a load factor of 50% of the year 2010, rail freight transport of the year 2030 (considering only electric traction and the domestic production mix of Belgium in the year 2030) and average road transport with a load factor of 60% and Euro VI emission engine technology for the year 2030.
TABLE 5. LCIA RESULTS OF 1 TKM OF FREIGHT TRANSPORTED BY THE TRANSPORT PROCESSES USED IN THE SCENARIOS
Impact category Unit
Rail transport in 2010 (Belgian traction mix) Inland waterways transport in 2010 Average road transport in 2010 (LF 50%) Electric train 2030 Average road transport in 2030 (LF 60% - Euro VI) Climate change kg CO2 eq 6.83E-02 7.85E-02 1.13E-01 5.35E-02 9.51E-02
Ozone depletion kg CFC-11 eq 1.22E-08 8.09E-09 2.06E-08 6.16E-09 1.73E-08
Particulate matter kg PM2.5 eq 3.42E-05 5.06E-05 7.94E-05 2.69E-05 5.28E-05
Ionizing radiation HH kBq U235 eq 5.65E-02 1.31E-02 9.74E-03 4.49E-03 8.17E-03
Photochemical ozone formation kg NMVOC eq 3.44E-04 5.48E-04 9.37E-04 1.58E-04 2.73E-04
Acidification molc H+ eq 3.93E-04 6.64E-04 8.40E-04 2.30E-04 3.39E-04
Terrestrial eutrophication molc N eq 1.24E-03 2.05E-03 3.39E-03 5.65E-04 7.37E-04
Freshwater eutrophication kg P eq 1.70E-05 2.04E-05 1.01E-05 1.40E-05 8.52E-06
Figure 8 shows a comparison of the results (from table 5) obtained in the LCIA of one tonne-kilometre of freight transported by the inland freight transport modes used in the modal split of the different scenarios. Since each environmental impact indicator is expressed in different units, and to facilitate the interpretation of the LCIA results, all the scores of an indicator have been divided by the highest score of the indicator, which represents the maximum impact of the indicator. Therefore, the lowest value represents the mode of transport with less impact and the highest value represents the maximum impact.
FIGURE 8. LCIA OF 1 TKM OF FREIGHT TRANSPORTED BY THE TRANSPORT PROCESSES USED IN THE SCENARIOS
First, the average road transport with a load factor of 50% of the year 2010 presents the maximum impact in seven environmental impact indicators. The average road transport used in the three scenarios of the year 2030 has a load factor of 60% (it should be noted that the higher the load factor, the lower the energy consumption) and this, together with the Euro VI emission engine technology, results in a lower environmental impact in all the indicators of the road transport process of the year 2030. The Euro VI emission engine technology influences on the indicators particulate matter, photochemical ozone formation, acidification and terrestrial eutrophication due to the lower exhaust emissions in comparison with the other engine technologies on PM2.5, NMVOC and NOx, respectively.
Second, The process of rail freight transport considering the Belgian traction mix of 2010 (83.45% of electric trains and 16.55% of diesel trains) presents the maximum impact in the indicator ionizing radiation (damage to human health) due to the use of nuclear power in the electricity production in Belgium (nuclear power was responsible for 45% of the Belgian electricity supply mix in 2010, representing the main energy source). Since it has been considered that the nuclear power will be not used in the domestic production mix of electricity in the year 2030 (see table 4), the environmental impact on this indicator of the transport process electric train in the year 2030 are the lowest. Third, the main source of impact in the indicator freshwater eutrophication for the process of inland waterways transport is the production of materials such as concrete and steel used in canals and port facilities.
0% 10% 20% 30% 40% 50% 60% 70% 80% 90% 100%
Climate change Ozone depletion Particulate
matter Ionizing radiation HH Photochemical ozone formation Acidification Terrestrial eutrophication Freshwater eutrophication
Mineral, fossil & ren resource
depletion
Rail transport (Belgian traction mix) Inland waterways transport Road transsport (LF 50%)
Life Cycle Impact Assessment (LCIA) of the scenarios
The LCIA of the different scenarios has been performed using the values of modal split presented in table 2 and the transport processes shown in table 5. Thereby, we have analysed how the change of modal split affects the environmental impacts of inland freight transport in Belgium. Table 6 presents the results obtained in the LCIA of one tonne-kilometre of freight transported considering the modal split of the reference year 2010, the reference scenario for the optimization of operational cost and the best, medium and worst case scenarios for the year 2030. Road transport is the main contributor in all the scenarios to the total impact on all the environmental impact indicators. The only exception to this is in indicator ionizing radiation in the modal split of the year 2010, where rail freight transport represents 63% of the total impact due to the use of electricity produced partially with nuclear power by the electric trains.
TABLE 6. LCIA RESULTS OF 1 TKM OF FREIGHT TRANSPORTED CONSIDERING THE MODAL SPLIT OF THE SCENARIOS
Impact category Unit Year 2010 Reference scenario Best-case scenario 2030 Medium-case scenario 2030 Worst-case scenario 2030 Climate change kg CO2 eq 1.00E-01 1.01E-01 8.16E-02 8.48E-02 8.95E-02
Ozone depletion kg CFC-11 eq 1.72E-08 1.82E-08 1.34E-08 1.43E-08 1.57E-08
Particulate matter kg PM2.5 eq 6.78E-05 6.78E-05 4.49E-05 4.67E-05 4.94E-05
Ionizing radiation HH kBq U235 eq 1.71E-02 2.06E-02 7.36E-03 7.52E-03 7.74E-03
Photochemical ozone formation kg NMVOC eq 7.83E-04 7.85E-04 2.55E-04 2.57E-04 2.60E-04
Acidification molc H+ eq 7.45E-04 7.30E-04 3.26E-04 3.27E-04 3.28E-04
Terrestrial eutrophication molc N eq 2.84E-03 2.85E-03 7.64E-04 7.49E-04 7.27E-04
Freshwater eutrophication kg P eq 1.29E-05 1.21E-05 1.09E-05 1.03E-05 9.35E-06
Mineral, fossil & ren. resource depletion kg Sb eq 8.54E-06 9.24E-06 7.12E-06 7.84E-06 8.88E-06 Figure 9 shows a comparison of the results (from table 6) obtained in the LCIA of one tonne-kilometre of freight transported considering the modal split of the different scenarios.
FIGURE 9. LCIA OF 1 TKM OF FREIGHT TRANSPORTED CONSIDERING THE MODAL SPLIT OF THE DIFFERENT SCENARIOS
0% 10% 20% 30% 40% 50% 60% 70% 80% 90% 100%
Climate change Ozone
depletion Particulate matter Ionizing radiation HH Photochemical ozone formation Acidification Terrestrial eutrophication Freshwater eutrophication
Mineral, fossil & ren resource
depletion
As mentioned above, the transport processes used in the modal split of 2010 and the reference scenario for the optimization of operational costs are the same, being the only difference the modal split. It should be noted that even if rail freight transport increases with the optimization of operational costs (from 14.5% to 23%, which means a higher impact in the indicator ionizing radiation), inland waterways transport presents a drop in the modal split share (from 17.6% to 4%) and road transport increases (from 67.9% to 73%), causing the reference scenario to have a higher environmental impact than the modal split of 2010 in several indicators. However, the differences between these two scenarios are not really significant. The reference scenario has the same modal split than the case scenario. However, the medium-case scenario presents lower scores in all the indicators because of the use of electric trains (using the electricity supply mix of 2030) and road transport with improved load factor (from 50% to 60%) and an engine with Euro VI emission technology. The influence should be noted of the Euro VI emission engine technology used in the road transport process of 2030 on the indicators particulate matter, photochemical ozone formation, acidification and terrestrial eutrophication. Moreover, the non-use of nuclear power in the domestic production mix of electricity in the year 2030 (used by electric trains) influences on the indicator ionizing radiation (damage to human health).
Since the best-case scenario has the lowest share of road transport (64%), it presents the lowest environmental impact in almost every indicator. Within the scenarios of 2030, this scenario shows the higher score in the indicators related to the eutrophication due to the highest presence of rail transport (30%) and inland waterways transport (6%), respectively. However, the difference between the scenarios of 2030 are not significant.
1.2.2. Analysis of the scenarios using the method shown in the deliverable D.1.3 of the
BRAIN-TRAINS project
In the deliverable D.1.3 of the BRAIN-TRAINS project (Troch et al., 2015), the values extracted from EcoTransIT (2008) were fixed as reference values to develop the scenarios for both parameters: transport emissions and energy consumption. However, we have made some modifications in this deliverable regarding the parameters of the deliverable D.1.3 (Troch et al., 2015). The following considerations have been made:
a) The rates of reduction of transport emissions have been applied only to the direct emissions to air produced during the transport operation (see table 7). It should be noted that these pollutants as direct emissions do not yet represent environmental impact categories such as climate change or photochemical ozone formation. These direct emissions during transport operation are part of the inventory analysis and this, together with the energy consumption during transport operation and the emissions, energy and material consumptions from the energy generation and the vehicle and infrastructure stages, constitutes the required elements to model the freight transport system. It is necessary to consider all the elements from the inventory analysis to evaluate the contribution of the freight transport to environmental impact categories.
b) For inland waterways transport, we have considered the same rates of reduction of energy consumption and direct emissions to air than diesel trains in every scenario.
c) The only direct emissions to air considered for electric trains are the SF6 emissions from the
electricity conversion at traction substations. Thus, the rates of reduction of direct emissions to air for electric trains have been applied only for this pollutant emission. Furthermore, the electricity
supply mix of the year 2030 (see table 3) has been used for rail freight transport in the three scenarios.
d) For the fuel-dependent emissions such as CO2 and heavy metals, the rate of reduction is the same
than for energy consumption.
e) The other direct emissions to air such as NOx, SO2, NMVOC or particulate matter have the same
rates of reduction in the three scenarios of the year 2030.
Table 7 presents the rates of reduction that have been applied to the direct emissions to air and energy consumption for the best, medium and worst case scenarios in the year 2030. These reduction factors are based on technological advances in terms of energy efficiency and reduction of exhaust emissions. Since the year 2010 has been used as reference year, the rates of reduction have been applied to the direct emissions to air and energy consumption of the following three transport processes: rail freight transport considering the Belgian traction mix of the year 2010 (83.45% of electric trains and 16.55% of diesel trains), inland waterways transport of the year 2010 and average road transport with a load factor of 50% of the year 2010. Unlike in the first method, in this case we have considered that in the year 2030 there will be the same traction mix for rail freight transport than in the year 2010 (thus there will be an 83.45% of electric trains and 16.55% of diesel trains).1
TABLE 7. RATES OF REDUCTION USED FOR SCENARIO CREATION
Parameters
Scenarios in the year 2030 Best Medium Worst
Direct emissions
to air
Fuel dependent emissions (CO2 and
heavy metals) Road -10% -15% -30% Diesel trains -20% -15% -10% Inland waterways -20% -15% -10% Other emissions (SO2, NOx, NMVOC, particles, etc.) Road -20% -20% -40% Diesel trains -40% -20% -10% Inland waterways -40% -20% -10% Energy consumption Road -10% -15% -30% Electric trains -20% -15% -10% Diesel trains -20% -15% -10% Inland waterways -20% -15% -10%
Life Cycle Impact Assessment (LCIA) of the scenarios
As in the first method, the environmental impacts of the modal splits of the year 2010 and the reference scenario for the optimization of operational costs have been determined using the following three processes: rail freight transport considering the Belgian traction mix of the year 2010 (83.45% of electric trains and 16.55% of diesel trains), inland waterways transport of the year 2010 and average road transport with a load factor of 50% of the year 2010. Therefore, the only difference between both scenarios is the modal split.
The LCIA of the different scenarios has been performed using the values of modal split presented in table 2 and the transport processes obtained using the rates of reduction from table 7. Table 8 presents the results obtained in the LCIA of one tonne-kilometre of freight transported considering the modal split of the reference year 2010, the reference scenario and the best, medium and worst case scenarios for 2030. Road transport is the main contributor in all the scenarios to the total impact on all the environmental impact indicators. The only exception to this is in the indicator ionizing radiation (damage to human health) in the modal split of the year 2010, where rail freight transport represents 63% of the total impact due to the use of electricity produced partially with nuclear power by the electric trains.
TABLE 8. LCIA RESULTS OF 1 TKM OF FREIGHT TRANSPORTED CONSIDERING THE MODAL SPLIT OF THE SCENARIOS
Impact category Unit Year 2010 Reference scenario Best-case scenario 2030 Medium-case scenario 2030 Worst-case scenario 2030 Climate change kg CO2 eq 1.00E-01 1.01E-01 8.67E-02 8.82E-02 8.24E-02
Ozone depletion kg CFC-11 eq 1.72E-08 1.82E-08 1.46E-08 1.52E-08 1.46E-08
Particulate matter kg PM2.5 eq 6.78E-05 6.78E-05 5.93E-05 6.28E-05 6.30E-05
Ionizing radiation HH kBq U235 eq 1.71E-02 2.06E-02 7.98E-03 8.02E-03 7.50E-03
Photochemical ozone formation kg NMVOC eq 7.83E-04 7.85E-04 6.11E-04 6.65E-04 6.02E-04
Acidification molc H+ eq 7.45E-04 7.30E-04 5.90E-04 6.26E-04 5.69E-04
Terrestrial eutrophication molc N eq 2.84E-03 2.85E-03 2.18E-03 2.37E-03 2.10E-03
Freshwater eutrophication kg P eq 1.29E-05 1.21E-05 1.18E-05 1.13E-05 1.03E-05
Mineral, fossil & ren. resource depletion kg Sb eq 8.54E-06 9.24E-06 8.33E-06 9.22E-06 1.05E-05
Figure 10 shows a comparison of the results (from table 8) obtained in the LCIA of one tonne-kilometre of freight transported considering the modal split of the different scenarios. The modal split of 2010 and the reference scenario for the optimization of operational costs are the same than in the first method. Therefore, the same conclusions as in the first method can be drawn.
FIGURE 10. LCIA OF 1 TKM OF FREIGHT TRANSPORTED CONSIDERING THE MODAL SPLIT OF THE DIFFERENT SCENARIOS
The reference scenario has the same modal split than the case scenario. However, the medium-case scenario presents lower scores in all the indicators because of a decrease of 15% in the energy consumption and fuel-dependent emissions (i.e. CO2 and heavy metals) and a decrease of 20% in the others
direct emissions to air in all the transport modes. Moreover, the non-use of nuclear power in the domestic production mix of electricity in the year 2030 (used by electric trains) influences on the indicator ionizing radiation (damage to human health).
The worst-case scenario shows the higher score in the indicator resource depletion due to the highest presence of road transport (86%). It should be noted that the road transport process used in this method with a load factor of 50% has a higher environmental impact than the road transport process used in the first method, which uses a load factor of 60% and a Euro VI emission engine technology.
The reference scenario presents the highest environmental impact in the indicators climate change, particulate matter emissions and photochemical ozone formation because of the presence of a 73% of road transport with a load factor of 50% in the modal split. The three scenarios of the year 2030 show the lowest values for these indicators because the reduction in all the transport processes of the energy consumption and greenhouse gas (GHG) direct emissions to air in the case of the indicator climate change, the reduction of the particulate direct emissions to air in the case of the indicator particulate matter emissions and the reduction of the NOX and NMVOC direct emissions to air in the case of the indicator photochemical ozone
formation. Moreover, the use of the electricity supply mix of 2030 in the electric trains influences the reduction of the environmental impact in the indicator climate change.
Focusing on the three scenarios of 2030, the worst-case scenario has the lowest impact in the indicator climate change even though it presents the highest share of road transport (86%), since the road transport process used has been calculated considering a reduction of 30% of diesel consumption and CO2 direct
emissions to air, and a 40% of N2O direct emissions. The worst-case scenario has the highest impact in the
indicator particulate matter emissions (but with similar values than the medium-case scenario) because this
0% 10% 20% 30% 40% 50% 60% 70% 80% 90% 100%
Climate change Ozone depletion Particulate
matter Ionizing radiation HH Photochemical ozone formation Acidification Terrestrial eutrophication Freshwater eutrophication
Mineral, fossil & ren resource
depletion
scenario presents the highest share of road transport (86%), even though the road transport process features a reduction of 40% of particulate matter direct emissions to air. It should be noted the strong influence in the result of this indicator of the direct emissions to soil of tire, break and road wear during the road transport activity.
For the indicator photochemical ozone formation, the medium-case scenario has the highest impact because the presence of a 73% of road transport in the modal split and a reduction of only 20% of NOX and
NMVOC direct emissions to air in all the transport modes, while there is a reduction of 40% of NOx and NMVOC direct emissions to air in the worst-case scenario for road transport and in the best-case scenario for diesel trains and inland waterways transport
1.2.3.
Synopsis of the environmental impact assessment of the scenarios
Two methods have been used to analyse the environmental impacts of the modal splits obtained for the optimization of operational cost in Belgium. Thereby, we have analysed how the change of the modal split and the improvement of the technology used by the different modes of transport influences the environmental impacts of inland freight transport in Belgium.
The modal split of 2010 and the reference scenario for the optimization of operational costs are the same in both methods. Moreover, the transport processes used in the modal split of 2010 and the reference scenario are the same, being the only difference the modal split. Even if the reference scenario has a higher environmental impact than the modal split of 2010 in almost every indicator because of its higher share of road transport (from 67.9% to 73%), the differences between these two scenarios are not really significant. When comparing these two scenarios with those of the year 2030, even if there is an increase of the road transport share (from 67.9% in the year 2010 to 73% and 86% in the medium and worst case scenarios, respectively), the environmental impacts are generally lower in the year 2030 for both methods. Furthermore, for some indicators, there is a high difference in the environmental impacts between the scenarios of the year 2010 and those of the year 2030. Within the scenarios of the year 2030, even with a difference of 22% in the share of road transport (from the 64% of the best-case scenario to the 86% of the worst case scenario) the differences between scenarios are not really significant in both methods.
The load factor and emission engine technology are shown as determining factors in the environmental impacts of the road transport process of the first method. Therefore, these factors have a strong influence in the environmental impact of the total inland freight transport due to the prominent position of road transport in Belgium. In order to improve the results of our study, the influence should be analysed of the load weight in the specific fuel consumption of the lorry. Moreover, the electricity supply mix plays a fundamental role in the environmental impacts of rail freight transport when using electric traction in both methods. Thus, as the use of electric trains increases in the future and have a higher share of the total inland freight transport, the energy split for the electricity generation will be more important in the environmental impacts of goods transport.
Considering all the above, the following question arises: which one of the following two measures would have a greater influence on the environmental impacts of inland freight transport: reducing the share of road transport in the modal split or improving the technology thus achieving a reduction of the energy consumption and direct emissions from road transport? In view of the foregoing, a better environmental performance could be achieved by improving the characteristics of the transports modes such as load
factor, emission engine technology or the electricity supply mix, rather than by reducing the modal share of road transport.
However, decreasing the share of road transport in favour of more environment-friendly and energy-efficient modes of transport such as inland waterways and rail is still a significant measure to apply, which in the case of rail transport becomes especially interesting when electric trains are powered by sustainable electricity.
1.3. Conclusions
The analysis carried out in the first part of this section has identified the impact on modal split of the application of three different policies aiming at favouring the environmental aspects of transport: climate change, particulate matter formation and photochemical ozone formation minimization. The emission values determined by WP 4 for the specific case of Belgium have been used as input parameters of the model. The resulting modal splits based on life cycle emissions have been analysed and compared to previous research. Results highlight that intermodal rail transport has the major market share for every policy which focuses on the optimization of air pollution and climate change. The predominant market share of intermodal rail transport highlights the efficiency of this mode in terms of environmental objectives. The focus on environmental policies is therefore one solution to achieve the modal transfer from road to more environmentally friendly modes, as expected by the European Commission (2011).
In the second part of this section, on the basis of the modal splits obtained for the optimization of operational cost in Belgium, we have analysed how the change of the modal split and the improvement of the technology used by the different transport modes influences the environmental impacts of inland freight transport in Belgium. On one hand, the improvement of the technology of the different modes of transport with the aim of reducing direct emissions and energy consumption are decisive regarding the reduction of the environmental impacts of transport. Moreover, the electricity supply mix plays a fundamental role in the environmental impacts of electric trains. On the other hand, decreasing the share of road transport in the modal split produces modest results but is still shown to be an effective measure to reduce the environmental impact of transport. Therefore, in order to reduce the environmental impacts of inland freight transport, the change of modal split has to be accompanied by the improvement of technology in the transport modes.
2. Recommendations
In the second part of deliverable 7, some final recommendations are formulated based on the output of WPs 2 to 5. In the next section, WP 6 will apply its findings for governance and organization to these recommendations.
Recommendation 2: Rail subsidies are indispensable and a framework is needed to optimize their
offering.
Context: Experiments have shown that subsidies are crucial for the business’ survival and to make up for the high initial fixed costs, in line with the general consensus among rail freight services’ providers. Our scope is on rail transport subsidies that are paid or granted directly from public funds. However, determining the optimal height at which these subsidies should be provided requires a mathematical framework that combines optimization techniques along with the knowledge of the incurred costs and market prices. A more generic logistics view is also necessary as subsidies are typically given to both rail and IWWs transport.
Recommendation 1: A minimum load factor has to be ensured, if a rail freight service is to be
provided, in order to fully exploit the economies of scale.
Context: In the framework of maximizing revenues and minimizing operational costs, it has been noticed that the train load factor has been kept at high levels: 97-99%. This observation is constant throughout all the conducted experiments for the three future scenarios, regardless of the cost fluctuations. Additionally, larger capacities and higher payload of containers in comparison to trucks have been previously identified as an important and plausible point of strength of intermodal transport. An assumption has been made throughout the project that capacity should always be sufficient; the government therefore should be foresighted about the time needed to develop more capacity.
Expected results: As a basic unit of rail service, we consider the Conventional Intermodal Freight Trains (CIFTs), already operating in many national and Trans-European corridors. Typically, each train
consists of a maximum of 30 wagons of an approximate length of 20 m (total maximum length
of 600 m), each of which has a carrying capacity of 50 tonnes. In order for a rail service to be profitable and make up for its high fixed costs, the load factor should not fall below the above mentioned levels. Otherwise, freight consolidation should be sought in order to fill the containers, and the experiments conducted on the market formed around the European rail corridors show that this is indeed a possible endeavor, under a suitable optimization framework. Furthermore, experiments show that small increases in capacities could indeed increase the intermodal as well as the rail market share. However, we would imagine the future with large capacity increases as the transport sector is moving towards running longer freight trains. It is considered as a promising measure to respond to the expected rise in freight volumes (more than 80% by 2050) and in order to avoid further losses in the freight modal split. Indeed, it is believed to be an instrument that could improve the operational efficiency of the rail freight system, allowing for a consequent increase in transport capacity. In this case, a considerable load on the fixed costs would be added on the transport operators, reflected in their decreasing profit, and should therefore be addressed by proper measures, if the general intention is to help promoting environmental transport modes.
Expected results: Most studied cases share a certain recommended figure of the required subsidies (i.e. no more than 70-75% of the fixed costs). Until this threshold, the rail modal share exhibits a reasonably steady increase. For the subsidies levels that exceed this threshold however, the modal split undergoes fast unnecessary changes, implying merely an increased profit, though less train load factors. It should also be noted that these results highly depend on the framework assumptions of the studied rail corridors, i.e. RailNetEurope corridors passing through Belgium.
Recommendation 3: Tackling the long transit and terminal handling times of intermodal
transport by increasing the freight traffic priority and optimizing the terminals’ operations (e.g.
developing a pool of containers).
Context: The general impression shared by shippers transporting containerized cargo is that intermodal transport is perceived as a less reliable alternative when compared to trucking transport. According to our conducted survey among shipping firms in Belgium, the average reported increase in transit time of intermodal with respect to all-road transport is 98-185.7%. Additionally, the average number of days equipment remains unavailable in all-road and intermodal transport is 3 and 6 days, respectively. Within our network optimization framework, we further noticed that intermodal transport tends to receive less modal share when resource balancing is imposed and the service quality, represented in logistics costs, is considered in contrast to the direct out-of-pocket costs. In most cases, containers belong to individual container lines, making them in turn non-exchangeable between the different shippers. This typically results in higher waiting times, consequent demurrage costs and a lot of unnecessary empty container movement, which is, on one hand, inefficient from a supply chain perspective and, on the other hand, harmful to the environment.
Expected results: We expect that giving higher or equal priority to freight over passengers train – provided that currently the opposite is being applied in Europe – would result in shorter transit times, hence an enhanced service quality of intermodal transport overall. The long transhipment times at the terminals also suggest a possible room for improvement in the terminal handling operations in order to reduce congestion and waiting times. For instance, an obvious idea, though potentially difficult to implement, would be to develop a common pool of containers at the terminals that can be easily exchanged. On a related note, the expected growth in cargo quantities as well as the vessel size require an upgrading of the current port infrastructure, in order to handle the greater peaks and relieve the pressure on the ports and terminals.
Recommendation 4: Focus on environmental objectives to increase the market share of
intermodal rail transport
Context: Reduced costs and externalities, as well as increased sustainability over long distances have been identified as strong points of intermodal transport. Results of the studied scenarios in this project highlight that intermodal rail transport has the major market share for every policy which focuses on the optimization of air pollution and climate change. The predominant market share of intermodal rail transport highlights the efficiency of this mode in terms of environmental objectives.
Expected results: The focus on environmental policies is therefore one solution to achieve the modal transfer from road to more environment friendly modes, as expected by the European Commission. On the contrary, results show that road transport is favoured when the focus is on policies which optimize economic objectives (minimization of operational costs). The rethinking of the current economic model focusing mainly on costs, with an inclusion of environmental factors is therefore one solution to increase the intermodal rail market share.
Recommendation 5: Increase the load factor of trucks for drayage operations to improve the
efficiency and market share of intermodal rail transport and to reduce the high drayage costs.
Context: When the focus is on economic objectives (i.e. when operational costs are optimized), road transport has the highest market share. The lower representation of intermodal rail and IWW transport is explained by the high pre- and post-haulage costs (i.e. drayage operational costs).
Expected results: These costs can be reduced by improving the load factors of the trucks. This improvement could be achieved by a better bundling of flows, with an increased collaboration between freight carriers, so as to maximize the load factor of the trucks reaching or leaving the intermodal terminals. Such favorable results could also be attained by trying to increase the potential backhauling and consequently reduce the need for empty truck journeys.
Recommendation 6: In the context of flow consolidation, favor the collaboration, cooperation
and sharing of transport resources through innovative commercial strategies and technical tools
to increase the intermodal market share.
Context: Intermodal transport is characterized by the possibility to carry large flows of goods. The bundling of flows allows an optimal loading of the long-haul modes like train or barge. The high fixed costs of the travel by rail or IWW can therefore be divided into more units, allowing for economies of scale. Consolidation might also be improved in the pre- and post-haulage travels by truck.
Expected results: The consolidation of flows could be achieved by the development of more cooperation and sharing of transport resources between the transport operators. This implies the development of new commercial strategies and technical tools to ensure the smooth collaboration between stakeholders. For instance, new commercial strategies regarding the allocation of the benefits between transport providers of a cooperating system could be defined. From the technical point of view, applications that identify the amount and location of freight demand and supply available at a certain moment in time could also be further developed.
Recommendation 7: Adapt the policy decisions in future road taxes on motorways so as to reflect
the real level of externalities of each mode to favor intermodal rail transport.
Context: The scenarios analyzed in this research have evaluated the effect of a road tax on the modal split between road, intermodal rail and intermodal IWW transport. The introduction of a road tax leads to a more favorable market share for intermodal rail transport than in the case in which no tax is imposed. However, the resulted intermodal market share is still lower than the one obtained in the configuration which focuses only on the externalities of transport.
Expected results: These results highlight the environment-friendliness of intermodal rail transport and the necessity to take political measures through taxes, so as to re-establish the optimal social modal split which takes into account externalities and their related costs. The social modal split (which includes environmental impact and favors intermodal rail transport) could also be obtained by including externalities in the economic system through the monetization and internalization of externalities (=external costs), e.g. by applying the polluter pays principle.
Recommendation 8: Increase the energy efficiency of freight transport.
Context: The transport is the sector with the highest energy consumption in the EU-28 and the second in Belgium with a 31.7% and 28.3% of the final energy consumption in the year 2012, respectively. Within the transport sector, road transport constitutes 81.6% in the EU-28 and 82.4% in Belgium of the transport final energy consumption (Eurostat statistics, 2017). Therefore, the search for a more energy-efficient transport system becomes necessary.
Inland waterways transport is the most energy-efficient mode of inland freight transport in our study, but also in both the EcoTransIT (2008) and Ecoinvent databases. Within rail freight transport, electric traction has the lowest energy consumption, while diesel traction has the highest. Focusing on road transport, our study shows that the energy consumption is highly dependent of the load factor. Thereby, an articulated lorry of 34-40 t with a load factor of 50% presents the highest energy consumption among the inland freight transport modes studied. However, with a load factor of 85%, it can achieve a lower energy consumption than diesel trains.
The energy efficiency in the railway sector, and therefore its competiveness, will improve in the future. Some points to improve the efficiency of the rail freight transport will be the weight reduction through new materials of locomotives and wagons (Helms and Lambrecht, 2006). This would allow the saving of the energy consumed during the transport activity, but also energy consumed in the manufacture and disposal of rail vehicles. Moreover, the development of new engines for more energy-efficient locomotives, the energy recovery systems from braking, the energy-efficient driving through the control of speed and improved aerodynamics in rolling stock, will lead to a reduction in the energy consumption (IEA/UIC, 2015). Furthermore, a greater energy efficiency could be achieved by optimizing the management systems in the intermodal terminals, which would allow lower waiting times for transport vehicles such as barges or lorries and more efficient transhipment processes using cargo handling equipment for example.
Expected results: Reduction of the energy consumption in the transport sector. Liberalisation of the energy market should be considered / examined.
Recommendation 9: Increase load factors in freight transport.
Context: The energy consumption is highly dependent of the load factor. Higher load factors in freight transport can be achieved through the shifting of road freight transport in long distances to rail freight transport. Thereby, the higher payload capacity of trains promotes their shared use by several companies, which would improve the load factor and a reduction of the transport intensity. Furthermore, the higher operating costs of rail freight transport entail the optimization of the load factor to make it profitable. Moreover, the longer the train and the heavier the cargo, the more rail freight transport becomes energy-efficient (Messagie et al., 2014). In the Belgian network, the length of freight trains is limited to 750 m and the maximum permitted load is 3600 t, although the average load of freight trains in Belgium was 569 t, 575 t and 584 t in the years 2006, 2007 and 2008, respectively (SNCB, 2009). Furthermore, the use of electric locomotives rather than diesel locomotives allows transporting heavier loads.
Expected results: Reduction of the energy consumption in the transport sector.
Recommendation 10: Improve the emission technology of the vehicles used in freight transport.
Context: The emission technology of a vehicle (e.g. diesel locomotive, barge or lorry) is a determining factor in the environmental impacts of freight transport. The air pollutant emissions from road transport have decreased over the years as a result of the implementation of the Euro emission standards, which have promoted enhancements of the emission control technologies. For diesel locomotives, the lower rate of replacement of the locomotives due to their longer life span causes a slow implementation of new engines with better emission technologies. It should be noted that the higher rate of renewal of the lorry fleet produces a faster improvement in road transport emissions.
Expected results: Reduction of the exhaust emissions during the transport activity.
Recommendation 11: Use alternative fuels like biodiesel.
Context: Replacing diesel by other sources of cleaner energy like biodiesel, will lead to the reduction of environmental impacts. The use of biodiesel produces advantages in terms of CO2 emissions, but analysing
the life cycle of the biodiesel the pollution could be transferred from air when combusting to soil and water during crop production. Therefore, the environmental advantages of the use of biodiesel depend on the specific type and source of the biodiesel. It should be noted that the use of biodiesel does not affect exhaust emissions depending on engine technology such as NOx or particles for example. The photochemical ozone and particulate matter formation in cities would therefore not be affected.
Recommendation 12: Use low-sulphur fuels.
Context: The exhaust emissions of SO2 depend on the sulphur content in fuels. Therefore, the higher the
sulphur content in the fuel, the greater the SO2 emissions. The fuel quality legislation has been shown as an
effective measure to reduce the exhaust SO2 emissions. In Belgium, the amount of sulphur by mass
permissible for diesel used by diesel locomotives and lorries is 10 ppm from 2009. However, diesel in Belgium has an average sulphur content of 8 ppm since 2008. Similarly, the gas-oil used in barges has a limit of sulphur content of 10 ppm from 2011.
Expected results: Reduction of the direct CO2 emissions of freight transport.
Recommendation 13: Increase the share of electric trains in the Belgian traction mix.
Context: In view of the results obtained in our study, electric trains show a better life-cycle environmental performance than diesel trains. Thereby, electric trains are more energy-efficient than diesel trains and the use of electric locomotives rather than diesel locomotives enables to transport heavier loads. It should be noted that even though the use of diesel is present in rail freight transport in Belgium, the use of electric traction is much greater. Moreover, the use of diesel traction is decreasing in Belgium, which means that only a small part of the rail freight produces exhaust emissions. Therefore, the increased use of electric trains in intermodal transport represents an opportunity to attain a more environment- and health-friendly, and energy-efficient transport system.
Expected results: Improvement of the environmental impacts of rail freight transport.
Recommendation 14: Enhance the electricity supply mix used by electric trains.
Context: The electricity supply mix plays a fundamental role in the environmental impacts of rail freight transport when using electric traction. Thus, as the use of electric trains will increase in the future and have a higher share of the total inland freight transport, the energy split for the electricity generation will be more important in the environmental impacts of goods transport. The use of electric trains becomes especially interesting when they are powered by sustainable electricity.
The liberalization of the energy supplier market for the rail freight transport companies could be seen as an opportunity to improve the electricity supply mix of electric trains. Rail freight transport operators could commit to clean electricity as a competitive factor. However, this could also have a negative effect, since companies could opt for cheaper energies such as nuclear energy or coal. Nuclear fission does not produce direct air emissions such as greenhouse gases for example, but instead nuclear wastes with a high potential impact on human health and ecosystems are produced.