Blood pressure during adolescence: A study among Belgian adolescents
selected from a high cardiovascular risk population
Dominique Paulus, Annie Saint-Remy & Michel Jeanjean
Association for Cardiovascular Disease Prevention, Brussels, Belgium Accepted in revised form 4 August 1999
Abstract. Introduction: the Belgian province of Luxembourg has a high incidence of cardiovascular (CV) disease according to the MONICA register. Surveys conducted in adults and children have also found high CV risk factor levels in this province. Design: cross-sectional study. Objective of the present study: to collect data about blood pressure (BP) and its determinants in adolescents from this high CV risk population and to analyse their relationship. Partic-ipants: 1526 adolescents (12±17 years) in 24 secondary schools of the province. Results: mean systolic BP levels were 125 mm Hg (sd = 12 mm Hg) and 122 mm Hg (sd = 11 mm Hg) for boys and girls, respectively. Mean diastolic BP was equal to 74 mm Hg (sd = 10 mm Hg) in both genders.
Sys-tolic BP increased with age and diered signi®cantly between genders from 15 years onwards. Body fat-ness indices increased with age except waist-to-hip ratio in girls and triceps skinfold in boys. Regression models including age, anthropometric indices and physical activity explained a small percentage of BP variance (for systolic BP, r2= 0.21 and 0.12 for boys
and girls, respectively). Weight was the ®rst param-eter related to BP in correlation and regression ana-lyses. Conclusions: this study showed high BP and body fatness indices in adolescents from a high CV risk population. The model under study showed a moderate relationship between body fatness and BP. This ®nding suggests other in¯uences as a genetic component to account for the high levels observed. Key words: Adolescence, Blood pressure, Body fatness, Body mass index, Weight
Introduction
Blood pressure (BP) during adolescence is a major determinant of the level recorded in later adulthood. Blood pressure tracking from childhood to adulthood has been widely documented in the literature and the strength of tracking increases with increasing age at ®rst measurement [1±5]. Follow-up studies have also supported the major role of ponderosity indices changes in adult blood pressure level prediction. Therefore the emergence of an association between body fatness and blood pressure in youth takes on particular importance [6±12]. The aim of this study was to determine the nature of factors associated with blood pressure in adolescents and in particular to analyse the relationship with body fatness indices. A major interest of this work was the choice of the population study. The Belgian province of Luxem-bourg has a high cardiovascular disease morbidity and mortality burden in comparison with neigh-bouring regions. MONICA surveys have shown that adults and children of this province exhibited high levels of cardiovascular risk factors and in particular high body fatness indices [13±14]. The current study was therefore the missing link between observations made in adults and children from the same popula-tion.
Subjects and methods Survey population
This cross-sectional survey was conducted in Bel-gium, in the Southern province of Luxembourg. Eli-gibility criteria were age (12±17 years), Belgian nationality and residence in the province. The par-ticipants were recruited by a multi-clustered sampling technique. Firstly, twenty-four secondary schools were randomly selected out of the 48 schools in the province. Secondly, a learning option was assigned to each school with probability proportional to the distribution recorded in the province. The Belgian school system has indeed three learning options. The classical curriculum has mainly theoretical courses. The technical curriculum involves some practical courses and the vocational curriculum includes mainly manual courses. The choice of a learning option early on determines thereby the professional orientation and perhaps its corresponding lifestyle. The ultimate phase of the sampling was the random selection of classes as ®nal cluster units. The eligible population had 1826 subjects. A response rate of 83.6% resulted in a total of 1526 participants. Characteristics of the participants are given in Table 1. Seven hundreds and forty-two boys (n=742) and 784 girls participated. Age distributions of the
participants was homogeneous in middle age groups with fewer participants in the youngest and oldest ones. Of the 300 non-respondents, 108 were not at school during the survey and 192 subjects refused to participate. The ®rst reasons put forward were recent medical examination (n = 31), omission of the ap-pointment (n = 24), and parental refusal (n = 19). Ethical approval was secured before hand. Informa-tion letters were sent to directors, parents and ado-lescents. All participants and their parents wrote their consent.
Methods
The survey was carried out in the schools' premises. The interviewers had a peaceful classroom at their disposal for the survey. All interviewers had a medi-cal background (i.e. physiotherapy). They underwent a speci®c training during one week at the beginning of the study. A new training week was scheduled in the middle of the survey period. The adolescents had an individual appointment during the courses period. They ®lled in ®rst a self-administered questionnaire on their smoking and physical activity habits. Smokers were classi®ed as regular smokers (at least one cigarette a day), occasional smokers (at least one cigarette a week) or ex-smokers (smoked but stopped more than one month ago). Details were also ob-tained on the duration and on the usual consump-tion. Questions on usual leisure time physical activity related to sports, to recreational activities and to the journey to school. For each activity the usual weekly frequency and duration was determined and the consequent energy expenditure was calculated. Physical examination included blood pressure (BP), heart rate and anthropometric indices measurement. Blood pressure (mm Hg) was measured following the recommendations of the second Task Force on Blood Pressure in Children and Adolescents [15]. Two ob-servers were in charge of the BP measurement. An in¯ation peak based on the radial pulse was deter-mined by a ®rst cu in¯ation. The blood pressure level was subsequently recorded twice with a standard mercury sphygmomanometer (left arm, subject sit-ting). The size of the cu depended on the size of the upper arm. The ®fth Korotko sound was used for
diastolic blood pressure. Anthropometric indices in-cluded height, weight, skinfolds and circumferences. Measurements were performed by two interviewers according to the guidelines of the World Health Or-ganisation [16]. Height was measured to the nearest centimetre and weight was recorded to the nearest 0.5 kg, with underwear. The body mass index (BMI) was obtained by dividing the weight by the square of the height. Triceps and subscapular skinfolds were measured with a Harpenden calliper to the nearest 0.1 mm. Hip and waist circumferences were measured to the nearest centimetre with a plastic tape. Hip circumference was recorded at the point yielding the maximum circumference over the buttocks. Waist circumference was measured at the point yielding the smaller circumference between the lower rib margin and the iliac crest. Assessment of pubertal status with Tanner staging was not performed given the adverse eect on participation rate. However, girls were asked about menarche and contraceptive use. Quality con-trol procedures for blood pressure and anthropo-metric indices included three types of procedures. First, quality assurance measures included the ob-servers' training, an instruction manual and the daily calibration of equipment. Secondly, inter-rater reli-ability was studied by double measurements per-formed by an external observer on a sub-sample of participants (n = 31). Dierences were analysed using paired t tests. For systolic and diastolic double measurements, all mean dierences between the ex-ternal and the survey observers were non signi®cant. For anthropometric variables, all but one measure-ment (i.e. subscapular skinfold) did not dier signif-icantly between the external and the survey observers. Thirdly, the blood pressure records were also ana-lysed to detect ending digit preferences, occurrence of odd numbers, frequency of very low digits and ab-normally high dierences between two readings made by the same observers. Finally, the quality of the data collected was controlled by a check at data entry and further controls during data processing.
Statistical analyses
Statistical analyses were performed using SASÒ sta-tistical package [17]. Means and standard deviations were computed for continuous parameters and fre-quencies were used for qualitative data. t tests were applied for comparing means of two subgroups and analysis of variance was used for more than two groups. v2tests were used to test the association
be-tween categorical variables. Associations bebe-tween continuous variables were analysed by correlation and multiple regression analyses. Tests for normality were performed and skewed values were log-trans-formed to obtain normal distributions. Models were selected by R-Square and Forward selection proce-dures. Final regression models were computed with the signi®cant variables selected by the stepwise procedures. The relation between a binary dependent
Table 1. Participants: age and gender distribution (number and percentage)
Age (years) Boys Girls
N % N % 12 86 12 96 13 13 155 21 145 18.5 14 138 18.5 119 15 15 130 17 147 18.5 16 139 18.5 139 17.5 17 94 13 138 17.5 All 742 100 784 100
variable and explanatory variables was analysed with logistic regression models.
Results
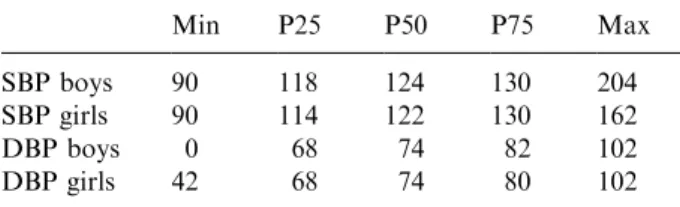
Mean systolic blood pressure (SBP) levels were 125 mm Hg (sd = 12 mm Hg) and 122 mm Hg (sd = 11 mm Hg) for boys and girls, respectively. Mean diastolic blood pressure (DBP) was equal to 74 mm Hg (sd = 10 mm Hg) in both genders. The quartiles and range of SBP and DBP in both genders are presented in Table 2. Eleven percent of the ado-lescents (11.4%, n = 180) had hypertension accord-ing to adult criteria (i.e. exceedaccord-ing 140 mm Hg for systolic blood pressure or 90 mm Hg for diastolic blood pressure). Blood pressure values by age and gender are illustrated in Figure 1. Systolic blood pressure level diered signi®cantly between genders (mean dierence = 3.4 mm Hg; 95% con®dence in-terval (CI): 2.2±4.6 mm Hg). This dierence ap-peared from 15 years onwards, with mean dierence values equal to 5 mm Hg in 15 and 16 year-olds and equal to 9 mm Hg in 17-year olds. Mean diastolic blood pressure level did not dier signi®cantly be-tween genders, neither in separate age groups nor for all ages combined. Systolic blood pressure increased with age as shown by signi®cantly positive correlation coecients (Table 3). The rise was more marked for boys than for girls (r = 0.32 and r = 0.07, respec-tively). DBP increase with age was less important but correlation coecients were also statistically signi®-cant (r = 0.07 and r = 0.12 for girls).
Mean BMI values were 20.5 and 21.0 for boys and girls, respectively (95% CI for the dierence: 0.15± 0.85). BMI increased also signi®cantly with age in both genders (Figure 2). The stabilisation of girls'
weight at 16 years coupled with their slower growth velocity gave a ¯at curve in the oldest age groups. Conversely, for boys, height and especially weight were still increasing at 17 years and a larger increment was noted at the end of their BMI curve. Subscapular and triceps skinfolds assessed central and peripheral fatness, respectively. Mean triceps skinfolds values were 11.6 mms for boys and 16.3 mms for girls (mean dierence = 4.7 mms; 95% CI: 4.1±5.3 mms). Mean subscapular skinfolds values were 9.1 mms and 12.5 mms for boys and girls, respectively (mean dif-ference = 3.4 mms; 95% CI: 2.9±3.9 mms). In girls, both skinfolds increased signi®cantly with age (r = 0.19 and r = 0.11 for triceps and subscapular skinfolds, respectively). For boys, triceps skinfold decreased and subscapular skinfold increased with age signi®cantly (r = )0.11 and r = 0.07, respec-tively). Waist-to-hip ratio (WHR) according to age exhibited also a dierent pattern in boys and girls. For boys, waist and hip girths increased in parallel and their ratio did not change much during puberty (0.81 to 0.83). For girls, a highly signi®cant decrease with age in the ratio was explained by the waist cir-cumference increase, inferior to the hip circir-cumference change. Mean WHR at the end of puberty was more favourable in girls than in boys (0.73 versus 0.81).
One ®fth of the adolescents (19.8%, n = 302) were occasional or regular smokers. Smoking prevalence
Table 2. Systolic and diastolic blood pressure quartiles (mm Hg) Min P25 P50 P75 Max SBP boys 90 118 124 130 204 SBP girls 90 114 122 130 162 DBP boys 0 68 74 82 102 DBP girls 42 68 74 80 102
Figure 1. Blood pressure: pattern with age.
Table 3. Correlations between blood pressure and body fatness indices (r values)
Age Heart rate Weight Height BMI Triceps Subscap WHR SBP boys 0.32*** 0.09** 0.41*** 0.34*** 0.33*** 0.08* 0.19*** ns SBP girls 0.07* 0.25*** 0.25*** 0.16*** 0.22*** 0.14*** 0.16*** ns DBP boys 0.07* 0.10** 0.09** ns 0.12*** 0.14*** 0.14*** 0.17*** DBP girls 0.12*** 0.13*** 0.14*** 0.11** 0.12*** 0.14*** 0.16*** ns *p < 0.05; **p < 0.01; ***p < 0.001; ns = non-signi®cant results.
SBP = systolic blood pressure; DBP = diastolic blood pressure; BMI = body mass index; Triceps = triceps skinfold; Subscap = subscapular skinfold; WHR = waist-to-hip ratio.
was similar in both genders. Conversely, leisure time physical activity diered between genders. Boys and girls spent a mean of 8.2 and 5.2 hours every week in physical activity (including light activities as walk-ing).
Relationships between BP and anthropometric in-dices were analysed by correlation analyses (Table 3). Correlation analyses were performed ®rstly in smok-ers and non-smoksmok-ers separately as the smoking status could have in¯uenced the relation between blood pressure and the other variables. However, results in both subgroups were similar and the ®gures presented in the table refer therefore to the whole sample. Signi®cant associations were found between SBP and age, heart rate, DBP and anthropometric indices (except WHR). Diastolic blood pressure was similarly positively associated with age, heart rate and anthro-pometric variables.
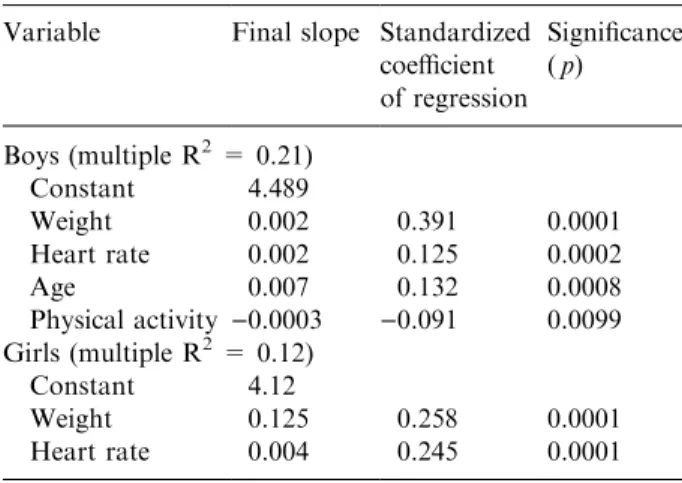
Stepwise regression analyses were computed with systolic and diastolic blood pressure as dependent variables. Age, heart rate, anthropometric indices and physical activity were independent parameters. The ®nal SBP models are presented in Table 4. The models under study explained a small proportion of the BP variance. For SBP in boys, positive signi®cant associations were found for weight, age and heart rate whereas physical activity exhibited a negative relationship. Similar results were found for girls ex-cept for age and physical activity. DBP models are displayed in Table 5. In boys, signi®cant associations were found with WHR and triceps skinfold whereas weight did not enter the model. The variables sig-ni®cantly associated with DBP in girls were age and subscapular skinfold. Models were computed sepa-rately with other body fatness indices as explanatory variables (e.g. BMI). None of them improved the ®-nal characteristics of the model and in particular the ®nal multiple R2 value (Table 6). Finally, the
asso-ciation between hypertension and other determinants was also analysed using a logistic regression analysis. The outcome variable was the presence or absence of
hypertension as de®ned above. In both genders, the variables signi®cantly associated with hypertension were age (odds ratio (OR): 1.33 for boys and 1.22 for girls), heart rate (OR:1.10 for boys and 1.12 for girls) and body fatness (weight for boys, OR: 1.16 and BMI for girls, OR: 1.08).
The in¯uence of menarche and contraceptive use on blood pressure was analysed in girls from the same age group. In 12±13-year olds, systolic blood pressure level was higher for menstruating than for non-menstruating girls. However, the dierence disap-peared after taking into account their higher weight (54 kg versus 45 kg) and BMI (21.2 versus 18.7). In the 15±17-year old age group, systolic and diastolic blood pressure did not dier between oral contra-ceptive users and non-users after taking into account body fatness.
Discussion
Blood pressure levels recorded in adolescents from the province of Luxembourg were higher than those observed in adolescents from the USA or other Eu-ropean countries, although similar to those recorded in another sample of Belgian adolescents [18±24].
Table 4. Multiple regression analyses for systolic blood pressure (SBP)
Variable Final slope Standardized coecient of regression Signi®cance ( p) Boys (multiple R2= 0.21) Constant 4.489 Weight 0.002 0.391 0.0001 Heart rate 0.002 0.125 0.0002 Age 0.007 0.132 0.0008 Physical activity )0.0003 )0.091 0.0099 Girls (multiple R2= 0.12) Constant 4.12 Weight 0.125 0.258 0.0001 Heart rate 0.004 0.245 0.0001
Table 5. Multiple regression analyses for diastolic blood pressure (DBP)
Variable Final slope Standardized coecient of regression Signi®cance ( p) Boys (multiple R2= 0.04) Constant 5.549 Waist/hip ratio 0.410 0.137 0.0002 Triceps skinfold 0.040 0.119 0.001 Girls (multiple R2= 0.04) Constant 5.743 Subscapular skinfold 0.379 0.152 0.0001 Age 0.056 0.093 0.001
Table 6. Final multiple R2values of models including other
body fatness indices Body fatness
variables SBPBoys SBPgirls DBPboys DBPgirls Weight 0.21 0.13 0.03 0.03 BMI 0.20 0.12 0.02 0.03 BMI > P90 0.15 0.09 0.04 0.03 Triceps skinfold 0.13 0.08 0.04 0.02 Subscapular skinfold 0.15 0.10 0.03 0.04
Methodological problems are unlikely given the concordance between internal and external observers during quality control procedures. The second and most plausible explanation for high blood pressure levels observed is the current body fatness increase in young people. High BP level in adolescents from the province of Luxembourg might be explained by a worsening of the cardiovascular risk pro®le in youth during the last decade. This observation is not speci®c to Belgium. In comparison with a few years ago, the adolescents from the Young Finns Study exhibit a worse lipoprotein pro®le, higher obesity indices ex-ercise less and have a worse diet [25]. The Bogalusa Study similarly observed an increase in participants' body fatness between successive young cohorts [26]. The available comprehensive data on blood pressure of European adolescents come from studies con-ducted in the eighties. The blood pressure level of these populations might have also increased during the last decade as far as their body fatness indices have also increased. Finally, speci®c genetic charac-teristics of the population are a plausible explanation for the high BP recorded in this sample. This point is corroborated by similar results in adults and children from the same province [13±14].
High anthropometric indices were recorded in this survey. BMI values of adolescents in the province of Luxembourg were compared to British and French percentiles [27±28]. One quarter of the Belgian ado-lescents (27% of the boys and 24% of the girls) had a higher BMI than the 90th percentile of the French distribution. The percentages were somewhat lower when compared to British percentiles (i.e. respectively 20% of boys and 18% of girls were above the 90th British percentile). In any case, the population from the Belgian province of Luxembourg had about twice as many adolescents exceeding the upper percentile. The choice of a cut-o point based on a percentile to de®ne adolescent obesity (as suggested by the WHO) raises therefore a problem in the province of Lux-embourg where fatness indices are high [29]. A high prevalence of obesity was also found in adults and children from the same province [13, 14]. As an il-lustration, the prevalences of overweight or obesity were 45% and 59% in male and female adults, re-spectively.
The correlation analysis showed a signi®cant rela-tionship between blood pressure and body fatness indices. However, in the regression analysis, the small size of regression coecients highlighted the fact that a large part of blood pressure variability was unex-plained by age, body fatness and physical activity. A ®rst hypothesis is that weight was not an appropriate parameter for assessing body fatness. Introducing other anthropometric indices in the models tested this hypothesis but these changes did not improve the ®nal equation characteristics. The second hypothesis is that genetic and family factors contributed to the high blood pressure levels found in this young
population as suggested by the high incidence of cardiovascular disease in adults of the province. The Muscatine, Dunedin and Nottingham studies [30±32] demonstrated the role of a positive family history in the child blood pressure level. A study conducted in families with natural and adopted children estimated that shared genes accounted for 61% of the variance whereas a shared environment explained the remain-ing 38% [33]. Further studies should be useful to identify family and genetic components that con-tribute to the elevated blood pressure level in the province of Luxembourg.
Blood pressure was associated with body fatness in both genders. The positive relationship between body fatness variables and blood pressure has been widely demonstrated in cross-sectional and longitudinal surveys [10±12, 23, 32]. In regression analyses, weight was the ®rst SBP determinant as in other surveys conducted in Belgium and in the USA [23, 34]. For DBP, skinfolds were ®rst selected. The selection of body fatness variables other than BMI is explained by the fact that BMI not only re¯ects body fatness but also lean body mass index [35]. In the longitudi-nal Amsterdam Growth and Health survey, correla-tion analyses showed indeed that BMI (but not skinfolds) had a signi®cant correlation with lean body mass in all age and gender groups from 13 to 27 years of age [36].
Heart rate was signi®cantly positively related to blood pressure level, especially in girls. This positive association was found in some other studies but few hypotheses were suggested to explain this phenome-non [37±38]. In the Bogalusa study, participants were categorised according to their heart rate: hyperdy-namic status was signi®cantly associated with high levels of systolic blood pressure, body fatness, insulin and low HDL-cholesterol levels. The authors sug-gested that a hyperdynamic state could be an early feature of an insulin resistance syndrome. An alter-native explanation could be the sympathetic nervous response to examination stress, particularly in girls.
A weak negative association between physical ac-tivity and blood pressure was found in boys only. For girls, the negative correlation found between diastolic blood pressure and physical activity disappeared in the regression analysis. Age acted as a confounder, positively associated with girls' diastolic blood pres-sure and negatively with physical activity. In boys, the inverse relationship between physical activity and systolic blood pressure was similar to observations in adult populations [39, 40]. In adolescents, the bene®-cial eect of physical activity on blood pressure was demonstrated in intervention studies but the evidence was more dicult to show in population studies where eects were moderate or non-signi®cant [41±44].
A signi®cant correlation was also found between blood pressure and height. The Panel of the Task Force on Blood Pressure in Children speci®ed that their recommendations based on age were not
applicable for children whose height exceeded the 90th percentile of the distribution [15]. However, in the multiple regression analysis, in¯uence of height disappeared after taking into account body fatness. St George [21] and A. Saint-Remy [37] found also a non signi®cant association between blood pressure and height after controlling for age and weight.
WHR did not show any relationship with blood pressure, except with DBP in boys [45, 46]. This observation corroborated the negative outcomes of other adolescent studies [5, 7]. This lack of agreement might be explained by four factors. First, technical variability induces variations in anthropometric measurements [47]. However, the greatest dierences found among interviewers related to skinfolds measures. Secondly, body fat distribution `types' are not so well de®ned in youth as in adults. Thirdly, the variables used to de®ne central fatness might dier in children and in adults. In younger subjects, visceral fatness is mainly retroperitoneal and techniques valid in older populations are not applicable [48]. Finally, a time lag is needed before the onset of a link between body fat distribution and cardiovascular risk factors.
Conclusion
This study con®rmed the underlying suspicion of high blood pressure and body fatness indices in adoles-cents selected from a Belgian high cardiovascular risk population. Adolescence is a key period where car-diovascular risk factors emerge, as well as dierences between genders. Lifestyle, physical and physiological changes during puberty entail gender dierences in cardiovascular risk factor levels, e.g. a lower blood pressure and a more favourable body fatness pattern in girls than in boys. These dierences might be the ®rst step towards the well-known later dierential cardiovascular morbidity.
The present data showed a clear but moderate role of body fatness in the level of blood pressure in youth. Unfortunately, no reliable criterion exists to-day for de®ning the blood pressure and body fatness levels above that the risk of future cardiovascular disease signi®cantly increases. Follow-up studies are therefore needed to elucidate this question.
A further problem is to establish which adolescents will eectively become adults at risk and ultimately, who will suer from cardiovascular disease. The question clearly does not have an easy answer, but the inescapable conclusion that emerges from the known tracking of blood pressure and body fatness is that from a public health point of view, high risk adolescents are the ®rst candidates for becoming to-morrow's adults with atherosclerotic disease. One of the most eective ways to improve the future is to foster health promotion interventions in youth. In-terventions in children and adolescents have been
found eective for improving lifestyle habits, i.e. diet and physical activity. However, the results on cho-lesterol and blood pressure level dier between studies [49±51]. Further research should con®rm the fact that the changes induced by the interventions will persist in adulthood. The challenge is the early in-troduction of a lifelong healthy lifestyle susceptible to decrease the cardiovascular disease incidence in the long run.
References
1. Labarthe DR, Eissa M, Varas C. Childhood precursors of high blood pressure and elevated cholesterol. Annu Rev Publ Health 1991; 12: 519±541.
2. Bao W, Threefoot SA, Srinivasan SR, Berenson GS. Essential hypertension predicted by tracking of elevat-ed blood pressure from childhood to adulthood: The BOGALUSA Heart Study. Am J Hypertens 1995; 8: 857±865.
3. Lauer RM, Clarke WR, Mahoney LT, Witt J. Child-hood predictors for high adult blood pressure: The Muscatine Study. Pediatr Clin North Am 1993; 40: 23±39.
4. Yong LC, Kuller LH. Tracking of blood pressure from adolescence to middle age: The Dormont High School Study. Prev Med 1994; 23: 418±426.
5. Beckett L, Rosner B, Roche A, Guo S. Serial changes in blood pressure from adolescence into adulthood. Am J Epidemiol 1992; 135: 1166±1177.
6. Sangi H, Mueller W, Harrist R, Rodriguez B, Grun-baum JA, Labarthe DR. Is body fat distribution as-sociated with cardiovascular risk factors in childhood? Ann Hum Biol 1992; 19: 559±578.
7. Smoack C, Burke G, Webber LS, Srinivasan SR, Berenson GS. Relation of obesity to clustering of car-diovascular disease risk factors in children and young adults. Am J Epidemiol 1987; 125: 364±372.
8. Moussa MA, Skail MB, Selwanes SB, Yaghy OY, Bin-othman SA. Contribution of body fat and fat pattern to blood pressure level in school children. Eur J Clin Nutr 1994; 48: 587±590.
9. Lusky A, Barell V, Lubin F, Kaplan G, Layani V, Shohat Z, Lev B, Wiener M. Relationship between morbidity and extreme values of body mass index in adolescents. Int J Epidemiol 1996; 25: 829±834. 10. Jenner D, Vandongen R, Beilin L. Relationships
be-tween blood pressure and measures of dietary energy intake, physical ®tness and physical activity in Aus-tralian children aged 11±12 years. J Epidemiol Com-munity Health 1992; 46: 108±113.
11. Rorive G, Saint-Remy A, Gueubelle F. La pression arteÂrielle chez l'adolescent: Approche eÂpideÂmiologique. Bull Acad Roy Med Belg 1989; 144: 260±270. 12. Clarke WR, Woolson R, Lauer RM. Changes in
pon-derosity and blood pressure in childhood: The Mus-catine Study. Am J Epidemiol 1986; 124: 195±206. 13. Brohet C, Janssens D, Beck D, Hannut R, Kulbertus
H, Lavenne F, Lefebvre P, Rorive G, Jeanjean M. Cardiovascular risk factors in a sample of a rural Bel-gian population: The Bellux Monica Study. Acta Med Scand 1988; 728(Suppl): 129±136.
14. Guillaume M. Children in the Province of Luxembourg: An epidemiological study of the cardiovascular risk factors and their determinants [Dissertation]. UCL School of Public Health, Brussel, 1994: 149pp. 15. Task force on blood pressure in children. Report of the
second task force on blood pressure control in children. Pediatrics 1987; 79: 1±24.
16. World Health Organisation ± Regional Oce for Eu-rope. Measuring obesity ± Classi®cation and descrip-tion of anthropometric data. Report on a WHO Consultation on the Epidemiology of Obesity. Geneva: WHO, 1988: 22pp.
17. SAS Institute Publications. SASÒ langage and
proce-dures: Usage, version 6, 1st edn. Cary, NC: SAS Institute Inc., 1989.
18. Uhari M. Evaluation of the measurement of children's blood pressure in an epidemiological multicentre study. Acta Paediatr Scand 1985; 318(Suppl): 79±88. 19. Berenson GS. Causation of cardiovascular risk factors
in children. New York: Ravenpress, 1985: 165±170. 20. Brotons C, Singh P, Nishio T, Labarthe DR. Blood
pressure by age in childhood and adolescence: A review of 129 surveys worldwide. Int J Epidemiol 1989; 18: 824±829.
21. ST George IM. Blood pressure in Dunedin children [Dissertation]. Wellington School of Medicine, New Zealand, 1992: 40±48.
22. De Man S, Andre JL, Bachmann H, Grosbee D, Ibsen K, Laaser U, Lippert P, Hofman A. Blood pressure in childhood: Pooled ®ndings of six European studies. J Hypertens 1991; 9: 109±114.
23. Saint-Remy A, Rorive G, Gueubelle F. La pression arteÂrielle chez l'adolescent: Tables de reÂfeÂrence con-cernant la population lieÂgeoise. Revue Med LieÂge 1992; 47: 17±24.
24. Irgil E, Erkenci Y, Aytekin N, Aytekin H. Prevalence of hypertension among schoolchildren aged 13±18 years in Gemlik, Turkey. Eur J Public Health 1998; 8: 176±178.
25. Porkka KV, Raitakari OT, Leino A, Laitinen S, Ra-sanen L, Ronnemaa T. Trends in serum lipid levels during 1980±1992 in children and young adults. The Cardiovascular Risk in Young Finns Study. Am J Epidemiol 1997; 146: 64±77.
26. Shear C, Freedman DS, Burke G, Harsha D, Webber LS, Berenson GS. Secular trends in obesity in early life: The Bogalusa Heart Study. Am J Public Health 1988; 78: 75±77.
27. Cole TJ, Freeman JV, Preece MA. Body mass index reference curves for the UK, 1990. Arch Dis Child 1995; 73: 25±29.
28. Rolland-Cachera MF, Cole TJ, Sempe M, Tichet J, Rossignol C, Charraud A. Body mass index variation: Centiles from birth to 87 years. Eur J Clin Nutr 1991; 45: 13±21.
29. World Health Organisation. Physical status: the use and interpretation of anthropometry. Geneva: WHO Technical Reports, 1995; 854: 263±311.
30. Lauer RM, Clarke WR, Mahoney LT, Witt J. Child-hood predictors for high adult blood pressure: The muscatine Study. Pediatr Clin North Am 1993; 40: 23±39.
31. St George IM, Williams S, Silva PA. Blood pressure level, trend and variability in Dunedin children ± An
8-year study of a single birth cohort. Circulation 1990; 82: 1675±1680.
32. Horn NY, Watson AR, Coleman JE. Hypertensive adolescents detected by a school surveillance pro-gramme: A problem of obesity. J Hum Hypertens 1994; 8: 319±321.
33. Schieken RM. Genetic factors that predispose the child to develop hypertension. Pediatr Clin North Am 1993; 40: 1±11.
34. Harlan W, Cornoni-Huntley J, Leaverton P. Blood pressure in childhood ± The National Health Exami-nation Survey. Hypertension 1979; 1: 559±565. 35. Garn S, Leonard W, Hawtorne V. Three limitations of
body mass index. Am J Clin Nutr 1986; 44: 996±997. 36. Twisk JW, Kemper HC, Mellenbergh GY,
Vanmec-helen W, Post GB. Relation between the longitudinal development of lipoprotein levels and lifestyle param-eters during adolescence and young adulthood. Ann Epidemiol 1996; 6: 246±256.
37. Saint-Remy A. Signi®cation de la pression arteÂrielle eÂleveÂe chez l'adolescent. Approche eÂpideÂmiologique [Dissertation]. Universite de LieÂge, 1989. 199pp. 38. Jiang X, Srinivasan SR, Urbina E, Berenson GS.
Hy-perdynamic circulation and cardiovascular risk in children and adolescents ± The Bogalusa Heart Study. Circulation 1995; 91: 1101±1106.
39. Fagard RH. Prescription and results of physical activ-ity. J Cardiovasc Pharmacol 1985; 25(Suppl 1): S20± S27.
40. Puddey IB, Cox K. Exercise lowers blood-pressure ± sometimes? Or did Pheidippides have hypertension? J Hypertens 1995; 13: 1229±1233.
41. Andersen LB. Blood pressure, physical ®tness and physical activity in 17-year-old Danish adolescents. J Intern Med 1994; 236: 323±329.
42. Tell G, Vellar O. Physical ®tness, physical activity and cardiovascular disease risk factor in adolescents: The Oslo Youth Study. Prev Med 1988; 17: 12±24. 43. Strazzulo P, Cappuccio F, Trevisan M, De Leo A,
Krogh V, Giorgione N, Mancini M. Leisure-time physical activity and blood pressure in school children. Am J Epidemiol 1988; 127: 726±733.
44. Jenner D, Vandogen R, Beilin L. Relationships be-tween blood pressure and measures of dietary energy intake, physical ®tness and physical activity in Aus-tralian children aged 11±12 years. J Epidemiol Com-munity Health 1992; 46: 108±113.
45. BjoÈrntorp P. The associations between obesity, adipose tissue distribution and disease. Acta Med Scand 1988; 723(Suppl): 121±134.
46. Reichley K, Mueller W, Hanis C, Joos S, Tulloch B, Barton S, Schull W. Centralized obesity and cardio-vascular disease risk in Mexican Americans. Am J Epidemiol 1987; 125: 373±386.
47. Klipstein-Grobusch K, Georg T, Boeing H. Interviewer variability in anthropometric measurements and esti-mates of body composition. Int J Epidemiol 1997; 26(Suppl): S174±S180.
48. Van der Kooy K, Seidell J. Techniques for the mea-surements of visceral fat: A practical guide. Int J Obes 1993; 17: 187±196.
49. Webber LS, Osganian SK, Feldman HA, Wu M, McKenzie TL, Nichaman M, Lytle LA, et al. Cardio-vascular risk factors among children after a 21
intervention ± The CATCH Study. Prev Med 1996; 4: 432±441.
50. Vandongen R, Jenner DA, Thompson C, Taggart AC, Spickett EE, Burke V, Beilin LJ, et al. A controlled evaluation of a ®tness and nutrition intervention pro-gram on cardiovascular health in 10- to 12-year-old children. Prev Med 1995; 1: 9±22.
51. Harrell JS, Gansky SA, McMurray RG, Bangdiwala SI, Frauman AC, Bradley CB. School-based interven-tions improve heart in children with multiple
cardio-vascular disease risk factors. Pediatrics 1998; 102: 371±380.
Address for correspondence: Dr D. Paulus, Scienti®c Insti-tute of Public Health, 14, Juliette Wytsmanstreet, 1050 Brussels, Belgium
Phone: +32 2 26425111; Fax: +32 2 26425410 E-mail: dominique.paulus@iph.fgov.be