This item is the archived peer-reviewed author-version of:
BRAIN-TRAINS : macro-economic impact of rail freight in Belgium : what can be
the future added value?
Reference:
Troch Frank, Vanelslander Thierry, Sys Christa, Tawfik Christine, Mostert Martine, Limbourg Sabine, Merchan Angel, Belboom Sandra, Léonard Angélique, Stevens Vidar, ....- BRAIN-TRAINS : macro-economic impact of rail freight in Belgium : what can be the future added value?
BRAIN-TRAINS: ECONOMIC IMPACT OF RAIL FREIGHT TRANSPORT
IN BELGIUM:
WHAT CAN BE THE FUTURE ADDED VALUE?
Frank Troch
Thierry Vanelslander
Christa Sys
University of Antwerp, Department of Transport and Regional Economics
Christine Tawfik
Martine Mostert
Sabine Limbourg
University of Liège, Research Centre in Quantitative Methods and Operations
Management
Angel Merchan
Sandra Belboom
Angélique Léonard
University of Liège, Department of Chemical Engineering, “Products, Environment,
Processes”
Vidar Stevens
Koen Verhoest
University of Antwerp, Department of Political Science
1.
INTRODUCTION
The BRAIN-TRAINS project deals with the possible development of rail freight intermodality in Belgium. The main goal of the project is to develop a blue print establishing the detailed criteria and conditions for developing an innovative intermodal network in and through Belgium, as part of the Trans-European Transport Network and related to different market, society and policy-making challenges. The project will develop an operational framework in which effective intermodal transport can be successfully established in Belgium, with attention to beneficial participation and commitment of all different stakeholders.
The present deliverable, ‘Scenario 1 - Best-case’, is the first text in a series of three deliverables within Work Package 3 (WP 3): Macro-economic impact of rail freight transport in Belgium. The objective of this WP is to quantify clear macro-economic indicators, such as employment, added value and investments, in the field of rail freight transport in Belgium, under different scenarios. This deliverable follows the approach set out in Deliverable 3.1 (Troch, Vanelslander & Sys, 2016). Within this deliverable, it was found that both economic growth and transport growth share a strong mutual connection. Hence, this finding confirms the importance of understanding and measuring the relationship between rail freight transport and the national economy. As such, this insight will help decision makers and policy makers understand complex managerial problems in the field of rail transport development, by translating them into a quantified approach. These stakeholders can then use the outputs of this analysis to make a better development decision.
The next step is to apply the instruments that allow measuring the impact of rail freight transport on the Belgian economy, with rail transport also being a part of the intermodal
attempting to forecast the exact events that the future of rail transport development might hold. The main purpose of the developed scenarios is to merely explore what the impact would be under a certain set of events, and to determine the relationship between certain macro-economic indicators and rail transport development in Belgium.
- By further developing and applying the methodology explained in deliverable 3.1, the main components of this deliverable will consist of:
- Finalizing the approach and building the input-output framework for rail freight in Belgium.
- Presenting the results and discussing their significance and interpretation context. - Translating the best-case scenario to the obtained output.
- Setting a path for further research in the next WP3 deliverables.
Throughout this deliverable, the data collection process and the final creation of an input-output framework for rail freight transport in Belgium will be discussed in section 1. This section will also include the used assumptions, highlighting the importance of prudence when interpreting the obtained results. Section 2 continues by presenting and discussing the results of the application of the input-output framework on the obtained data. It is in this section that the developed approach will be interpreted according to the best-case scenario. A strong focus is put on the exploration of direct and indirect macro-economic effects of rail freight transport. Section 3 highlights the next steps for the macro-economic impact research, by presenting a new triptych for the continuation of this research. The deliverable finishes with a short conclusion in the last section.
2.
MODELLING APPROACH
In this first section, the approach from Deliverable 3.1 (Troch, Vanelslander & Sys, 2016) will be further developed. Within this deliverable, the general methodology for an input-output approach has been explained, as well as the application of the Leontief multiplier to an input-output matrix. This section will use the explored general theoretical base from Deliverable 3.1 to build an adapted theoretical framework where rail freight transport sector in Belgium is included in a separate row and column in the existing national input-output matrix. The results will be discussed in the next section, together with the corresponding Leontief multiplier which is calculated by the stated formulas and definitions in Deliverable 3.1.
2.1
DATA COLLECTION
The analysis is starting from the national input-output table for the Belgian economy of 2010, which was published by the Federal Planning Office (2013) . This document contains the supply table of 2010 in basic prices, corrects the demand table of 2010 in buying prices towards basic prices, and calculates a 64x64 input-output matrix based upon these data, showing details for 64 NACE code related sectors. Rail freight transport is included in the sector with NACE code 49, comprising all land transport (rail, truck, metro, bus, car, pipes, ..), including both passenger and freight transport. Within Deliverable D 3.1, the Leontief multipliers for these 64 sectors have been calculated and will be used in the next section for a comparison analysis with the newly developed framework.
The supply and demand tables for the Belgian economy are published annually, with a delay of three years. The most recent version of supply and demand tables available was published by the National Bank of Belgium (2016) and presents the demand and supply data of 2013. Limitations of the data are twofold, first the problem that the import
transactions are included within the demand table and cannot be filtered, and secondly no corrections are made for translating the buying prices into basic prices. Therefore, it has been decided, taking into account these limitations, that an adapted approach had been adopted by using the most detailed version available for the current analysis, being the revised version of the supply and demand table of 2010, published by the Federal Planning Office in 2013. The next detailed version will take into account 2015 and is expected to be published in December 2018.
As discussed in the previous deliverable D 3.1, the national input-output table can be used to split the existing NACE code 49 into two parts: one part representing the rail freight transport and the remaining part representing all other remaining land transport. This approach is based on the procedure adopted by Coppens et al. (2007) for analysing the economic impact of the port of Antwerp.
To perform this analysis, data also had to be acquired from rail freight operators in Belgium. A partnership with the National Bank of Belgium, the Federal Planning office and B Logistics has been set-up, in order to obtain the necessary data. Given the sensitive nature of the data, it is not publicly available and can only be acquired from the industry itself. Therefore, B Logistics, the incumbent rail freight operator in Belgium, has provided this research with all necessary detailed customer and supplier transactions data of 2011. This data includes the VAT number of each customer and supplier, which is used to link this company to the corresponding primary NACE code, as well as the total sales (customers) and purchases (suppliers) in monetary values. Data is acquired for all three individual departments from B Logistics, including Xpedys and Inter Ferry Boats. Xpedys is mainly performing the conventional rail freight operations, while Inter Ferry Boats is mainly performing container and intermodal operations. Company data from 2010 is not available, as within that year, B Logistics was still a department of the SNCB holding structure, performing both rail freight transport and passenger operations within the same group.
A criticism for this approach could be that the use of data from only one rail freight operator would limit the conclusions that can be drawn from this analysis. However, Figure 1 shows that B Logistics holds a significant market share of 88.2% in 2010, measured in royalties paid for actual train-kilometres travelled. Main competitors on the Belgian market were Crossrail (6.3 %), Captrain (4.3 %) and Trainsport (1.2 %).
Figure 1: Railway freight market share in Belgium, based on royalties paid for actual train kilometres travelled
SOURCE:DEVILLE &VERDUYN (2012)
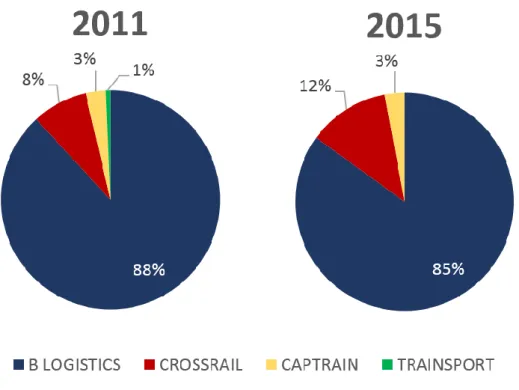
As within this analysis data from B Logistics from 2011 is used, a similar graph has been created based on the revenue data collected in Belfirst, an official database of public financial information from Belgian companies created by Bureau van Dijk Electronic Pubishing (2017). A similar analysis has been made for the most recent data available, being the fiscal year 2015, to show the most current evolution on the market. As the market was liberalized in 2007, it can be assumed that price competition exists and therefore revenue is a good reflection of the actual tonkilometers performed by the rail companies. The results are shown in figure 2. It can be noticed that B Logistcs continues to hold its dominant position with a market share of 88% in 2011 and 85% in 2015, measured in yearly revenue. Crossrail remains the main competitor with a market share of respectively 8% and 12%. Therefore, it can be concluded that, by only using the data of the incumbent rail freight operator in Belgium, still a significant representation of the Belgian rail freight market is covered, and therefore valid conclusions can be drawn from the obtained results.
SOURCE:OWN COMPOSITION
In the continuation of this deliverable, it should be noted that when NACE code 49 is split within the existing national input-output table, and consequently the Leontief multiplier for rail freight in Belgium is calculated, it is actually the input-output relations and the Leontief multiplier for B Logistics which is estimated, as a significant representation of the Belgian rail freight operators sector. B Logistics has agreed with the publication of this data, in aggregated form, although caution should always be used when interpreting the results, and confidentiality should be applied where necessary.
2.2
BUILDING THE INPUT-OUTPUT TABLE FOR RAIL FREIGHT
TRANSPORT IN BELGIUM
In this sub-section, the development process of the theoretical input-output table will be explained. This has been done within the cooperation with the National Bank of Belgium (2016) and the Federal Planning Office (2016), where different meetings have led to a continuous development towards the final and validated framework that was applied to the data from the previous sub-section and from which the results will be presented in the next section.
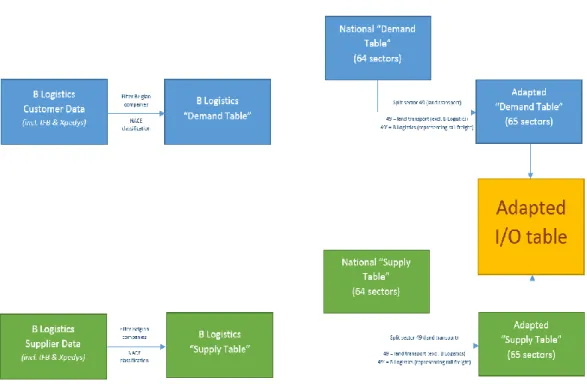
Figure 3: Process to create a separate sector in the national input-output table with customer and supplier data from 1 company
SOURCE:OWN COMPOSITION
To adapt the methodology proposed in Deliverable 3.1 to the detailed level of rail freight transport in Belgium, visualized in figure 3, the customer and supplier data obtained from the incumbent rail freight operator in Belgium has been adapted by selecting only companies with a Belgian VAT number and as such separating export and import transactions from the national transactions. In a next step, these Belgian companies have been distributed according to their primary NACE code by using the platform ‘Kruispuntbank van Onderneming’ (FOD Economie, K.M.O., Middenstand en Energie, 2016). This resulted in a national demand table and a national supply table for B Logistics with data of 2011. These columns were deducted from the existing column of NACE code 49, land transport, in the national demand and supply tables of 2010, creating 65 sectors instead of 64. These adapted national demand and supply tables have then been used to recalculate an adapted 65x65 input-output matrix. The newly created sector 49’ characterizes the rail freight transport market, represented by the incumbent rail freight operator B Logistics. The adapted sector 49 represents all other remaining land transport, including rail freight transport offered by the remaining competitors.
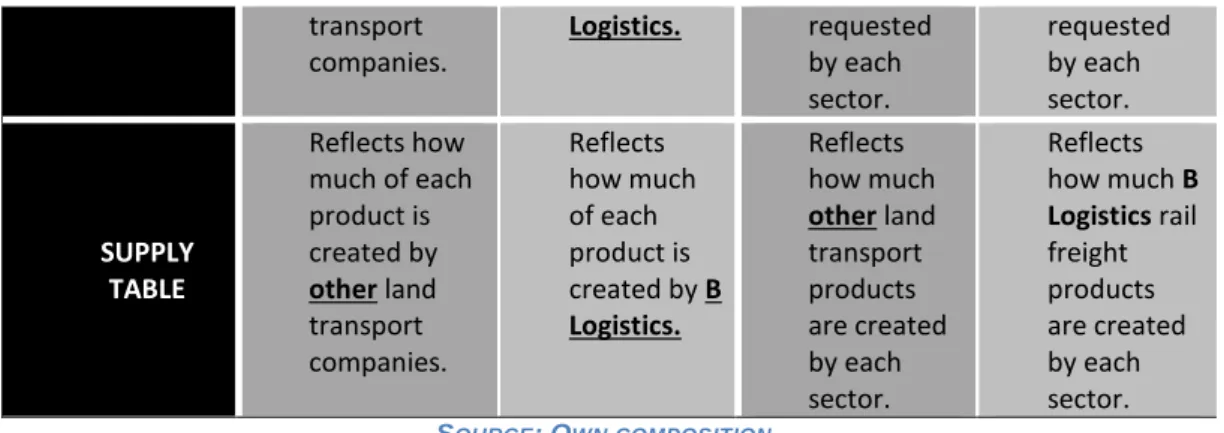
Till here, only sectors (columns) have been taken into account, while demand and supply tables also show products on the different rows that must be taken into account. As such, an additional split has been made for the demand and supply table of 2010, where columns and rows have been split according to the rules in table 1.
Table 1: Taking into account sectors and products
COLUMNS ROWS
Sector 49 Sector 49’ Row 49 Row 49’’
DEMAND TABLE Reflects all products requested by other land Reflects all products requested by B Reflects other land transport products Reflects B Logistics rail freight products
transport companies. Logistics. requested by each sector. requested by each sector. SUPPLY TABLE Reflects how much of each product is created by other land transport companies. Reflects how much of each product is created by B Logistics. Reflects how much other land transport products are created by each sector. Reflects how much B Logistics rail freight products are created by each sector. SOURCE:OWN COMPOSITION
Furthermore, it was noticed that the subsidiaries of B Logistics, being Xpedys and Inter Ferry Boats, are not taken into account in the sector with NACE code 49, but have NACE code 52 as a primary NACE classification in the national input-output table, identifying them as companies with transport supporting activities. As such, the data of these two subsidiaries cannot be deducted from the original columns (sector) and rows (product) with NACE identification 49, but should be deducted from the respective column (sector) and row (product) with NACE identification 52 instead. This has led to the final theoretical tables for separating the impact of B Logistics, representing the rail freight operations, within the national demand and supply tables, and as such also in the final input-output matrix. These are shown in tables 2 and 3.
2.2.1 ADAPTED NATIONAL DEMAND TABLE
Table 2 shows the steps to be taken in order to translate the obtained customer and supplier data from B Logistics, representing the rail freight transport activities in Belgium, into the existing national demand table and as such create a separate sector (column) and product (row) based on this data for this representation.
To create a separate sector (column) starting from the national demand table, first, the supplier transactions of B Logistics are used to deduct the demand for each product type from column 49 into column 49’. The original column 49 is now addressed as column 49*, including all remaining land transport companies. An example of this operation is shown in table 2 by (a), which reflects the demand of a product type from 1 to 48 by B Logistics. This is reflected by the supplier data from B Logistics, showing how much of this product, such as for example electricity, has been bought. Column 49 is then deducted with the same amount for this product, leaving the total demand within the national economy intact.
SOURCE:OWN COMPOSITION
Secondly, the supplier transactions of IFB and Xpedys are taken into account and deducted from the national demand for each product type from column 52 into column 52’. The original column 52 is now addressed as column 52*, including all remaining companies with transport supporting activities. An example of this operation is shown in table 2 by (b), which reflects the demand of a product type from 1 to 48 by Xpedys and IFB. This is reflected by the supplier data from IFB and Xpedys, showing how much of this product has been bought. For analysis purposes, columns 49’ and 52’ are then added together, as they reflect the rail freight market in Belgium as explained in the previous sub-section. These two steps are repeated for each product type from 1 to 97. It can be noted that neither B Logistics, IFB and Xpedys are demanding any of product types 49” and 52”. It can indeed be assumed that in our research, a railway operator will not demand its own product as an input.
The previous same steps can be applied for the products (rows) of the demand table. In order to do this, the customer transactions of B Logistics are used to deduct the demand for products of B Logistics by each sector. An example is given in table 2 by (i), which reflects the demand of a certain sector between 1 and 48 for products of B Logistics shown in row 49’’, for example the demand of B Logistics products by the metal industry, which is then deducted from the national demand of land transport products for this sector, resulting in the remaining requested land transport products for this sector reflected in row 49*. A similar process is performed with the customer transactions of Xpedys and IFB to create row 52” and the adapted row 52*, of which (j) is an example in table 2. Again, rows 49” and 52” are added together, as they reflect the rail freight market in Belgium. These two steps are repeated for each sector. It can again be noted that neither B Logistics, IFB and Xpedys are demanding any of their own products.
52* 49*
49*
2.2.2 ADAPTED NATIONAL SUPPLY TABLE
Table 3 is showing the steps that need to be executed in order to translate the obtained customer and supplier data from B Logistics, representing the rail freight transport activities in Belgium, into the existing national supply table and as such create a separate sector (column) and product (row) based on this data for this representation. It can be seen from table 3 that this process is more straightforward.
Table 3: Final framework to split a sector in a national supply table based on the data of one company
SOURCE:OWN COMPOSITION
Starting from the national supply table, the only values that can be deducted are the products delivered by B Logistics, IFB and Xpedys for the national economy. This can be perceived as the total customer transactions of these companies, reflected by (a) and (b) in table 3. It is clear that other sectors cannot create products delivered by B Logistics, IFB or Xpedys, as these can be only performed by these companies themselves.
2.3
LIMITATIONS AND ASSUMPTIONS
The used data in section 1.1 and the corresponding developed framework in sub-section 1.2 are taking into account a number of limitations that require some assumptions to be made. These limitations and assumptions need to be taken into account when interpreting the output of the framework in section 2.
whereas we automatically assume that the achieved product would also be classified in this NACE classification. In reality however, the delivered product could diverge from the primary NACE classification of this company.
Assumption: B Logistics, IFB and Xpedys are not producing and selling any other
products besides their core product towards their customers. In addition, the products bought from their suppliers correspond with the primary activity of the respective supplier.
Impact: This assumption is estimated to have a moderate impact on the final result. It can
be assumed that B Logistics is mainly producing rail freight transport products, and that the products bought from their suppliers correspond to the suppliers’ main activities, although in reality this will not apply to all customer and supplier transactions.
A second limitation is also bound to the data received, as this data reflects the financial year 2011, whereas this data is included in the national demand and supply table of 2010. As B Logistics was still part of the SNCB holding group in 2010, it is not possible to obtain relevant data for this year. In addition, more recent supply and demand tables are available, however without the necessary corrections for handling and transport margins, as well as without a separation between import and national demand. The more detailed demand and supply tables becomes available only once every five years, with the latest version being published in 2013, holding data of 2010. The next version will be published end of 2018 on the data of 2015.
Assumption: The financial activities by B Logistics have not shifted significantly from
2010 towards 2011.
Impact: This assumption is estimated to have a limited impact on the final result. It can
indeed be assumed that the rail freight transactions have not shifted significantly in one year, especially as the company structure and its embeddedness within the wider SNCB group was still valid.
A third limitation is the lack of data on final consumption of products provided by B Logistics, Xpedys and IFB, as well as a lack of data on subsidies.
Assumption: Final consumers and the government are not buying any products from B
Logistics, IFB or Xpedys. In addition, these companies do not receive any subsidies.
Impact: This assumption is estimated to have a limited impact on the final result. It can
indeed be assumed that a final consumer is not going to use rail freight services. In addition, Bel-first is showing that B Logistics did not receive any subsidies for the period 2011. Subsidies are mainly applicable for passenger rail services.
A fourth limitation is the current impossibility to translate the values obtained from customer data of B Logistics, IFB and Xpedys towards basic prices. As such, the handling margins for this data is still included in the final result.
Assumption: B Logistics is not applying handling margins when selling their products. Impact: This assumption is estimated to have a rather moderate impact on the final
result. In reality, B Logistics is setting market prices for its product with a handling margin taken into account. However the final impact of this small margin will be limited, and result in an over-estimation that should be taken into account.
A last limitation is the earlier mentioned market share of B Logistics, as a representative of the total rail freight market in Belgium.
Assumption: B Logistics is representing the total rail freight market in Belgium with a
Impact: It can indeed be assumed that B Logistics is a good representative for the rail
freight market with such a dominant market share. It is estimated that the input-output table and the Leontief multiplier would not shift significantly when the remaining competitors would be taken into account.
A final remark is to be made in regard to the chosen approach, although this is not a limitation or assumption but it does has a direct impact on the output in the next section and should therefore be taken into account when interpreting the results. The authors have chosen to create a sector-sector input-output matrix, instead of a product-product matrix which is commonly used for presenting national input-output tables. There is no significant difference in the validity of both approaches, however the advantage of working with a sector-sector input-output matrix is the avoidance of negative values. This remark should however be taken into consideration when comparing the results to the national input-output tables created by the Federal Planning Office, as they are using the product-product matrix approach which can result in a limited differentiation on the final results.
As a conclusion to the framework development, it can be stated that the results obtained from this framework and presented in the next section, should be described as an approximation towards the input-output matrix values for rail freight transport in Belgium, and a best guess of the Leontief multiplier indicator for rail freight transport in Belgium.
3.
RESULTS AND DISCUSSION
In this section, the results from the updated framework of section 1 will be presented. These results will be discussed within the context of the limitations and assumptions mentioned earlier, as well as a logical interpretation based on the observed rail freight development in the SWOT analysis of deliverable D 1.1 - 1.2 and the scenario development in deliverable D 1.3. In a first sub-section, the data obtained from company B Logistics will be used to create a schematic overview of the meso-level actor relationships. In the second sub-section, the calculated input-output table will be discussed. In the third sub-section, the corresponding Leontief multiplier approximations will be presented. In a final sub-section the parameters of the best-case scenario will be applied to the obtained results.
3.1
ACTOR RELATIONS
The 2011 data obtained from B Logistics, representing the rail freight sector, was used to analyse in a general way the different relationships between this rail freight operator and the different direct actor categories (meso-level) that are present in this sector. The result of this analysis is shown in figure 4.
SOURCE:OWN COMPOSITION, BASED ON VANNIEUWENHUYSE,DE WACHTER AND MISSCHAERT (2006), COPPENS ET AL.(2007) AND FODECONOMIE,K.M.O., MIDDENSTAND EN ENERGIE (2010)
It can be concluded from the retrieved data that shippers are rarely contacting directly a rail freight operator. More often, third parties will be used, being either a freight forwarder, a rail freight organizer or a terminal operator. This confirms earlier research performed by Vannieuwenhuyse, De Wachter and Misschaert (2006) and FOD Economie, K.M.O. en energie (2010). Rail companies can also generate revenue from leasing company owned equipment for operations performed by competitors. The performed input-output analysis will learn more about the more detailed customer and supplier relationships in terms of the different existing sectors and will be discussed in the next sub-section.
The data obtained also supports the conclusion made in Deliverable 1.1 – 1.2, where it was explained that rail freight transport and intermodal transportation require a European organization, as these types of transport often cross different borders while performing long distances. 55,13% of the revenue generated in 2011 is obtained from companies with a VAT number outside of Belgium (Export). 44,87% of the customer relations are national transactions. The required inputs for the rail freight operations show a slightly different pattern, with 68,7% of the needed inputs being bought at national based companies and 31,3% of the input being imported. This could benefit the final multiplier, as a relatively higher number of national inputs is used to create the necessary amount of outputs. However, it should also be taken into account that in 2011, the required inputs (costs towards suppliers) were higher than the obtained outputs (revenue from customers). This has led to a financial loss and a negative added value, which will be discussed in the next sub-section and is also confirmed through the available data in Bel-first.
3.2
INPUT-OUTPUT
The adapted demand and supply table were used to recalculate the input-output matrix. The matrix is a visualization of the sector-sector relationship within the Belgian economy, and indicates how much inputs a sector requires from another (top-bottom) or how much outputs are provided by one sector towards the other (left-right). The numbers are a value expression in millions of EUR. The result of this calculation can be consulted in Annex I. The main conclusion from this table in terms of the newly created sector 49’ + 52’, being rail freight transport represented by the incumbent operator, is the strong link with sector 49*, being the sector consisting of companies that perform all other remaining land transport. This can be explained by the observation that a main part of the actors from which a rail freight operator needs inputs, is also classified within the NACE sector 49*, such as truck companies organizing the pre- and post-haulage commissioned by the rail freight operator. On the other hand, if the intermodal transaction is commissioned by another company classified in sector 49*, the rail freight operator is delivering its output
towards NACE sector 49*, and in this case the true shipper, and as such the corresponding sector, is unknown.
Another logic and strong input relationship exists with sector 52, consisting of the companies offering transport supporting activities, such as INFRABEL and customs organizations. In terms of output, a strong link can be notified with sector 24, being the manufacturers of basic metals. This can be explained by the nature of metal cargo, heavy and voluminous, often requiring the use rail transport. The presence of ArcelorMittal in Belgium can further support this conclusion from the input-output matrix. Other, be it less significant, relationships can be found with sector 20 (manufacturing of chemical products) and 46 (wholesale trade) in terms of output, and sectors 46 and 80-82 (administrative and supporting activities) in terms of input.
It should be noted however that the incumbent rail freight operator in Belgium was undergoing significant changes in 2011, with this transition continuing up until today. Before 2010, B Logistics was a 100% state owned rail freight department incorporated in the SNCB holding structure, which offered both passenger and freight transport. It was only then that the company became a separate company, however still 100% owned by SNCB. By the end of 2015, B Logistics received a participation of 69% by Argos Soditic, transitioning the company into a more private operator. This transition is also reflected in the financial figures of the company, that can be consulted in the annual accounts. Where the company achieved a higher revenue in 2011 compared to 2015, a negative added value and a loss has to be taken into account for the first time period. The added value became positive in 2015, and by increasing the cost-effectiveness, the yearly loss has been significantly decreased and continues to decrease over the years. Also the current ratio, reflecting the status of the liquidity of a company, has passed the threshold of 1 or the first time in 2015, indicating that sufficient short term resources are now available to fulfil outstanding debts in the short run. This shows the transition of the company towards a more private and solid company. The results discussed in this paper should therefore be placed in the context of the company’s state in 2011, but do not allow drawing full conclusions for the current impact of this company on the national economy. Nevertheless, it is still an interesting exercise to see what was the direct and indirect impact of B Logistics, representing rail freight transport in Belgium, on the national Belgian economy in 2011. This will be discussed in the next sub-section.
3.3
LEONTIEF MULTIPLIER APPROXIMATION
The recalculated input-output matrix was used to calculate the Leontief matrix and the final Leontief multipliers, using the formulas discussed in Deliverable 3.1. The data can be consulted in Appendix I.
The Leontief multiplier for each sector is shown in row 67 and is the sum of the individual parameters of the corresponding column. The multiplier indicates the total impact, being the direct and indirect impact, of a sector on the national economy, when an increase of 1 EUR in final demand is observed. For the newly developed sector 49’ + 52’ (rail freight transport in Belgium, represented by the incumbent operator), a Leontief multiplier of 2.985 can be observed. This is a very high value, as it indicates that for each additional EUR increase in final demand to the Belgian incumbent rail freight operator, a total economic effect of 2.985 EUR will be generated within the Belgian national economy. This can partly be explained by the high level of national inputs used to create a relatively lower amount of outputs, but also the negative added value and the financial loss in 2011 have an impact on this figure. When the creation of output requires multiple (national) inputs, the effect on the economy will be high, but the created loss would eventually lead to the bankruptcy of the company or would have to be compensated for by subsidies from
described above. However, when comparing the Leontief multipliers obtained from the original national input-output table published by the Federal Planning Office (2013), it can be seen that the average deviation of the recalculated multipliers is 0.02, which is a first indicator of the validity of the model. Added to this, it can be stated that, based on the obtained data, it is clear that the operations within the rail freight transport sector are complex due to the formation of different consolidation groups, in which different rail companies, both national and international, are working together to execute (intermodal) rail freight transport. In addition, the complex distribution and/or unknown subsidies within the rail freight sector and the current impossibility to correct the demand table for margins could have an impact on the outcome.
In conclusion, this approximation of the Leontief multiplier shows already a first indication that the direct and indirect impact of rail freight transport on the national economy can be potentially significantly high, especially when a best-case scenario is observed, which will be done in the next sub-section.
3.4
BEST-CASE SCENARIO APPLICATION
Deliverable 1.3 defines three scenarios to explore possible future states of rail freight transport in Belgium. Within the best-case scenario, the relevant parameter for this study field is the evolution of rail tonkilometer, increasing by 133% in 2030. Applying the approximated Leontief multiplier, and assuming it would remain constant over the observed period, a maximum economic impact of 1.33 * 2.985 = 3.97 times the additional generated revenue from this increase in final demand in 2030 is obtained. However, it should also be observed that competition within this scenario is also increasing, which might impact on the multiplier for the rail freight sector. In addition, costs for rail transport are expected to decrease, lowering the need for inputs to create a similar amount of outputs, which also impacts on the Leontief multiplier.
The best-case scenario mainly applies an increase in tonkilometer and as such an increase in revenue for rail freight organizations, due to the full realization of the White Paper goal of a 30% shift of road freight traffic towards rail or inland waterways by 2030 (European Commission, 2011). However, this increase or shift in revenue alone will not change the Leontief multiplier, as the mutual relationships with the other national sectors in the Belgian economy will not be changed by this evolution. Only the total effect would be increased as the multiplier would be applied to a higher increase in final demand for this product. Therefore, it is interesting to analyse the existing impact through the 65 sectors within this best-case scenario, as it is assumed that within this scenario, the structure of the economy would not shift significantly from today. The impact on the national economy of 2.985 EUR for each increase in final demand of rail freight transport by 1 EUR, mainly consists of the direct effect with the rail freight sector itself. This can be found in the Leontief table in the cell linking the newly created rail freight sector (49’ + 52’) on both the row and the column. It should be noted that
in this case both the columns and rows are reflecting a sector and no longer the sector and a product respectively. Each increase in final demand of rail freight transport by 1 EUR (column 49’ + 52’) will generate a national economic impact of 1.004 EUR through its own sector (row 49’ + 52’). As mentioned in the previous sub-section, also the relationship with the originating sectors 49* (other land transport) and 52* (companies with transport supporting activities) explains a significant part of the total economic impact. Each increase in final demand of rail freight transport by 1 EUR (column 49’ + 52’) will generate a national economic impact of respectively 0.819 EUR (row 49*) and 0.410 EUR (row 52*). As it can be seen from the Leontief table, another strong impact generation can be found with sector 69-70 (legal and accounting services), generating an economic impact of 0.097 EUR through this sector, for each increase in final rail freight demand of 1 EUR. Sector 80-82 (administrative and supporting activities), 46 (wholesale trade) and 41-43 (construction industry) are generating an similar economic impact of respectively 0.059 EUR, 0.055 EUR and 0.043 EUR through these sectors, for each
increase in final rail freight demand of 1 EUR. These figures only give insight in the distribution of the generated impact over the existing sectors, but not necessarily about the strength of the relationships with different sectors. This can be analysed by calculating the degrees of dependency, which will be discussed as one of the next steps in the next section.
4.
NEXT STEPS
The previous sections discussed the obtained results so far, based on the collected data from the incumbent rail freight operator in Belgium. These results can be used for a number of further analyses, as well as a sensitivity analysis to be performed to check the impact of the data restrictions and the made assumptions. These next steps will be highlighted in sub-section 3.1. The obtained insight in the input-output analysis, as well as the discussed results, also led to a new framework for the continuation of this WP within the project. This new framework will be discussed in sub-section 3.2
4.1
CONTINUATION OF THE INPUT-OUTPUT ANALYSIS
The next step in the input-output analysis is linking the results discussed in section 2 to the macro-economic parameters of ‘employment’ and ‘added value’. This can be done by calculating the degrees of dependency, as well as the forward and backward linkages, analysing the relations with the different suppliers and customers of the concerned rail freight sector. The formulas for these calculations are explained in Deliverable 3.1, as well as in Van Gastel (2016).
It is clear from the discussions above that a number of limitations and assumptions have been taken into account. Therefore, a sensitivity analysis can be performed to test the impact of these assumptions on the final outcome. In addition, the assumption that the structure of the rail freight sector would not shift by 2030 in scenario 1 could be lifted, analysing the impact of hypothetical changes in the rail freight sector, its structure and relationships within the national Belgian economy.
An example could be to measure the impact when rail freight costs would proportionally drop by 30%, with an identical revenue as in the original explored case. This would mean that less inputs are required for creating a similar amount of outputs, lowering the total economic impact but increasing the added value if market prices remain identical. Finally, an attempt to gather more data from rail freight operators, mainly Crossrail, could lead to an increased validity of the model; however the sensitive nature of this data will remain a challenge.
4.2
NEW FRAMEWORK FOR NEXT SCENARIOS
Although input-output is an interesting and useful tool to measure direct and indirect economic effects, and as such a macro-economic impact of a certain sector, it appears not to be the best tool to be combined with scenario implementation. Data restrictions combined with time limitations have inspired the authors to look for alternative methods that can be explored in parallel when further developing this WP within the project. Figure
SOURCE:OWN COMPOSITION
From what has been learned so far in the input-output analysis, mainly the indirect effects have been mapped, and can be linked to the macro-economic indicators ‘added value’ and ‘employment’. However, in order to validate these results, it can be an interesting exercise to perform a bottom-up analysis, starting from the company level (micro-level) and explore financial data and productivity measures, in order to verify the direct impact of companies within the rail freight sector. Next, also tertiary effects should be analysed, as investments generate not only direct and indirect effects, but also additional strategic effects that impact the national economy, which cannot be measured by the two previously mentioned tools. This can be captured by estimating a macro-economic model. The three different scenarios, the best-case, the medium-case and the worst-case scenario, should be taken into account in each of these developments. This means that one scenario would not be applied to one part of the framework, but to the framework as a whole. This allows fully analysing and measuring the economic importance of the rail freight activities in Belgium by the end of the project.
CONCLUSION
In this deliverable, the results of the aggregate impact analysis so far have been discussed. Based on the methodology proposed in Deliverable 3.1, the modelling approach was re-defined in section 1 by creating a theoretical model including the rail freight transport sector in Belgium. In addition, also the data collection and the limitations that these data hold towards the model were discussed. The limited availability, the important confidentiality as well as the complexity of the rail freight data led to the statement that the final outcome in the form of a Leontief multiplier for measuring the impact on the national economy, can only be seen as an approximation or a best guess at the multiplication impact of rail freight transport on the national Belgian economy.
The identified multiplier is perceived to be relatively high: for each increase by 1 EUR of final rail freight transport demand, a total impact of 2.985 EUR on the national Belgian economy is generated. However, this has to be interpreted in the complex context of data collection and the set of assumptions that have been set based on the observed limitations. In addition, it was discussed that the available data from the financial year 2011 are reflecting a company in full transition from a publicly-owned department with a yearly loss and a negative added value, towards a privately operated company striving for profit maximization and a positive added value towards the economy. In this respect, it can be very interesting to perform the same exercise in 2018, when the national input-output table for the year 2015 is published by the National Bank of Belgium and the Federal Planning office, and see how the multiplier might shift compared to the used data of 2010 and 2011. This similar analysis would still be valid, as it is currently already known that the investigated company represents the rail freight sector in Belgium with a market share of 85% in 2015. Nevertheless, the added value has increased to a positive value, and the yearly loss has been significantly limited, which would make a comparison
of both rail freight multipliers from 2010 and 2015 very interesting in terms of validating the currently high value that was found within this analysis. Also the change in sector relationships, as well as the impact generated on different sectors could then be analysed.
REFERENCES
Bureau van Dijk Electronic Publishing, 2017. Consultation of data for NACE code 49 in the bel-first database.
Coppens, F., Lagnaux, F., Meersman, H., Sellekaerts, N., Van de Voorde, E., Van Gastel, G., Vanelslander, T. and Verhetsel, A., 2007. Economic impact of port activity: a disaggregate analysis – the case of Antwerp, National Bank of Belgium Working Paper, 110.
Deville, X. & Verduyn, F., 2012. Implementation of EU legislation on rail liberalization in Belgium, France, Germany and The Netherlands, National Bank of Belgium Working Paper, 221.
European Commission, 2011. Roadmap to a Single European Transport Area – Towards a competitive and resource efficient transport system, White Paper, Publication: /* COM/2011/0144 final */
Federal Planning Office, 2013. Input-outputtabellen 2010. Publication by FPB, publisher: Philippe Donnay, Brussels.
Federal Planning Office, 2016. Meeting on the development of a split in the national input-output table, Frank Troch, Bart Hertveldt and Bruno Hoornaert, 18th of
November 2016, Brussels.
FOD Economie, K.M.O., Middenstand en Energie, 2010. Analyse van het goederenvervoer per spoor in België – december 2009, url:
http://economie.fgov.be/nl/binaries/Goederenvervoer_per_spoor%2B_tcm325-100940.pdf
FOD Economie, K.M.O., Middenstand en Energie, 2016. KBO public search op ondernemingsniummer voor NACE code opdeling, url:
http://kbopub.economie.fgov.be/kbopub/zoeknummerform.html;jsessionid=FA5990E8 320FAFBC7A089D3CE79E8B86.worker4a
National Bank van België, 2016. Meeting on the development of a split in the national input-output table, Frank Troch, Thierry Vanelslander, Georges Van Gastel and Tim Van Waeyenberghe, 15th of December 2016, Brussels.
Nationale Bank van België, 2016. Nationale rekeningen: Aanbod- en gebruikstabellen 2013, Brussel, 23 December 2013.
Troch, F., Vanelslander, T., Sys, C., 2016. Deliverable D 3.1: Methodology proposal for the macro-economic influence of rail freight transport, University of Antwerp, url:
http://www.brain-trains.be/
Troch, F., Vanelslander, T., Sys, C., Stevens, V., Verhoest, K., Mostert, M., Tawfik, C., Limbourg, S., Merchan, A., Belboom, S., Léonard, A., 2015. Deliverable D 1.3. Scenario development, University of Antwerp and University of Liège, url:
http://www.brain-trains.be/
Vannieuwenhuyse, B., De Wachter, H., Misschaert, M., 2006. Het spoorvervoer uitbouwen tot sterke schakel in het logistieke proces, Vlaams Instituut voor Logistiek (VIL).
Van Gastel, G., 2016. Presentation on the structural changes to the global economy, Business Environment course, C-MAT, University of Antwerp, October 11th 2016.
ACKNOWLEDGEMENT
The authors would like to thank Georges Van Gastel, François Coppens and Tim Van Waeyenberghe from the National Bank of Belgium, and Bruno Hoornaert and Bart Hertveldt for their expertise and support on getting acquainted with the input-output methodology, as well as the out-of-the-box thinking on how to apply this methodology on the research question posed within the BRAIN-TRAINS project, as well as their assistance during the research development process. Special thanks also go to Geert Pauwels and Werner Koninckx from B Logistics for their expertise and active cooperation by providing all the necessary data required to perform the discussed analysis.
APPENDIX I
THE NACE CLASSIFICATION, INPUT-OUTPUT TABLE AND THE LEONTIEF TABLE ARE 65X65 MATRICES, WHICH CANNOT BE PRESENTED IN A CLEAR WAY ON PAPER. THEREFORE THESE TABLES CAN BE CONSULTED BY DOWNLOADING THE EXCEL SHEET THROUGH THE
FOLLOWING LINK:
https://www.uantwerpen.be/images/uantwerpen/container30458/files/INPUT%20OUTPUT %20LEONTIEF.xlsx