The Costs of Issuing Private Versus Public Equity
29
0
0
Texte intégral
(2) CIRANO Le CIRANO est un organisme sans but lucratif constitué en vertu de la Loi des compagnies du Québec. Le financement de son infrastructure et de ses activités de recherche provient des cotisations de ses organisations-membres, d’une subvention d’infrastructure du Ministère du Développement économique et régional et de la Recherche, de même que des subventions et mandats obtenus par ses équipes de recherche. CIRANO is a private non-profit organization incorporated under the Québec Companies Act. Its infrastructure and research activities are funded through fees paid by member organizations, an infrastructure grant from the Ministère du Développement économique et régional et de la Recherche, and grants and research mandates obtained by its research teams. Les organisations-partenaires / The Partner Organizations PARTENAIRE MAJEUR . Ministère du Développement économique et régional et de la Recherche [MDERR] PARTENAIRES . Alcan inc. . Axa Canada . Banque du Canada . Banque Laurentienne du Canada . Banque Nationale du Canada . Banque Royale du Canada . Bell Canada . BMO Groupe Financier . Bombardier . Bourse de Montréal . Caisse de dépôt et placement du Québec . Fédération des caisses Desjardins du Québec . GazMétro . Groupe financier Norshield . Hydro-Québec . Industrie Canada . Ministère des Finances du Québec . Pratt & Whitney Canada Inc. . Raymond Chabot Grant Thornton . Ville de Montréal . École Polytechnique de Montréal . HEC Montréal . Université Concordia . Université de Montréal . Université du Québec . Université du Québec à Montréal . Université Laval . Université McGill . Université de Sherbrooke ASSOCIE A : . Institut de Finance Mathématique de Montréal (IFM2) . Laboratoires universitaires Bell Canada . Réseau de calcul et de modélisation mathématique [RCM2] . Réseau de centres d’excellence MITACS (Les mathématiques des technologies de l’information et des systèmes complexes) Les cahiers de la série scientifique (CS) visent à rendre accessibles des résultats de recherche effectuée au CIRANO afin de susciter échanges et commentaires. Ces cahiers sont écrits dans le style des publications scientifiques. Les idées et les opinions émises sont sous l’unique responsabilité des auteurs et ne représentent pas nécessairement les positions du CIRANO ou de ses partenaires. This paper presents research carried out at CIRANO and aims at encouraging discussion and comment. The observations and viewpoints expressed are the sole responsibility of the authors. They do not necessarily represent positions of CIRANO or its partners.. ISSN 1198-8177.
(3) The Costs of Issuing Private Versus Public Equity * Cécile Carpentier†, Jean-François L’Her‡, Jean-Marc Suret§ Résumé / Abstract Les sociétés canadiennes inscrites en Bourse se financent de plus en plus fréquemment par placement privé, les PIPES. Le coût de ce type d’émission n’a jamais été comparé à celui des émissions publiques subséquentes (SEO). Nous analysons un échantillon de 2018 PIPES et 1990 émissions publiques, effectuées entre 1993 et 2003. Nous montrons que l’escompte est supérieur dans le cas des PIPEs, ce qui correspond aux attentes, mais les commissions payées aux courtiers sont inférieures. Lorsque la taille et les autres caractéristiques des émissions sont prises en compte, la différence entre les deux catégories d’émissions est de l’ordre de 4 %. Cet écart est statistiquement significatif. Toutefois, dans la mesure où l’émission privée peut permettre à l’entreprise d’obtenir les fonds six mois plus tôt que l’appel public, il peut être économiquement justifié de supporter ce coût supplémentaire. Cette situation pourrait expliquer la croissance des émissions privées. Mots-clés : placement privé, coût d’émission, émission subséquente Canadian listed firms issue private offerings more often than public offerings. Yet the issuing cost of private investments in public equity (PIPEs) has neither been analyzed nor compared with the cost of conventional seasoned equity offerings (SEOs). We examine a sample of 2,108 PIPEs and 1,990 SEOs completed between 1993 and 2003, and show that, as expected, PIPEs are discounted more than SEOs, although the commissions paid to investment bankers are lower. When we control for size and other characteristics of the issuers, the difference between the total costs is 4%. Although this figure is significant, if the PIPE process allows firms to obtain financing four or six months earlier than via SEOs, the price gap may be economically justifiable. This finding may explain the rapid growth of the Canadian PIPE market. Keywords: private equity, issuing costs, seasoned equity Code JEL : G24, G32 *. We are grateful to Stephan Smith for valuable research assistance and to our colleagues for helpful comments. Any errors remain the responsibility of the authors. The views expressed in this article are those of the authors and do not necessarily reflect the position of the Caisse de dépôt et placement du Québec. † Professor, Laval University, School of Accountancy, Pavillon Palasis-Prince, room 5244, Quebec, Canada, G1K 7P4. E-mail: cecile.carpentier@fsa.ulaval.ca. Tel: (418) 656-2131 #6385, fax: (418) 656-7746. ‡ Corresponding author. Vice-president, Caisse de dépôt et placement du Québec, Investment Policy Research, 1000 Place Jean-Paul-Riopelle, 9th floor, Montréal (Québec) Canada, H2Z 2B3, Internet: www.lacaisse.com, e-mail address: jlher@lacaisse.com. § Director, Laval University, School of Accountancy, Pavillon Palasis-Prince, room 5244, Quebec, Canada, G1K 7P4, local 5226, Tel: (418) 656-7134, fax: (418) 656-7746, E-mail: jean-marc.suret@fsa.ulaval.ca..
(4) INTRODUCTION A growing number of public companies place equity privately. Private Investment in Public Equity (PIPE) has expanded rapidly, and represents approximately 8% of the gross proceeds of Seasoned Equity Offerings (SEOs) in the United States in 2000, according to Chaplinsky and Haushalter (2003). One explanation for this trend is the reduction in issue costs and times (Ferreira and Brooks 2000; Anson 2001). The total cost of an issue could be lower for PIPEs, even if the degree of asymmetry of information related to the value of the company is probably greater (Ferreira and Brooks, 2000). This situation results from direct negotiations between issuers and investors and the absence of certain statutory requirements. Professionals have suggested that each of the two main constituents of issue costs, i.e. the direct cost and the indirect cost, are higher for public issues (Goldfarb 2003). Issue time frames associated with PIPEs are also significantly shorter. It is possible that the comparative advantage of PIPEs over SEOs, as well as the development of this market, result partially from the deteriorating conditions of public issues. Kim and Shin (2004) and Mola and Loughran (2004) document a sharp increase in discounts on SEOs, which is not mitigated by the reduction in the associated direct costs. Thus, it could have become less expensive to undertake private issues than public issues. Nonetheless, evidence that would allow a direct comparison of the costs of these two issue methods is lacking. Consequently, the objective of this study, which is based on an analysis of about nearly 4,100 Canadian issues between 1993 and 2003, is to provide direct evidence of comparative private and public issue costs. 3.
(5) It is difficult to compare the relative costs of PIPEs and SEOs in the United States, because of the substantial difference in the characteristics of issuers and deals pertaining to the two types of issues. Unlike SEOs, PIPEs tend to follow periods of poor operating performance (Chaplinsky and Haushalter 2003). Marciukaityte et al. (2004) attribute this negative performance to the high percentage of start-up companies among the issuers. The median market capitalization of PIPE issuers, before the transaction, represents approximately 10% of the median market capitalization of SEO issuers, and the gross proceeds are also much lower than those of SEOs. Many PIPE deals are structured, and include convertible securities that contain readjustment clauses pertaining to prices or the conversion rate, while SEO deals lack this attribute. Moreover, even if the number of PIPEs has increased in the United States since 1995, the phenomenon is still relatively marginal. Chaplinsky and Haushalter (2003) report that between 1995 and 2000, 1,062 American companies issued a PIPE, while the number of registered companies is close to 7,500. In Canada, 70% of registered companies undertook a PIPE, and the market capitalization of private and public issuers is similar. The total number of PIPEs itemized in Canada far exceeds the number of SEOs; about 900 companies carried out private and public issues successively. Canadian data not only provide out-of-sample evidence, but also a more relevant comparison of private and public equity according to various dimensions. The paper is organized as follows. First, we review the factors that potentially influence the two main constituents of the costs of private and public equity issues. The second section presents the data and descriptive statistics pertaining to Canadian equity issuers, relative to the various dimensions that can impact issuing costs. The third section 4.
(6) explores the issue costs of PIPEs and SEOs. In the fourth section, we examine whether PIPE and SEO costs differ significantly when we control for issue and issuer characteristics. Concluding remarks end the paper.. I. ISSUE COSTS OF PRIVATE AND PUBLIC EQUITY. The costs associated with SEOs have been widely studied (Lee et al., 1996, and references therein). Their direct constituent includes the gross spread, that is the remuneration of the investment banker, whereas other costs include the legal auditing associated with drafting a prospectus.1 The discount (underpricing) is an indirect cost of issuing SEOs. For PIPEs in the United States, the discount is the foremost constituent of issue costs. The relative importance of these costs is linked to factors such as size, timing of the issue, risk and the nature of securities issued. These factors generally vary depending on whether companies place equity publicly or privately. It is thus necessary to control for these factors when comparing private and public equity issue costs.. 1. Other direct costs are not considered in this study. They generally represent a small fraction of. total costs. Bajaj et al. (2002) estimate these costs at 0.43% of gross proceeds for preferred stocks. PIPEs do not incur such costs because they do not require a prospectus.. 5.
(7) Size of Issues and Issuers These two factors are related, in that the biggest issuing companies generally undertake larger issues. Direct costs are inversely related to the size of the issue. As the securities of the most capitalized companies are more liquid, they represent a lesser risk for investment bankers. Butler et al. (2003) show that the investment bankers’ fees are substantially lower for firms with more liquid stocks. Altinkilic and Hansen (2003) obtain similar results. Discounts are also inversely related to firm size if they are associated with ex ante uncertainty (Kim and Shin 2004). Bajaj et al. (2002) and Hertzel and Smith (1993) also observe an inverse relation between issue size and PIPE discounts. Hertzel and Smith (1993) conclude that this finding supports the view that discounts reflect economies of scale in information production, along with the theory that information asymmetry is greater for small firms. Ang and Brau (2002) document that the most transparent companies incur lower issue costs. Conversely, opaqueness is generally associated with small companies. Evolution of Discounts Altinkilic and Hansen (2003), Kin and Shin (2004) and Mola and Loughram (2004) observe a substantial increase in the discount on SEOs in the United States since the 1980s. The rate increased from less than 1% in the 80s to 3% at the end of the 90s, depending on the authors. This increase is not associated with a reduction in gross spreads, which remained at 5% on average. Kim and Shin (2004) attribute this increase to the limitations imposed on short sales by Rule 10b-21, in 1988. Although such a rule was not imposed in Canada, it is worth examining whether such changes 6.
(8) occurred on the Canadian stock market. Note that issue costs can also be influenced by successive hot and cold issue markets. The existence of windows of opportunity for initial public offerings (IPOs) and seasoned equity offerings is widely documented (Bayless and Chaplinsky 1996; Hoffmann-Burchardi 2001; Helwege and Liang 2004). Hot IPO markets have been described as having an unusually high volume of offerings, severe discounts and frequent oversubscription (Helwege and Liang, 2004). According to Jindra (2000), firms time their SEOs to take advantage of windows of opportunity that arise when equity is overvalued with respect to managers' private information. Insider trading patterns in the period prior to the offering are consistent with the view that managers know the valuation level of their firm and trade to take advantage of this information. Therefore, the discount should be greater during hot issue markets than during cold markets. Investment Bankers and Auditors It is generally accepted that entrepreneurs with more favorable information about a firm’s value choose a higher quality investment banker (Ang and Brau 2002). The same argument holds regarding the quality and reputation of the auditor. In both cases, the gross spread should be higher and the discount lower for higher quality investment bankers and auditors, because the choice of a high quality investment banker/auditor signals better prospects and lower risk. SEOs versus PIPEs Several elements predict different costs for both issue methods. The discount should be greater for PIPEs if it corresponds to the cost of information acquisition. Hertzel and 7.
(9) Smith (1993) conclude that private placement discounts are influenced by the costs incurred by private investors to resolve information asymmetry concerning the firm. In other words, when value is more difficult to ascertain, investors will expend more resources to determine value and will thus require larger discounts. Given that the PIPE process is less transparent than the conventional SEO process, discounts should be lesser for SEOs, as Ang and Brau (2002) contend. In the United States, most studies estimate PIPE discounts at between 9% and 20% (Hertzel and Smith 1993; Wu 2004), while Mola and Loughram (2004) estimate discounts at 3% for SEOs. Theoretically, the gross spread should be larger for PIPEs, because the investment bankers’ risk is greater in a less liquid offering. However, the workload and the risk of the investment banker should be lower in a quick process in which only a few investors are involved. Moreover, a significant proportion of PIPEs are implemented without investment bankers. These direct offerings can bear a larger discount, but the gross spread should be null.2 II. DATA AND STYLIZED FACTS. Canadian PIPE and SEO Populations Data on PIPEs and SEOs originate from the FPinfomart.ca database.3 The population of. 2. See Anand (2003) for a discussion of costs and benefits of direct public offerings.. 3. The Fpinfomart.ca database is produced by CanWest Interactive Inc. A systematic audit of the. data was performed; the data missing in various fields was added based on figures provided by Sedar (www.sedar.com), Cancorp financials (Micromedia) and Internet research. Fpinfomart.ca provides data relative to PIPEs whose gross proceeds are CA$1.5 million or more.. 8.
(10) Canadian issues encompasses 4,724 PIPEs and 3,502 SEOs completed between January 1, 1993 and December 31, 2003. PIPEs represent 57.43 percent of all Canadian postinitial public offerings and Canadian firms have issued more PIPEs than SEOs (2,186 vs 1,663). The number of placements signals that PIPEs have become a very important financing mode. Gross proceeds raised by private placements are generally less than those raised by public placements. The median PIPE is CA$3 million, versus CA$15 million for SEOs. The total proceeds obtained via PIPEs represent CA$40.58 billion, i.e. 17.36 percent of the total offerings (PIPEs and SEOs). Neither the PIPE equity issue market nor the SEO equity market is stable. Accordingly, periods of hot and cold issue markets were observed. Figure 1 illustrates the changes in the number of PIPEs, SEOs and the total number of issues. Following Helwege and Liang (2004), we identified hot and cold issue markets using three-month moving averages of the number of PIPEs (for the PIPE sub-sample) and SEOs (for the SEO sub-sample) for each month in the sample. Those periods with at least three consecutive months in the upper third (lower) of activity volume comprise the hot (cold) periods. Otherwise the period is considered neutral. Periods of hot and cold issue markets consequently differ for PIPEs and SEOs. More specifically, the technological bubble was favorable for SEOs, but unfavorable for PIPEs. Nonetheless, it is difficult to discern a clear pattern that could explain these cycles; this exercise could be an avenue of future research. **Insert Figure 1 about here**. 9.
(11) To compare the sizes of PIPEs and SEOs issuers, we conduct the following analysis. Each year, all Canadian companies comprised in the Datastream database are sorted by market capitalization. We then partition the Canadian public company universe into 10 size deciles (S1 = smallest companies, S10 = largest companies) for each year studied. Each firm is assigned to one of the 10 portfolios corresponding to its market capitalization in the year of the issue. Table 1 shows that PIPEs are mainly issued by companies whose market capitalization is above the median. 75% of PIPE issuers belong to deciles 6 to 9, that is the largest companies, with 25% of PIPEs in the decile 8. Thus, market capitalization of PIPE issuers do not differ markedly from that of SEO issuers. SEOs are mainly issued by companies comprised in deciles 7 to 10 (75%), corresponding to the largest companies. 28% of SEO issuers belong to the decile 10. **Insert Table 1 about here** Descriptive Statistics Market data are extracted from the Datastream database. PIPEs issued by funds and trusts are excluded, as are the issues for which gross spread or market data were missing. The final sample comprises 4,098 issues (Table 2). The total gross proceeds of the 2,108 PIPEs equal 16.70% of the total gross proceeds of private and public issues. Our sample is thus representative of the PIPE universe. Prestigious investment bankers are differentiated from the rest of the banker population.4. 4. Prestigious investment bankers are those that manage more than 5% of the total gross proceeds. of all issues (IPOs, SEOs and PIPEs) during the 1993-2003 period. The following seven prestigious investment bankers collectively administered 60% of all issues: RBC Capital Markets,. 10.
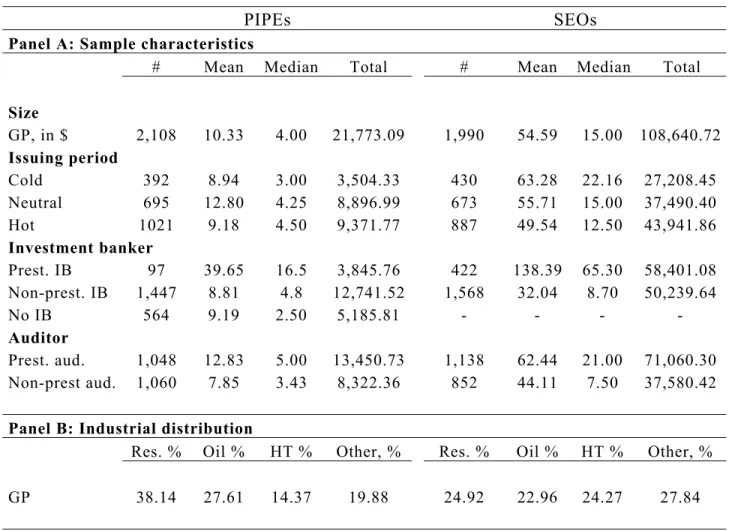
(12) Panel A shows that 97 PIPEs (422 SEOs) are underwritten by prestigious investment bankers. We also distinguish PIPEs issued without the intermediation of an investment banker. Further, we separate issues audited by prestigious auditors from the others.5 Accordingly, 50% of the financial statements of companies issuing PIPEs are audited by a prestigious auditor, compared with 57% for SEOs, and almost 50% of PIPEs and SEOs occurred in hot issue periods. Panel B of Table 2 allows a comparison of the industrial distribution of PIPEs and SEOs. Over the 1993-2003 period, resources companies account for 38.14% of the proceeds of PIPEs, compared with 24.92% of the SEO proceeds. The proportions are 14.37% and 24.27% for high technology PIPEs and SEOs. The proportion for oil and gas and other sectors are comparable. In contrast with their U.S. counterparts, Canadian PIPEs are strongly concentrated in the primary sector, concentrated in the primary sector, but it is also the case for SEOs. 6 **Insert Table 2 about here** CIBC World Market Inc., BMO Nesbitt Burns Inc., TD Securities inc., Scotia Capital Inc., Merrill Lynch Canada Inc. and Goldman, Sachs & Co. 5. We consider the Big Five (during the 1990s) and Grant Thornton as prestigious auditors. Public. Accounting Reports ranks Grant Thornton fifth in 2003. 6. However, we observe strong variations in issue size and sector distribution over time. For. example, the median gross proceeds of SEOs is CA$9.58 million in 1999 and CA$46.00 million in 1997. The percentage of the total gross proceeds issued by resource companies increased from less than 15% in 1998 to 49.01% in 2003. These fluctuations are consistent with issue cycles associated with a strong sector-based dimension (Helwege and Liang 2004).. 11.
(13) These descriptive statistics show that the issuance method is conditioned by issue and issuer characteristics. More formally, following Fields, Fraser et al. (2003) in a similar context, we use the following probit model to analyze in a multivariate framework the characteristics influencing the type of issuance: DIi = a0 + a1 log(GPi ) + a2 DRi + a3 DOGi + a4 DHTi + a5 DUi + a6 DAi + a7 DHi + ei. For i=1 to n, where DIi is a dummy variable that equals 1 if the issue is a private placement of public equity and 0 otherwise. Log(GPi) is the logarithm of the gross proceeds of issue i in CA$ DRi is a dummy variable that equals 1 if the issuing company belongs to the resources industry and 0 otherwise DOGi is a dummy variable that equals 1 if the issuing company belongs to the oil and gas industry and 0 otherwise DHTi is a dummy variable that equals 1 if the issuing company belongs to the high tech and biotech industry and 0 otherwise DUi is a dummy variable that equals 1 if the issuing firm hires a prestigious investment banker and 0 otherwise; DAi is a dummy variable that equals 1 if the issuing firm is audited by a prestigious auditor and 0 otherwise; DHi is a dummy variable that equals 1 if the issue month is hot and 0 otherwise;. Table 3 suggests that the differences between the two sets of issues are significant overall. Companies in the resource or oil and gas industries are more likely to be PIPE issuers. Further, gross proceeds are significantly smaller for PIPEs than for SEOs. In contrast, firms issuing SEOs are more likely to be high tech companies, have larger gross proceeds and deal with more prestigious investment bankers. ***Insert Table 3 here***. 12.
(14) III. ISSUE COSTS OF CANADIAN PIPES AND SEOS. Table 4 presents annual average gross spreads, discounts and total costs per year and for the whole period. In keeping with prior studies, the discount is calculated using the issue price of the PIPE and the market price 10 days after the announcement date (Hertzel and Smith 1993; Wu 2004). The average (median) total cost is 14.28% (13.30%) for PIPEs, and 10.97% (7.55%) for SEOs. In general, SEOs are less costly than PIPEs, and the average (median) difference is about 331 (575) basis points. The mean (median) gross spread differs by 133 (50) basis points. Table 4 also documents that SEO gross spreads are stable through time, while PIPE gross spreads are markedly lower from 1999 to 2001: less than 2%. This can be linked to a high proportion of direct private offerings (DPO) during this period. PIPEs and SEOs tend to be issued at a discount. In the United States, the discount ranges from 9% to 20% for PIPEs and is approximately 3% for SEOs. In Canada, the median discount is 8.74% for PIPEs and 2.32% for SEOs. The average values are 9.99% and 5.33% respectively. Higher average discounts for Canadian SEOs are consistent with the observation that Canadian issuers are smaller than their U.S. counterparts. However, if the explanation provided by Mola and Loughram (2004) is valid, the high discount observed in Canada is also consistent with investment bankers’ significant capacity to extract rents from issuing firms. According to Carpentier and Suret (2003), in 2001 the brokerage subsidiaries of the six large Canadian banks accounted for more than 70% of. 13.
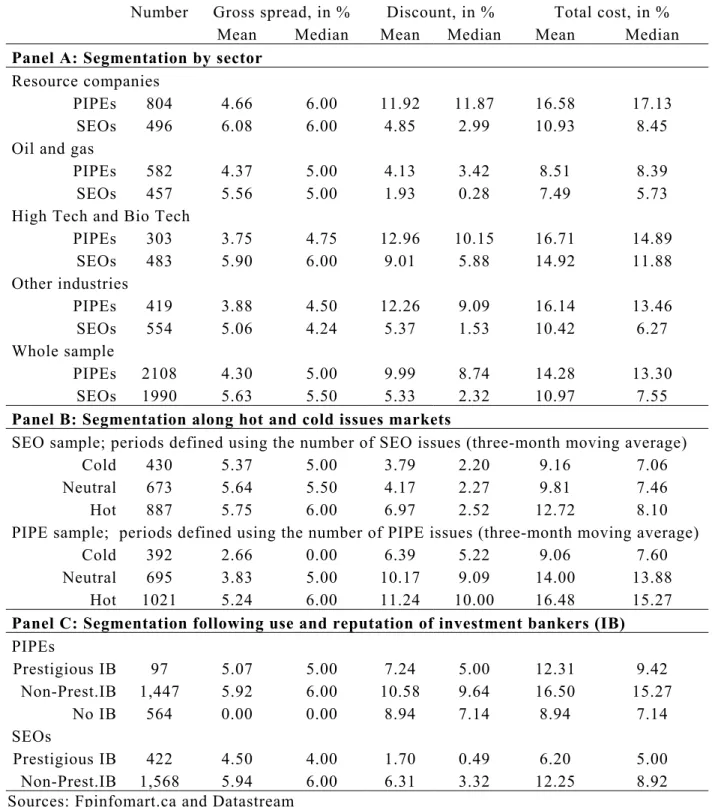
(15) the business in the industry. The fact that discounts on PIPEs are lower in Canada than in the U.S. may explain the rapid growth of this type of offering in Canada.7 **Insert Table 4 about here** Table 5 presents the characteristics of gross proceeds and issue costs when the sample is divided according to several dimensions. Our discussion is based on median analysis. Panel A presents distribution by industry. In effect, the costs differ by sector, and PIPEs and SEOs vary considerably between sectors. The lowest costs are observed in the oil and gas sector (8.39% for PIPEs and 5.73% for SEOs), where the difference between PIPE and SEO issue costs is smallest (266 basis points). The highest costs are observed in the resources sector and in other sectors excluding technologies. The difference between PIPE and SEO issue costs is approximately 868 basis points for the resources sector and 719 basis points for the other industries, excluding technologies. The differences are mostly attributable to the discounts, which fluctuate strongly between sectors, while the investment bankers’ compensation appeared relatively stable. Panel B presents the costs when issues are distributed by periods of hot and cold issue markets, defined for each of these markets. These periods tend to have a limited effect on the public issues, because the greatest difference between medians is only 104 basis. 7. It is possible that the consideration of other direct costs biases the results slightly, in favor of. PIPEs. Although the costs of prospectus preparation should be higher for public issues, it is likely that the short-form prospectus distribution rule and related forms and companion policy that came into effect in all CSA jurisdictions on December 31, 2000 have significantly reduced the costs associated with the prospectus.. 14.
(16) points. This result is not consistent with evidence related to the SEO market in the United States. Nonetheless, these periods tend to have a significant effect on PIPE issue costs. The highest median difference is 767 basis points. Because the discounts are double in size during periods of hot issue markets, costs are much higher. Panel C documents that total costs are greatly reduced when the company places its securities directly (7.14%), compared with 9.42% when a prestigious investment banker is involved, and 15.27% when the intermediary is a less prestigious investment banker. This difference results from gross spreads, which are null in the case of direct investments. As expected, the median discount is lower (5.00%) when a prestigious investment banker is enlisted than when the company places its securities independently (7.14%). Direct offerings are discounted more than intermediated offerings because of the higher uncertainty and information acquisition costs. **Insert Table 5 about here** The preceding descriptive statistics show that several factors, whose effects are probably intertwined, explain the differences between the costs of the two issuance methods examined. Below we conduct a more thorough analysis to determine how PIPE and SEO issue costs differ when various explanatory factors are jointly considered.. 15.
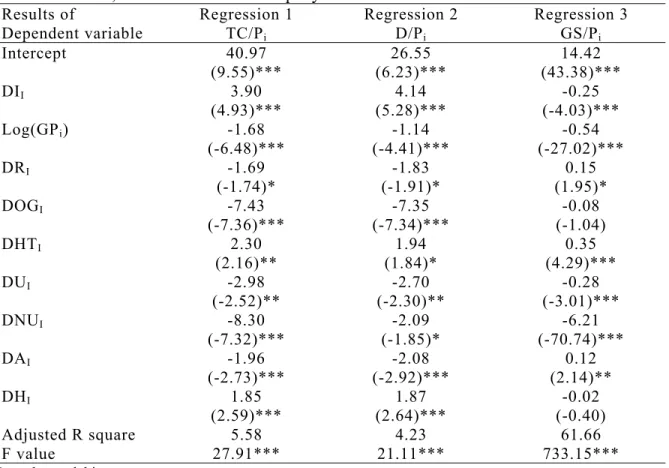
(17) IV. MODEL OF DIRECT, INDIRECT AND TOTAL ISSUE COSTS. We estimate a model of total, direct and indirect issue costs to examine whether there is a significant difference between costs of private or public issuance, once we control for several factors related to the relative issue size, industries, investment bankers, auditors and conditions of the issue market. The 3 models are: Yi = a0 + a1 DIi + a2 log(GPi ) + a3 DRi + a4 DOGi + a5 DHTi + a6 DUi + a7 DNUi + a8 DAi + a9 DHi + ei. (2). For i = 1 to n, Where Y i respectively is TC/P i , D/P i , or GS/P i . TC/Pi stands for the total cost of issue i divided by the gross proceeds; D/Pi is the discount of the issue i divided by the gross proceeds; GS/Pi is the gross spread of the issue i divided by the gross proceeds. DNUi is a dummy variable that equals 1 if the issue i is a direct offering (without an investment banker) and 0 otherwise The other variables are defined as in the previous section. The three cross-sectional regressions are successively estimated via OLS.. Table 6. illustrates the results from the estimated coefficients. As predicted, the dummy variable DI is significantly positive: once we control for the characteristics of the issue and the issuer, the private equity issue total cost is 390 basis points higher than the public equity issue cost. All things being equal, private issues are more costly than public issues. The variance is largely attributable to the discount, which is far higher for PIPEs. The mean difference of 4.14% may be attributable to the existence of information asymmetry and higher information costs for PIPEs. The lesser liquidity of PIPEs may be another determining factor. However, given that the resale restriction period was set at two months for securities authorities and four months for stock markets, it is unlikely that these restrictions explain the greater discounts.. 16.
(18) Table 6 confirms that size is inversely related to direct and indirect issue costs. Issuance is more expensive for small issuers that have a higher level of asymmetry of information and a greater risk. In particular, high technology companies are subject to a larger discount. Conversely, oil companies incur significantly lesser discounts and total costs. Companies that use the services of investment bankers and prestigious auditors are discounted significantly less than other companies, which corroborates previous studies of IPOs.8 Hot issue market periods are positively and significantly related to total costs and discounts, which is consistent with results reported in the literature. Nonetheless, direct costs tend to be unaffected by these intense issue periods, due to a higher volume of self-placements during these periods. ***Insert Table 6 here*** V. CONCLUSIONS The Canadian stock market offers an opportunity to examine how public and private equity issues differ in terms of issue costs. Using a sample of 2,108 PIPEs and 1,990 SEOs issued between 1993 and 2003, we document that total issue costs are greater for PIPEs than for SEOs. Mean (median) total cost is 14.28% (13.30%) for PIPEs, and 10.97% (7.55%) for SEOs. While the average (median) gross spread is slightly higher for SEOs than for PIPEs: 5.63% versus 4.30% (5.5% versus 5%), the average (median) discount is much larger for PIPEs than for SEOs: 9.99% versus 5.33% (8.74% versus 2.32%).. 8. See Daily et al. (2003) for a survey.. 17.
(19) We examine whether these average differences persist once we control for variables related to characteristics of the issuers (size, industry) and the issues (investment banker, auditor, conditions of the issue market). Our results confirm that, on average, PIPE total costs are 390 basis points higher than SEO total costs. The difference is even greater for indirect costs. However, direct SEO issue costs surpass PIPE issue costs, primarily because of a significant number of self-placements during the high tech bubble. In Canada, PIPEs outnumber SEOs. Our results offer an explanation of this phenomenon. PIPEs are known to close very quickly, and in some case are completed in a few days or weeks. In contrast, conventional offerings require several months. Ceding 4% of gross proceeds to reduce the issuance time by 6 months9 may be perfectly rational for firms with a high equity cost of capital. Further, the rising relative importance of PIPEs compared with SEOs, and the increase in self-underwritten PIPEs may reflect corrections of relative inefficiencies in the Canadian underwriting market, which is largely controlled by a few banks.. 9. According to Goldfarb (2003, p.244): “A PIPE transaction can be closed in fifteen to forty-five. days, compared to the typical four- to six-month timetable for a syndicated offering.” In Canada, according to TSX policy 4-1, the expedited private placement filing system permits issuers to obtain acceptance of certain smaller transactions within a few business days.. 18.
(20) REFERENCES Altinkilic, O. and R. S. Hansen (2003). "Discounting and Underpricing in Seasoned Equity Offers." Journal of Financial Economics 69(2): 285-323. Anand, A. I. (2003). "The Efficiency of Direct Public Offerings." Journal of Small and Emerging Business Law 7(3): 433-466. Ang, J. S. and J. C. Brau (2002). "Firm Transparency and the Costs of Going Public." Journal of Financial Research 25(1): 1-17. Anson, M. (2001). "Playing the PIPEs: The Benefits and Risks of Private Investments in Public Entities." Journal of Private Equity 5(1): 66-73. Bajaj, M., S. C. Mazumdar, et al. (2002). "The Costs of Issuing Preferred Stock." Journal of Financial Research 25(4): 577-592. Bayless, M. and S. Chaplinsky (1996). "Is there a Window of Opportunity for Seasoned Equity Issuance?" Journal of Finance 51(1): 253-278. Butler, A. W., G. Grullon, et al.(2003). Does Stock Market Liquidity Matter? Evidence from Seasoned Equity Offerings AFA 2004 San Diego Meetings. http://ssrn.com/abstract=471721 Carpentier, C. and J.-M. Suret (2003). "The Canadian and American Financial Systems: Competition and Regulation." Canadian Public Policy 29(4): 431-447. Chaplinsky, S. and D. Haushalter(2003). Financing Under Extreme Uncertainty: Evidence from PIPEs University of Virginia Working Paper. 45 p. http://faculty.darden.virginia.edu/chaplinskys/PEPortal/Documents/Financ ingunderExtremeUncertainty_Oct03.pdf. 19.
(21) Daily, C. M., S. T. Certo, et al. (2003). IPO Underpricing: A Meta-Analysis and Research Synthesis. Entrepreneurship: Theory & Practice. 27: 271-295 Ferreira, E. and L. D. Brooks (2000). "On Public versus Private Equity Placements: Pedagogical Illustrations." Financial Practice and Education(Fall/Winter): 241-247. Goldfarb, L. (2003). Investing in PIPEs: Finding Opportunity and Evaluating the Deal,. PIPEs: A Guide to Private Investment in Public Equity. S. Dresner, Bloomberg Press: 235-251. Helwege, J. and N. Liang (2004). "Initial Public Offerings in Hot and Cold Markets." Journal of Financial & Quantitative Analysis 39(3): 541-569. Hertzel, M. and R. L. Smith (1993). "Market Discounts and Shareholder Gains for Placing Equity Privately." Journal of Finance 48: 459-485. Hoffmann-Burchardi, U. (2001). "Clustering of initial public offerings, information revelation and underpricing." European Economic Review 45(2): 353-383. Jindra, J.(2000). Seasoned Equity Offerings, Overvaluation, and Timing SSRN Working Paper. 53 p. http://ssrn.com/abstract=216010 Kim, K. A. and H.-H. Shin (2004). "The Puzzling Increase in the Underpricing of Seasoned Equity Offerings." Financial Review 39(3): 343-365. Lee, I., S. Lochhead, et al. (1996). "The Costs of Raising Capital." Journal of Financial Research 19(1): 59-74. Marciukaityte, D., S. H. Szewczyk, et al. (2004). "Investor Overoptimism and Private Equity Placements." Journal of Financial Research (Forthcoming).. 20.
(22) Mola, S. and T. Loughram (2004). "Discounting and Clustering in Seasoned Equity Offering Prices." Journal of Financial and Quantitative Analysis 39: 1-23. Wu, Y. (2004). "The Choice of Equity-Selling Mechanisms." Journal of Financial Economics Forthcoming.. 21.
(23) Figure 1: Distribution of the three-month moving average of SEO issues, PIPE issues and total issues in Canada between January 1, 1993 and December 12, 2003. Total issues stand for the total number of SEO and PIPE issues. The horizontal lines represent the number of issues corresponding to the terciles of the three-month moving average distribution of total issues in Canada.. 140. 120. 100. 80. 60. 40. 20. Total. SEO. Source: Fpinfomart.ca. 22. PIPE. 9-2003. 5-2003. 1-2003. 9-2002. 5-2002. 1-2002. 9-2001. 5-2001. 1-2001. 9-2000. 5-2000. 1-2000. 9-1999. 5-1999. 1-1999. 9-1998. 5-1998. 1-1998. 9-1997. 5-1997. 1-1997. 9-1996. 5-1996. 1-1996. 9-1995. 5-1995. 1-1995. 9-1994. 5-1994. 1-1994. 9-1993. 5-1993. 1-1993. 0.
(24) Table 1: Annual distribution (frequencies) of PIPEs issuers between 1993 and 2003 along size deciles (Si, i=1 to 10) of the Canadian listed firms universe. Size deciles of the universe of listed Canadian companies. Number of issues. %. Number of issues. %. S1. 52. 1.5. 65. 2.7. S2. 64. 1.8. 44. 1.8. S3. 109. 3.0. 90. 3.8. S4. 184. 5.1. 103. 4.3. S5. 307. 8.6. 162. 6.8. S6. 540. 15.1. 151. 6.3. S7. 714. 19.9. 262. 11.0. S8. 895. 25.0. 353. 14.8. S9. 566. 485. 20.3. S10. 151. 15.8 4.2. 672. Total. 3,582. 100. 2,387. 28.2 100. Missing. 636. PIPEs. SEOs. 354. Note: Size deciles have been estimated annually over the 1993-2003 period. Each PIPE issuer has been assigned to a size decile corresponding to its market capitalization in the year of the issue. Sources: Fpinfomart.ca and Datastream. 23.
(25) Table 2: Sample characteristics and industrial distribution of the final sample of PIPEs and SEOs in Canada. All amounts are in million of Canadian $ PIPEs. SEOs. Panel A: Sample characteristics # Mean Median Size GP, in $ 2,108 Issuing period Cold 392 Neutral 695 Hot 1021 Investment banker Prest. IB 97 Non-prest. IB 1,447 No IB 564 Auditor Prest. aud. 1,048 Non-prest aud. 1,060. Total. #. Mean. Median. Total. 10.33. 4.00. 21,773.09. 1,990. 54.59. 15.00. 108,640.72. 8.94 12.80 9.18. 3.00 4.25 4.50. 3,504.33 8,896.99 9,371.77. 430 673 887. 63.28 55.71 49.54. 22.16 15.00 12.50. 27,208.45 37,490.40 43,941.86. 39.65 8.81 9.19. 16.5 4.8 2.50. 3,845.76 12,741.52 5,185.81. 422 1,568 -. 138.39 32.04 -. 65.30 8.70 -. 58,401.08 50,239.64 -. 12.83 7.85. 5.00 3.43. 13,450.73 8,322.36. 1,138 852. 62.44 44.11. 21.00 7.50. 71,060.30 37,580.42. Panel B: Industrial distribution Res. % Oil %. HT %. Other, %. Res. %. Oil %. HT %. Other, %. GP. 14.37. 19.88. 24.92. 22.96. 24.27. 27.84. 38.14. 27.61. Note: GP means gross proceeds, IB means investment banker, Aud. means auditor and prest. means prestigious. Res. %, Oil %, HT %, Other % is the percentage of the total gross proceeds of PIPEs (SEOs) issued respectively by resources, oil and gas, high tech-biotech and other companies. Source: FP infomart.ca. 24.
(26) Table 3: Test of public and private issue determinants.. Gross proceeds Resources Oil and gas High tech and biotech Prestigious investment banker Prestigious auditor Hot issue period. in in in in in in in. M$ % % % % % %. PIPEs N = 2,108 Mean 10.33*** 38.14*** 27.61*** 14.37*** 4.60*** 49.72*** 48.43**. SEOs N = 1,990 Mean 54.59 24.92 22.96 24.27 21.21 57.19 44.57. Probit Probit Estimate Pr>ChiSq 0.21 <0.0001 -0.21 0.0002 -0.14 0.0204 0.25 0.0001 0.59 <0.0001 -0.04 0.4094 -0.05 0.2835. Note: We estimate the following probit model:. DIi = a0 + a1 log(GPi ) + a2 DRi + a3DOGi + a4 DHTi + a5DUi + a6 DAi + a7 DHi + ei For I = 1 to n, with: DIi is a dummy variable that equals 1 if the issue i is a private placement of public equity and 0 otherwise. The probit procedure models the probabilities of having DII = 0; GPi is the gross proceeds in CA$ of issue i; DRi is a dummy variable that equals 1 if the issuing company belongs to the resources industry and 0 otherwise; DOGi is a dummy variable that equals 1 if the issuing company belongs to the oil and gas industry and 0 otherwise; DHTi is a dummy variable that equals 1 if the issuing company belongs to the high tech and bio tech industry and 0 otherwise; DUi is a dummy variable that equals 1 if the issuing firm hires a prestigious investment banker and 0 otherwise; DAi is a dummy variable that equals 1 if the issuing firm is audited by a prestigious auditor and 0 otherwise; all indications of statistical significance shown in the “PIPEs mean” column indicate whether the mean value for the relevant variable in the PIPE sample is statistically different from the mean for the same variable in the SEO sample. Sources: FPinfomart.ca and Datastream *** significant at 1% ** significant at 5% * significant at 10%. 25.
(27) Table 4: Annual distribution of PIPE and SEO issue size and issue costs. Year. Gross spread, in % Mean Median Panel A: PIPEs 1993 4.14 4.76 1994 4.14 5.00 1995 5.09 5.50 1996 5.98 6.00 1997 5.81 6.00 1998 4.59 5.00 1999 1.78 0.00 2000 1.83 0.00 2001 1.66 0.00 2002 3.03 0.00 2003 5.33 6.00 Total 4.30 5.00 Panel B: SEOs 1993 5.95 5.00 1994 6.02 5.00 1995 5.28 4.50 1996 5.69 5.00 1997 4.69 4.00 1998 4.72 4.00 1999 5.55 5.84 2000 5.97 6.25 2001 5.67 6.00 2002 5.65 6.00 2003 5.88 5.50 Total 5.63 5.50. Discount, in % Mean Median. Total cost, in % Mean Median. 13.37 11.25 14.72 13.49 10.85 5.48 2.73 14.13 -0.35 6.90 7.85 9.99. 11.11 11.11 12.00 11.76 10.58 5.81 0.35 13.25 0.00 5.26 5.45 8.74. 17.50 15.39 19.81 19.47 16.66 10.08 4.51 15.96 1.30 9.92 13.18 14.28. 15.20 14.61 16.09 18.11 17.07 10.60 4.79 16.67 0.00 8.51 11.26 13.30. 2.49 6.44 6.59 4.93 3.80 -1.80 5.84 14.72 2.21 2.18 5.22 5.33. 1.51 1.35 5.00 2.50 1.71 0.00 2.49 9.50 1.74 1.19 2.41 2.32. 8.44 12.45 11.86 10.62 8.49 2.92 11.39 20.69 7.88 7.82 11.09 10.97. 6.61 5.75 9.06 7.50 5.89 4.00 8.01 15.69 7.11 7.00 7.94 7.55. Note: the total cost is measured as gross spread plus discount. Discount is measured as (market price 10 days after the announcement date-issue price/issue price). Sources: Fpinfomart.ca and Datastream. 26.
(28) Table 5: Distribution of PIPE and SEO costs by industry, window of opportunity and use of investment bankers. Number. Gross spread, in % Discount, in % Total cost, in % Mean Median Mean Median Mean Median Panel A: Segmentation by sector Resource companies PIPEs 804 4.66 6.00 11.92 11.87 16.58 17.13 SEOs 496 6.08 6.00 4.85 2.99 10.93 8.45 Oil and gas PIPEs 582 4.37 5.00 4.13 3.42 8.51 8.39 SEOs 457 5.56 5.00 1.93 0.28 7.49 5.73 High Tech and Bio Tech PIPEs 303 3.75 4.75 12.96 10.15 16.71 14.89 SEOs 483 5.90 6.00 9.01 5.88 14.92 11.88 Other industries PIPEs 419 3.88 4.50 12.26 9.09 16.14 13.46 SEOs 554 5.06 4.24 5.37 1.53 10.42 6.27 Whole sample PIPEs 2108 4.30 5.00 9.99 8.74 14.28 13.30 SEOs 1990 5.63 5.50 5.33 2.32 10.97 7.55 Panel B: Segmentation along hot and cold issues markets SEO sample; periods defined using the number of SEO issues (three-month moving average) Cold 430 5.37 5.00 3.79 2.20 9.16 7.06 Neutral 673 5.64 5.50 4.17 2.27 9.81 7.46 Hot 887 5.75 6.00 6.97 2.52 12.72 8.10 PIPE sample; periods defined using the number of PIPE issues (three-month moving average) Cold 392 2.66 0.00 6.39 5.22 9.06 7.60 Neutral 695 3.83 5.00 10.17 9.09 14.00 13.88 Hot 1021 5.24 6.00 11.24 10.00 16.48 15.27 Panel C: Segmentation following use and reputation of investment bankers (IB) PIPEs Prestigious IB 97 5.07 5.00 7.24 5.00 12.31 9.42 Non-Prest.IB 1,447 5.92 6.00 10.58 9.64 16.50 15.27 No IB 564 0.00 0.00 8.94 7.14 8.94 7.14 SEOs Prestigious IB 422 4.50 4.00 1.70 0.49 6.20 5.00 Non-Prest.IB 1,568 5.94 6.00 6.31 3.32 12.25 8.92 Sources: Fpinfomart.ca and Datastream. 27.
(29) Table 6: Total, indirect and direct equity issue costs models. Results of Dependent variable Intercept DI I Log(GP i ) DR I DOG I DHT I DU I DNU I DA I DH I Adjusted R square F value. Regression 1 TC/P i 40.97 (9.55)*** 3.90 (4.93)*** -1.68 (-6.48)*** -1.69 (-1.74)* -7.43 (-7.36)*** 2.30 (2.16)** -2.98 (-2.52)** -8.30 (-7.32)*** -1.96 (-2.73)*** 1.85 (2.59)*** 5.58 27.91***. Regression 2 D/P i 26.55 (6.23)*** 4.14 (5.28)*** -1.14 (-4.41)*** -1.83 (-1.91)* -7.35 (-7.34)*** 1.94 (1.84)* -2.70 (-2.30)** -2.09 (-1.85)* -2.08 (-2.92)*** 1.87 (2.64)*** 4.23 21.11***. Regression 3 GS/P i 14.42 (43.38)*** -0.25 (-4.03)*** -0.54 (-27.02)*** 0.15 (1.95)* -0.08 (-1.04) 0.35 (4.29)*** -0.28 (-3.01)*** -6.21 (-70.74)*** 0.12 (2.14)** -0.02 (-0.40) 61.66 733.15***. Note: the model is:. Yi = a0 + a1DIi + a2 log(GPi ) + a3DRi + a4 DOGi + a5DHTi + a6 DUi + a7 DNUi + a8DAi + a9 DHi + ei. (2). Yi is TC/Pi, D/Pi or GS/Pi for the dependent variable. TC/Pi stands for the total cost of the issue i divided by the gross proceeds; D/Pi is the discount of the issue i divided by the gross proceeds; GS/Pi is the gross spread of the issue i divided by the gross proceeds. DIi is a dummy variable that equals 1 if the issue is a private placement of public equity and 0 otherwise. GPi is the logarithm of gross proceeds in CA$ of the issue i; DRi is a dummy variable that equals 1 if the issuing company belongs to the resources industry and 0 otherwise; DOGi is a dummy variable that equals 1 if the issuing company belongs to the oil and gas industry and 0 otherwise; DHTi is a dummy variable that equals 1 if the issuing company belongs to the high tech and bio tech industry and 0 otherwise; DUi is a dummy variable that equals 1 if the issuing firm hires a prestigious investment banker and 0 otherwise; DNUi is a dummy variable that equals 1 if the issue i is a direct offering and 0 otherwise; DAi is a dummy variable that equals 1 if the issuing firm i is audited by a prestigious auditor and 0 otherwise; DHi is a dummy variable that equals 1 if the issue month is hot and 0 otherwise. The sample includes 2,108 PIPEs and 1,990 SEOs completed in Canada between January 1993, 1 and December 31, 2003. Figures between brackets are Student t coefficients. White’s (1980) heteroskedastic-consistent t-statistics have also been calculated; the significant levels (not reported) are not modified, except for DNU i in regression 2, which becomes non-significant, and Du i in regressions 1 and 2, which become significant at 1% (rather than 5%). Sources: FPinfomart.ca and Datastream *** significant at 1% ** significant at 5% * significant at 10%. 28.
(30)
Figure


+4

Documents relatifs
A1, Magnetohydrodynamic instabilities in rotating and precessing sheared flows: An asymptotic analysis [?] Linear magnetohydrodynamic instabilities are studied analytically in the
The localised proton precipitating without a low- energy component occurs mostly in the morning-day sector, during quiet geomagnetic conditions, without substorm in- jections
Lui-même issu d’un quartier populaire montréalais, Michel Tremblay met en scène, dans son théâtre comme dans ses récits, des personnages québécois d’une
The author has determined that draft failure will occur if the mean flue gas temperature in the chimney falls below a value that depends on the neutral
Moreover, in the presence of lump-sum debt issuance costs, the optimal investment scale of - nancially constrained rms exhibits an inverted U-shaped relationship with the rm's
This paper clearly stressed the need for renewing the public policy approach towards the agricultural sector in view of the new development in private standards, at least in
Il a déclaré aux commissaires de police, R attaly et Marquand qu’il s’était caché dans la maison de peur d’une arrestation pour l’affaire de la Poste.. Du
To sum up, we have pointed out that Gibbs, among others, gives the strong impression that metaphors are not costly. We were skeptical of this claim, especially if the implication
