The following scientific article was officially published in the journal Spine Deformity (the official
journal of the Scoliosis Research Society), published by Elsevier. This article’s citation is as
follows:
Seoud, L., Cheriet, F., Labelle, H. and Parent, S. “Changes in Trunk Appearance After
Scoliosis Spinal Surgery and Their Relation to Changes in Spinal Measurements.” Spine
Deformity, Vol. 3, No. 6 (2015), pp.595-603.
The final publication is available via the DOI:
http://dx.doi.org/10.1016/j.jspd.2015.05.001
Due to publisher’s restrictions (12 month embargo, effective until November 2016), the
following pages reproduce the initial draft (preprint) rather than the manuscript in its accepted
form (postprint).
Lama Seoud, 2014
© 2014 Lama Seoud. This work is licensed under the Creative Commons
Attribution-NonCommercial-NoDerivatives 4.0 International License. To view a copy of this license,
visit:
This work was supported by the Natural Sciences and Engineering Re-search Council of Canada and MENTOR, a strategic training program of the Canadian Institutes of Health Research.
Corresponding author and address for reprints: Lama Seoud
Polytechnique Montreal
Department of Computer and Software Engineering P.O. Box 6079 Montreal, Quebec Canada H3C 3A7 Tel 1: 514-340-4711 (Ext: 7113) Tel 2: 514-802-5337 Fax: 514-340-4658 E-mail: lama.seoud@polymtl.ca
How well does scoliosis spinal surgery address the
correction of the external trunk deformities ?
Lama Seoud, Ph.Da,b, Farida Cheriet, Ph.Da,b, Hubert Labelle, MDb, Stefan Parent, MD, Ph.Db
a
Polytechnique Montr´eal, Qu´ebec, Canada
b
Sainte Justine Hospital Research Center, Montr´eal, Qu´ebec, Canada
Abstract
Study design: Retrospective study of scoliosis surgical outcome.
Objectives: To evaluate quantitatively the changes in trunk surface defor-mities after scoliosis spinal surgery in Lenke 1A AIS patients and to compare it with the changes in 2D and 3D spinal measurements.
Summary of background data: Most studies documenting scoliosis sur-gical outcome used either radiographs to evaluate changes in the spinal curve or questionnaires to assess patients health-related quality of life. Since im-proving trunk appearance is a major reason for patients to seek treatment, this study focuses on preoperative and postoperative changes in trunk sur-face deformities. Recently, a novel approach to quantify trunk deformities in a reliable, automatic and non-invasive way has been proposed.
Methods: 49 adolescents with Lenke 1A idiopathic scoliosis treated sur-gically were included in this study. The back surface rotation and trunk lateral shift were computed on trunk surface acquisitions before and at least 6 months after surgery. We analysed the effect of age, height, weight, curve severity before surgery, length of follow-up and the surgical technique. For 25 patients with available 3D spinal reconstructions, we compared changes in trunk deformities with changes in 2D and 3D spinal measurements.
Results: The mean correction rates for the back surface rotation and the trunk lateral shift are 18% and 50% respectively. Only the surgical tech-nique had a significant effect on the correction rate of the back surface rota-tion. Direct vertebral derotation and reduction by spine translation provide a better correction of the rib hump (22% and 31% respectively) than the classic rod derotation technique (8%). Significant yet limited correlations were found between the reductions of the back surface rotation and both the lumbar Cobb angle and the apical vertebrae axial rotation, and between the reduction of the trunk lateral shift and the coronal balance.
Conclusions: Current surgical techniques perform well in realigning the trunk, however the correction of the deformity in the axial plane proves to be more challenging. Local derotation of the vertebrae and better correc-tion of the lumbar curvature can potentially increase the correccorrec-tion of the rib hump.
Level of evidence: II
Keywords: Scoliosis, trunk surface measurement, surgical outcome
1. Introduction
Improving trunk appearance is a major reason for adolescent patients with scoliosis to seek treatment (1). They are concerned about the deformity and imbalance of their trunk as much as, if not more than, the curvature of their spine as assessed on radiographs (2). For patients undergoing scoliosis surgical correction, the degree of satisfaction with surgery highly depends on their postoperative self-image (3). Therefore, addressing trunk deformi-ties should be of great importance in the surgical treatment of adolescent idiopathic scoliosis (AIS).
In common practice, the surgical outcome of AIS is mainly reported in terms of reduction of the spinal curvature, by means of the Cobb angle mainly. This radiological measurement quantifies adequately how well the surgeon realigned the spine in the frontal plane. However, since there is no evidence of a direct relationship between the spinal curvature and the trunk deformity, the radiological outcome cannot assess by itself how well the surgery improved the trunk appearance.
Most studies attempting to document the changes in trunk shape before and after scoliosis spinal surgery involved questionnaires for patients (3), non-medical (4) and medical raters (5) to complete. The high subjectivity of most of these assessment forms has highlighted the need for an objective and quantifiable measurement of clinical trunk deformity (6).
In a previous paper, we have introduced a novel and reliable approach to quantify trunk surface deformities, using a non-invasive 3D reconstruction of the full torso (7). The objectives of the current study are: 1) to use this new index to document AIS surgical outcome in terms of changes in trunk deformities in AIS patients with Lenke 1A curve type, 2) to compare these changes with the changes in 2D and 3D spinal measurements.
2. Materials and Methods 2.1. Study design and patient data
We performed a retrospective analysis of the medical records, the spine radiographs and the trunk acquisitions of 49 AIS patients surgically treated at Sainte Justine Hospital (SJH), between May 2004 and August 2011, by one of three fellowship-trained orthopaedic surgeons. Our inclusion criteria were: a Lenke 1A main thoracic curve type, a posterior spinal fusion as
surgical approach, preoperative standard posterior-anterior (PA) and lateral (LAT) radiographs and full trunk acquisition taken at most 6 months prior to surgery, postoperative PA and LAT and full trunk acquisition taken at least 6 months after surgery. For ends of comparison between the radiographic and the trunk surface measurements, we tolerated a maximum of 6 months between the radiographic and the trunk surface acquisitions as long as both postoperative acquisitions were done at least 6 months after the surgery. A total of 25 patients out of the 49 satisfied this latter criterion and were thus included in the correlation analysis.
2.2. Trunk measurements
All trunk acquisitions and 3D reconstructions were obtained using a non-invasive optical system made of 4 Inspeck (Creaform r, Levis, Canada) digitizers, which provides a mesh of the whole trunk surface in less than 4 seconds and with an overall accuracy of 1.1 mm (8).
To describe the trunk deformities, more specifically the rib hump and the trunk imbalance in the frontal plane, we used multi-level trunk mea-surements described in our previous paper (7). Briefly, the back surface rotation (BSR) and the trunk lateral shift (TLS) are computed on 300 regu-larly spaced cross-sections extracted along the trunk height (Figure 1). The gap between two consecutive cross-sections is about 1mm on average. Cubic B-spline functions are then fitted to the resulting multi-level measurements to provide a continuous smooth functional representation of both the BSR and the TLS. These are noted fBSR(t) and fT LS(t) respectively, with t
be-ing the trunk level rangbe-ing between the level of the posterior superior iliac spines (t = 0) and the vertebral prominence of C7 (t = 300). Examples of functional representation of the trunk measurements are provided in figure
(a) (b)
Figure 1: Cross-sections extraction (a) and cross-sectional measurements (b). Horizontal sections are extracted along the trunk height (a). The BSR and TLS are measured on each cross-section (b).
2.
To quantify changes in BSR and TLS before and after the surgical treat-ment, we defined the relative correction rates (CR) as follows:
CRBSR(%) = 100 ∗R |f BSR pre (t)|dt −R |fpostBSR(t)|dt R |fBSR pre (t)|dt (1) CRT LS(%) = 100 ∗R |f T LS pre (t)|dt −R |fpostT LS(t)|dt R |fT LS pre (t)|dt (2) where fBSR
pre and fpreT LS refer to the preoperative functional measurements
and fpostBSR and fpostT LS refer to the postoperative functional measurements. A positive (negative) CR indicates an improvement (worsening) of the trunk deformity after surgery.
2.3. Spinal measurements
Using available preoperative and postoperative 3D reconstructions ob-tained from calibrated bi-planar PA and LAT radiographs using the EOS system (9, 10) for 25 patients in our cohort, the following 3D spinal mea-surements were computed: the proximal thoracic (PT), the main thoracic (MT) and the thoracolumbar/lumbar (TLL) Cobb angles computed in the frontal plane and in the planes of maximum curvature (PMC) computed for each spinal segment, the orientation of the three PMC with respect to the sagittal plane (11), the axial rotation and the translation of the apical verte-brae in the three segments and the coronal and sagittal balances reported in millimetres. A more detailed description of these 3D spinal measurements is available in (12).
2.4. Statistical analysis
For our first objective, we analysed the effect of age, height, weight at surgery, severity of the main thoracic curve pre-operatively, as well as the length of follow-up on the correction rates of the trunk measurements. Also, because each of the three orthopaedic surgeons who performed the surgeries of the 49 patients included in this study has a different surgical technique, we analysed also the effect of the surgical technique on the correction of trunk deformities. The first surgeon (O1) performs mostly a rod derotation, the second one (O2) adds a direct vertebral derotation to the rod derotation and the third one (O3) performs a reduction by spine translation. A single factor analysis of variance was performed to analyse the association between each of these factors and the BSR and TLS correction rates.
For our second objective, we conducted a correlation analysis between the differences and correction rates of the trunk measurements, and the
differences and correction rates of 2D and 3D spinal measurements. Con-sidering the size of our correlation cohort (N = 25), a correlation between two variables is considered statistically significant (p = 0.05) if the Pearson correlation coefficient R is greater than 0.396.
3. Results
3.1. Changes in back surface rotation and trunk lateral shift
Table 1 summarizes the descriptive statistics of our cohort. We had 42 females and 7 male AIS patients. The three orthopaedic surgeons O1, O2 and O3 performed respectively 21, 18 and 10 surgeries each, each one favouring his own surgical technique. None of the patients underwent a thoracoplasty.
Table 1: Descriptive statistics on the 49 scoliosis patients in our cohort
Mean Standard deviation Min – Max
Age at surgery (years) 15.5 2.0 11 – 19
Height at surgery (cm) 161.1 7.9 143 – 178
Weight at surgery (kg) 52.1 8.1 32 – 66
Preop thoracic Cobb angle (◦) 58 10 40 – 96
Postop follow-up (months) 21 16 6 – 83
Table 2 presents the BSR and TLS correction rates as defined in equa-tions 1 and 2 over all the cohort and per surgeons. These results prove that scoliosis spinal surgery induces a good correction of the TLS (median of 73%), but a limited correction of the BSR (median of 21%). Two pa-tients had a CRT LS inferior to -100%, meaning that after surgery the trunk
is twice as much shifted laterally as before the surgery. In fact, these two patients had a very mild trunk lateral shift prior to surgery.
Table 2: BSR, TLS and MT Cobb angle correction rates overall and per surgeon
Mean Median Standard deviation Min – Max
Overall CRBSR(%) 18 21 25 -59 – 66 O1 (N = 21) 8 13 24 -59 – 46 O2 (N = 18) 22 31 28 -29 – 66 O3 (N = 10) 31 34 13 5 – 46 Overall CRT LS(%) 50 73 65 -238 – 94 O1 (N = 21) 58 70 40 -47 – 94 O2 (N = 18) 44 75 81 -238 – 93 O3 (N = 10) 45 73 80 -178 – 86 Overall CRM T Cobb(%) 73 75 11 43 – 98 O1 (N = 21) 72 75 12 43 – 96 O2 (N = 18) 73 75 8 58 – 86 O3 (N = 10) 74 73 12 60 – 98
For ends of comparison, the correction rate of the main thoracic frontal Cobb angle are also reported in table 2 for the whole cohort and per surgeon. The average correction rate of 73% shows that a good realignment of the spine in the frontal plane is achieved. The standard deviations of the correc-tion rates show that the changes in trunk measurements are more variable (σ = 25 and σ = 65 respectively for BSR and TLS) than the correction of the MT Cobb angle (σ = 11).
Three cases are illustrated in figure 2. For each case, a color-depth map of the trunk allows for a better visualization of the deformity in the axial plane together with a general appreciation of the deformity in the frontal plane. On the right side, the functional representation of the BSR and the TLS before (dashed black line) and after (continuous red line) surgery are plotted together with the 95% confidence interval (gray) for both measurements (7). When the red curve gets out of the confidence interval, it means that there is a statistically significant difference between the measurements before and
after surgery. In the first case, a good and significant correction is achieved in both the frontal and the axial plane, even though a small rib hump appears on the right side of the patient in the proximal thoracic region. In the second case, the surgery achieves a good and significant correction of the TLS but no significant correction of the BSR. Finally, despite a good realignment of the trunk, the last case presents a significant worsening in the BRS in the lumbar region. The asymmetrical depth map after surgery clearly demonstrates a lumbar hump.
Table 3 presents the results of the regression analysis conducted to study the association between clinical variables and the correction of trunk defor-mities. The results showed that neither the age, the height, the weight at the surgery, the preoperative curve severity, nor the length of follow-up had a significant association with the correction rates of the BSR and the TLS (p > 0.05).
Table 3: Association with clinical variables
CRBSR CRT LS R2 F p R2 F p Age 0.003 0.124 0.72 0.000 0.000 0.98 Weight 0.001 0.068 0.79 0.003 0.151 0.69 Height 0.016 0.808 0.37 0.000 0.000 0.99 Preop Cobb 0.000 0.026 0.87 0.012 0.618 0.43 Length of follow-up 0.001 0.063 0.80 0.000 0.010 0.91
R2: coefficient of determination; F : Fischer statistic;
p: probability associated with F(1,47)
However, the analysis of variance showed that the surgical technique has a significant impact on the correction rate of the BSR (F(2,46) = 3.64,
p = 0.034). But it has no significant association with the correction rates of neither the TLS nor the main thoracic Cobb angle. Figure 3 presents the
(a) (b)
(c) (d)
(e) (f)
Figure 2: Illustration of 3 clinical cases. Subfigures (a), (c) and (e) present trunk surface depth maps before (on the left) and after (on the right) the spinal surgery. Subfigures (b), (d) and (f) present the BSR and TLS functional measurements. The curves correspond to the preoperative (dashed, in black) and the postoperative (in red) measurements. The interval in gray corresponds to the 95% confidence interval.
box plot representation of the correction rates per surgeon. No significant differences in terms of age, height, weight and preoperative main thoracic Cobb angle were noted between O1, O2 and O3 patients groups (p > 0.05).
(a) BSR correction rates per surgeon (b) TLS correction rates per surgeon Figure 3: Box plots of the correction rates per surgeon. Outliers are plotted as individual red cross points
3.2. Correlation between the changes in trunk deformity and spinal correc-tion
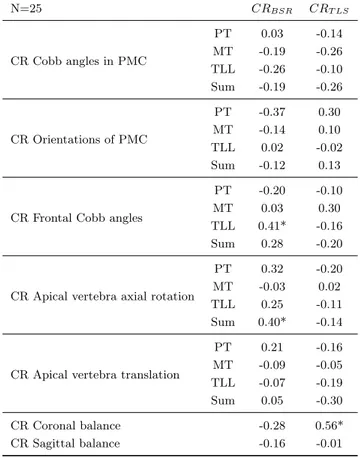
Table 4 shows the Pearson correlation coefficients obtained between BSR and TLS correction rates and 2D and 3D global and regional spinal mea-surements correction rates. These results are computed on the cohort of 25 patients whose 3D spinal reconstructions were available. Because CRBSR
and CRT LS are computed all along the trunk height and not regionally, we
also considered the correlation with the correction rates of the absolute sum of the PT, MT and TLL regional measurements.
The correlation analysis demonstrates a weak relationship between the spinal correction and the changes in trunk deformities. The only significant correlations (p < 0.05) found are between the TLS and coronal balance
correction rates (R = 0.56), between the absolute sum of apical vertebra axial rotations and BSR correction rates (R = 0.40), and between the TLL frontal Cobb angle and the BSR correction rates (R = 0.41).
Table 4: Correlation between spinal and trunk correction rates
N=25 CRBSR CRT LS CR Cobb angles in PMC PT 0.03 -0.14 MT -0.19 -0.26 TLL -0.26 -0.10 Sum -0.19 -0.26 CR Orientations of PMC PT -0.37 0.30 MT -0.14 0.10 TLL 0.02 -0.02 Sum -0.12 0.13
CR Frontal Cobb angles
PT -0.20 -0.10
MT 0.03 0.30
TLL 0.41* -0.16
Sum 0.28 -0.20
CR Apical vertebra axial rotation
PT 0.32 -0.20
MT -0.03 0.02
TLL 0.25 -0.11
Sum 0.40* -0.14
CR Apical vertebra translation
PT 0.21 -0.16 MT -0.09 -0.05 TLL -0.07 -0.19 Sum 0.05 -0.30 CR Coronal balance -0.28 0.56* CR Sagittal balance -0.16 -0.01 (*): p < 0.05; 4. Discussion
According to Pratt et al. (2), the rib hump prominence and the curve of the spine are the most important features of scoliosis that patients and their parents want surgery to assess. In this study, we aimed to document
the effect of scoliosis spinal surgery on the rib hump and the trunk lateral shift.
Using the proposed measurements, we were able to document a good correction of the trunk lateral shift after spinal surgery. The trunk realign-ment in the coronal plane seems to be generally well achieved. This is in concordance with the results of Asher et al. (15). They reported an improve-ment in the POTSI index in 39 out of 44 patients at the latest follow-up. Unfortunately, no correction rates are reported to compare our results to.
In the axial plane, the correction of the BSR proves to be more challeng-ing. In our cohort, we recorded a mean correction of only 18%, comparable to the results of Pratt et al. (23%) after two years follow-up of 34 patients with thoracic curve (13). These results reveal a persistent rib hump on the patient’s back, which might even be more accentuated in some cases after surgery (an example is given in Figure 2e). Other studies have document a greater reduction in the rib hump. Asher et al. (15) reported an improve-ment in the Suzuki hump sum, defined as a difference greater than 3.5, in 31 out of 44 patients; unfortunately no correction rates are provided. On a cohort of 109 Lenke 1A AIS patients, Newton et al. (14) reported a mean change of 7o, corresponding to a mean correction rate of 43%. The large variability between these studies is mainly attributable to the measurements considered to quantify the rib hump.
The strength of our study lies mainly in the measurements considered to quantify trunk deformities, more specifically the back surface rotation. While others have considered manual scoliometer measures (13, 14) in for-ward bending position, our measurements are computed automatically, in the standing posture and have proven to be reliable (7). Furthermore, our measurements are multi-level and computed all along the trunk height, as
opposed to the Suzuki hump sum calculated at 3 trunk levels, considered in the study of Asher et al.(15). This allows to document not only the ampli-tude of the deformity but also its extent. Furthermore, the trunk analysis is performed in a patient specific reference frame, making the measurements invariant to patient’s positioning during the topographic acquisition, as op-posed to other studies using only the back surface (15).
The analysis of variance revealed a significant association between the surgical technique and the correction of the BSR. The direct vertebral dero-tation and the reduction by spine translation, favoured by surgeons O2 and O3 respectively, seem to better address the back surface rotation than the classic rod derotation technique, favoured by surgeon O1. The local derota-tion of the vertebrae along the instrumented levels potentially induces some additional local derotation of the back, leading to a slightly better correction of the BSR. This particular finding raises the need for a prospective study with matched patients groups to compare the outcome of the three different surgical strategies.
The hypothesis regarding the positive effect of local derotation is further-more supported by the significant yet limited correlation (R = 0.40) found between the correction rates of the BSR and the sum of apical vertebrae axial rotation. It seems that the more the correction of the vertebrae rota-tion in the axial plane, the better the reducrota-tion of the rib hump. Also, the significant correlation between the correction rates of the BSR and the TLL Cobb angle (R = 0.41) suggests that a better realignement of the lumbar spine would increase to some extent the correction of the rib hump.
The remaining results of the correlation analysis demonstrate globally a weak relationship between the spinal correction and the subsequent changes in trunk appearance. The highest correlation was found between the
correc-tion rates of the trunk lateral shift and the coronal imbalance (R = 0.56), both measurements quantifying the trunk imbalance in the coronal plane. This emphasises the limit of considering only spinal measurements to assess the surgical outcome. As Lenke pointed out (6), scoliosis surgical outcome should be assessed upon three basis separately: radiographic correction, trunk deformity changes and patients self-assessment, each being an ”ex-tremely important part of the overall surgical outcome”.
Despite the advances in scoliosis 3D assessment using stereoradiography, scoliosis clinical evaluation and surgical planning are until now mainly based on preoperative radiographs of the spine which offer no information about the deformity in the axial plane. That could explain in part the difficulty in achieving better correction in the axial plane. Our team is developing a 3D simulation tool to predict the trunk shape after surgery using a physical model of the trunk surface and the bony structures. This powerful simulator could assist surgeons in planning their surgery. It could help them determine, together with the patient, the surgical strategy that could better address the trunk shape deformities and thus patients concerns.
Our study has a number of limitations. First, finding postoperative to-pographic data taken at least 6 months after surgery proved to be quiet challenging. Still, we gathered a cohort of 49 patients. However, for the correlation analysis, we had to keep only the patients who had also a 3D ra-diographic reconstruction available. This added criteria reduced our cohort size to 25 patients for this part the study making the correlation analysis of moderate strength. This part of the study would benefit from additional data.
Second, because of its retrospective nature, we were not able to evalu-ate the association between the changes in trunk deformities and patients
satisfaction to surgery as evaluated by self-assessment questionnaires. Un-fortunately, this important information was not available to be considered in the present study. In future studies, it would be very interesting to eval-uate how much of a correction in trunk shape is needed to be considered as satisfactory by the patients and its parents.
Finally, we included in this study only AIS patients with Lenke 1A, the most frequent curve type in AIS patients, in order to eliminate the curve type factor. However, in future studies, it would be relevant to evaluate the surgical outcome for each type of spinal curve.
5. References
[1] T. N. Theologis, R. J. Jefferson, A. Simpson, A. R. Turnersmith, J. C. T. Fairbank, Quantifying the cosmetic defect of adolescent id-iopathic scoliosis, Spine (Phila. Pa. 1976). 18 (1993) 909–912.
[2] R. K. Pratt, R. G. Burwell, A. A. Cole, J. K. Webb, Patient and parental perception of adolescent idiopathic scoliosis before and after surgery in comparison with surface and radiographic measurements, Spine (Phila. Pa. 1976). 27 (2002) 1543–1550.
[3] T. R. Haher, J. M. Gorup, T. M. Shin, P. Homel, A. A. Merola, D. P. Grogan, L. Pugh, T. G. Lowe, M. Murray, Results of the scoliosis research society instrument for evaluation of surgical outcome in ado-lescent idiopathic scoliosis - A multicenter study of 244 patients, Spine (Phila. Pa. 1976). 24 (1999) 1435–1440.
[4] T. Iwahara, M. Imai, Y. Atsuta, Quantification of cosmesis for patients affected by adolescent idiopathic scoliosis., Eur. spine J. 7 (1998) 12–15.
[5] R. Buchanan, J. G. Birch, A. A. Morton, R. H. Browne, Do you see what I see? Looking at scoliosis surgical outcomes through orthope-dists’ eyes, Spine (Phila. Pa. 1976). 28 (2003) 2700–2704.
[6] L. G. Lenke, Do you see what I see? Looking at scoliosis surgical outcomes through orthopedists’ eyes - Point of view, Spine (Phila. Pa. 1976). 28 (2003) 2705.
[7] L. Seoud, J. Dansereau, H. Labelle, F. Cheriet, Multilevel analysis of trunk surface measurements for noninvasive assessment of scoliosis deformities., Spine (Phila. Pa. 1976). 37 (2012) E1045–53.
[8] V. Pazos, F. Cheriet, L. Song, H. Labelle, J. Dansereau, Accuracy assessment of human trunk surface 3D reconstructions from an optical digitising system, Med. Biol. Eng. Comput. 43 (2005) 11–15.
[9] J. Dubousset, G. Charpak, I. Dorion, W. Skalli, F. Lavaste, J. Deguise, G. Kalifa, S. Ferey, A new 2D and 3D imaging approach to muscu-loskeletal physiology and pathology with low-dose radiation and the standing position: the EOS system, Bull. Acad. Natl. Med. 189 (2005) 287–297; discussion 297–300.
[10] D. A. Glaser, J. Doan, P. O. Newton, Comparison of 3D Spinal Recon-struction Accuracy: Biplanar Radiographs with EOS Versus Computed Tomography, Spine (Phila Pa 1976) 37 (2012) 1391–7.
[11] A. P. Sangole, C.-E. Aubin, H. Labelle, I. A. F. Stokes, L. G. Lenke, R. Jackson, P. Newton, Three-Dimensional Classification of Thoracic Scoliotic Curves, Spine (Phila. Pa. 1976). 34 (2009) 91–99.
[12] S. Kadoury, F. Cheriet, M. Beaus´ejour, I. a. Stokes, S. Parent, H. La-belle, A three-dimensional retrospective analysis of the evolution of spinal instrumentation for the correction of adolescent idiopathic scol-iosis., Eur. Spine J. 18 (2009) 23–37.
[13] R. K. Pratt, J. K. Webb, R. G. Burwell, a. a. Cole, Changes in sur-face and radiographic deformity after Universal Spine System for right thoracic adolescent idiopathic scoliosis: is rib-hump reassertion a me-chanical problem of the thoracic cage rather than an effect of relative anterior spinal overgrowth?, Spine (Phila. Pa. 1976). 26 (2001) 1778–87. [14] P. O. Newton, M. C. Marks, T. P. Bastrom, R. Betz, D. Clements, B. Lonner, A. Crawford, H. Shufflebarger, M. OBrien, B. Yaszay, Sur-gical treatment of Lenke 1 main thoracic idiopathic scoliosis: results of a prospective, multicenter study., Spine (Phila. Pa. 1976). 38 (2013) 328–38.
[15] M. Asher, S. M. Lai, D. Burton, B. Manna, Maintenance of Trunk De-formity Correction Following Posterior Instrumentation and Arthrode-sis for Idiopathic ScolioArthrode-sis, Spine (Phila. Pa. 1976). 29 (2004) 1782– 1788.