China and the Future of Asian Electronics Trade
30
0
0
Texte intégral
(2) CIRANO Le CIRANO est un organisme sans but lucratif constitué en vertu de la Loi des compagnies du Québec. Le financement de son infrastructure et de ses activités de recherche provient des cotisations de ses organisations-membres, d’une subvention d’infrastructure du Ministère du Développement économique et régional et de la Recherche, de même que des subventions et mandats obtenus par ses équipes de recherche. CIRANO is a private non-profit organization incorporated under the Québec Companies Act. Its infrastructure and research activities are funded through fees paid by member organizations, an infrastructure grant from the Ministère du Développement économique et régional et de la Recherche, and grants and research mandates obtained by its research teams. Les partenaires du CIRANO Partenaire majeur Ministère du Développement économique, de l’Innovation et de l’Exportation Partenaires corporatifs Alcan inc. Banque de développement du Canada Banque du Canada Banque Laurentienne du Canada Banque Nationale du Canada Banque Royale du Canada Banque Scotia Bell Canada BMO Groupe financier Bourse de Montréal Caisse de dépôt et placement du Québec DMR Conseil Fédération des caisses Desjardins du Québec Gaz de France Gaz Métro Hydro-Québec Industrie Canada Investissements PSP Ministère des Finances du Québec Raymond Chabot Grant Thornton State Street Global Advisors Transat A.T. Ville de Montréal Partenaires universitaires École Polytechnique de Montréal HEC Montréal McGill University Université Concordia Université de Montréal Université de Sherbrooke Université du Québec Université du Québec à Montréal Université Laval Le CIRANO collabore avec de nombreux centres et chaires de recherche universitaires dont on peut consulter la liste sur son site web. Les cahiers de la série scientifique (CS) visent à rendre accessibles des résultats de recherche effectuée au CIRANO afin de susciter échanges et commentaires. Ces cahiers sont écrits dans le style des publications scientifiques. Les idées et les opinions émises sont sous l’unique responsabilité des auteurs et ne représentent pas nécessairement les positions du CIRANO ou de ses partenaires. This paper presents research carried out at CIRANO and aims at encouraging discussion and comment. The observations and viewpoints expressed are the sole responsibility of the authors. They do not necessarily represent positions of CIRANO or its partners.. ISSN 1198-8177. Partenaire financier.
(3) China and the Future of Asian Electronics Trade* Byron Gangnes†, Ari Van Assche ‡ Résumé / Abstract L'émergence de la Chine comme étant un joueur clé dans l'industrie électronique mondiale a suscité de l’inquiétude parmi ses voisins de l'Asie de l'Est. Les économies à revenus élevé et moyen craignent que la montée de la Chine nuise à leur centre industriel électronique. Les économies plus pauvres, pour leur part, s'inquiètent du fait qu'elles ne pourront pas être compétitives face à la main d’œuvre bon marché sans limite de la Chine. Dans ce chapitre, nous décrivons les forces à l’origine de la montée de la Chine dans le domaine de l'électronique, et en étudions les conséquences pour le commerce électronique régional et les modèles de production. Employant une banque de données unique sur la production électronique mondiale, nous examinons les trajectoires de perfectionnement des économies de l’Asie de l’Est dans l’industrie. En accord avec la théorie de fragmentation de la production internationale, nous trouvons que le Japon et les nouvelles économies industrialisées détiennent une combinaison de production plus sophistiquée que leurs voisins à faible revenu. Ces derniers, cependant, voient leurs industries de l'électronique progresser plus rapidement. Mots clés : Chine, commerce, perfectionnement technologique, électronique.. China’s emergence as a key player in the global electronics industry has ignited concerns among its East Asian neighbors. Upper and middle-income economies fear that China’s rise is hollowing out their electronics industrial base. Lower-income economies worry that they cannot compete with China’s seemingly endless supply of cheap labor. In this chapter, we describe the forces behind China’s rise in electronics, and we consider the implications for regional electronics trade and production patterns. Using a unique world electronics production data set, we investigate the upgrading trajectories of East Asian economies within the industry. Consistent with the theory of international production fragmentation, we find that Japan and the NIEs have a more sophisticated production mix than their lower-income neighbors. These latter economies, however, are upgrading their electronics industries more rapidly. Keywords: China, trade, technological upgrading, electronics. Codes JEL : F14, O30, L63 *. We would like to thank Rodrigo Rodrigues and Porntawee Nantamanasikarn for excellent research assistance. Ari Van Assche thanks the fonds québécois de la recherche sur la société et la culture (FQRSC) for financial support. † University of Hawai’i at Manoa, Department of Economics, 2424 Maile Way, Room 513 Honolulu, Hawai’i 96822. Phone: (808) 956-7285. E-mail: gangnes@hawaii.edu. ‡ HEC Montréal and CIRANO..
(4) 1. Introduction In 2004 China overtook the US to become the world’s largest electronics exporter. In just a decade, the locus of global production for many familiar electronics products—ranging from HP computers to Apple iPods—has shifted from Japan and East Asian developing economies to China. As in other industries, the China electronics juggernaut has generated anxiety within the region about the implications of China’s ascendance. Among upper and middle-income East Asian economies there is fear that China’s rise is hollowing out their electronics industrial base. Lower-income countries worry that they cannot compete with China’s seemingly endless supply of low-cost labor. In contrast to Japan’s rise to prominence in the 1980s, China's electronics export surge is not fueled by the emergence of iconic Chinese companies, but is instead driven by the relocation of production to China by multinational corporations headquartered in the West and Japan, and by leading technology companies in the Newly Industrialzed Economies (NIEs) of Taiwan, Hong Kong, Singapore and South Korea. These companies were orginally drawn to China by low labor costs and favorable treatment in designated exportprocessing zones. Over the years, many leading electronics companies have moved their labor-intensive assembly plants to China in a bid to cut production costs, rapidly increasing China's exports. China’s rise as an electronics exporter is just the latest episode in the twenty-five year transformation of East Asia into the world’s dominant electronics production base. The region’s emergence has gone hand-in-hand with the development of global production networks in electronics. As electronic goods have become more modular, and as shrinking communication and transportation costs have reduced global distances, flagship companies in the US, Japan and Europe have increasingly fragmented their production value chains vertically and offshored manufacturing activities to relatively labor-abundant Asian economies. A similar story has taken place within the region, with the richer NIEs increasingly offshoring labor-intensive activities to less-developed countries, principally the four major ASEAN countries of Indonesia, Malaysia, the Philippines and Thailand. In this chapter, we explore China’s growing role in the global electronics industry, and we consider its implications for electronics trade and production within the East Asian region. We begin in section 2 with an overview of East Asia’s emergence as the locus of global electronics production and the recent surge to prominence of China. In section 3, we describe the process of international production fragmentation that underpins these changes. In section 4, we then map the patterns of specialization that are evident in the region’s trade flows. The key concerns within the region center on China’s threat as a low-cost competitor to the electronics production of other regional economies. The extent of this threat depends importantly on the ability of other countries to stake out production positions further up the value chain, and to upgrade their positions over time. Trade data are of limited use in assessing these issues, because the high volume of trade in intermediate components can mask the actual sophistication of a country’s electronics industry. Instead, in section 5 we 1.
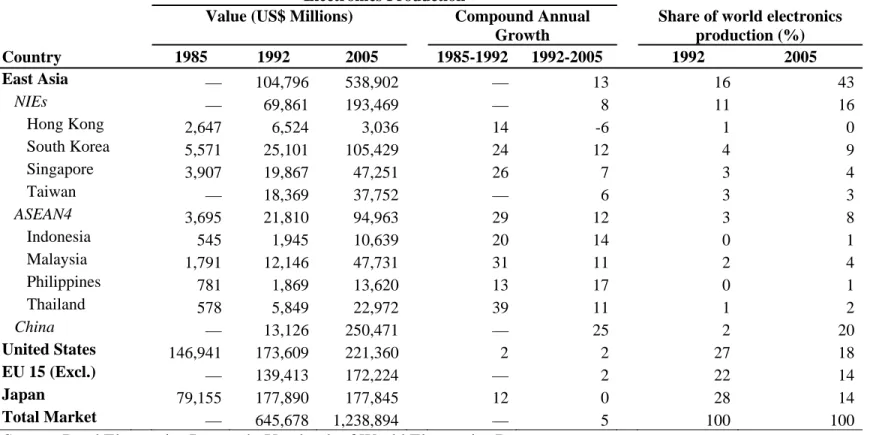
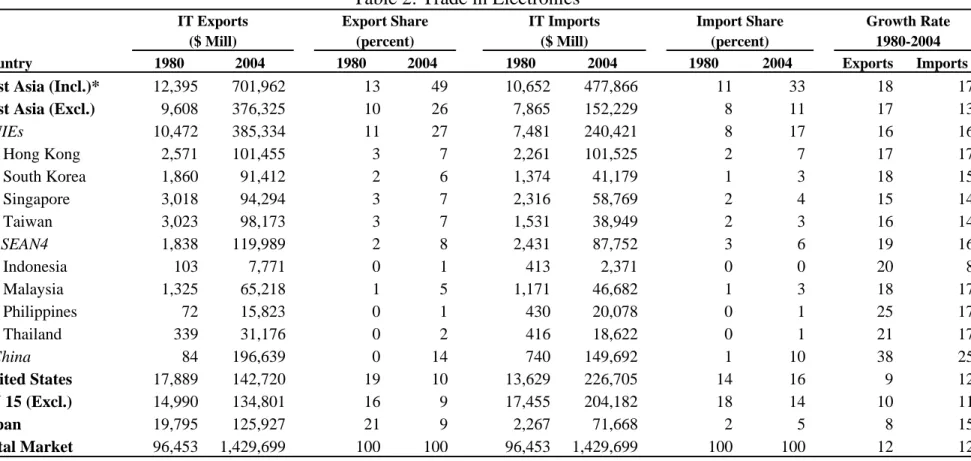
(5) use a unique dataset of electronics production statistics to estimate the level of technical sophistication of each East Asian economy, and to look for evidence of production upgrading. An analysis of trends in production and trade is then used in section 6 to assess whether China’s surge has in fact reduced the production shares of other countries or whether they are finding ways to hold their own in the face of these developments. It also allows us to speculate on the positive impacts that will come from further growth in China as a consumer of electronics products.. 2. East Asia’s Rise in Electronics and the Role of China Twenty-five years ago, developing East Asia was a minor player in the electronics industry. Most of the world’s production was centered in the United States and Europe, with Japan playing an important role particularly in consumer electronics. In 1985, the US produced 45% of the world’s electronics products, and Europe 21%. Japan’s share was 24%, and the country produced well over 50% of the world’s audio and video equipment. Together, the US, Europe and Japan produced more than 90 percent of all electronics products. National production levels in developing East Asia countries amounted to only a few billion dollars or less. As shown in Table 1, after 1985, there was a sharp takeoff in the region’s electronics production, and by 2005 the nine major developing East Asian economies (the NIEs, the ASEAN-4, and China—hereafter EA-9) represented 43% of global production, far exceeding the shares for Japan, the EU and the US. EA-9’s rapid rise to prominence was accomplished through astounding rates of production growth for the region’s electronics industry. During their most rapid periods of expansion, East Asian countries often experienced compound annual growth of 20–30% or more. As a result, the electronics sector contributed significantly to the excellent aggregate growth performance of East Asia. It also contributed to a dramatic industrial transformation across the region. Accompanying the surge in production was an equally dramatic growth in the region’s electronics trade.2 As shown in Table 2, EA-9’s electronics exports expanded at a compound annual rate of 18% between 1980 and 2004. World electronics exports grew at a slower 12% rate, so that by 2004 the share of global electronics exports held by EA-9 had grown to 49%, from just 13% in 1980. By 1990, the region had surpassed both the US and Japan as an electronics exporter, and by 2004 the region’s electronics exports at US$702 billion were more than the combined total of the US, Japan and the European Union.. 2. In this paper, we have used trade data from the Statistics Canada World Trade Analyzer. This dataset begins with raw trade data from the UN COMTRADE database and national sources but then “cleans” the data and makes other adjustments to produce globally-consistent figures. This is particularly important when studying the electronics sector because of differences in national treatment of trade passing through Hong Kong. See Feensta (2000). Limitations of the World Trade Analyzer data are limited disaggregation to only the four-digit SITC level and reporting delays (2004 is currently the most recent year available).. 2.
(6) Table 1: Growth of Electronics Production, 1985-2005. Country East Asia NIEs Hong Kong South Korea Singapore Taiwan ASEAN4 Indonesia Malaysia Philippines Thailand China United States EU 15 (Excl.) Japan Total Market. Electronics Production Value (US$ Millions) Compound Annual Growth 1985 1992 2005 1985-1992 1992-2005 — — 2,647 5,571 3,907 — 3,695 545 1,791 781 578 — 146,941 — 79,155 —. 104,796 69,861 6,524 25,101 19,867 18,369 21,810 1,945 12,146 1,869 5,849 13,126 173,609 139,413 177,890 645,678. 538,902 193,469 3,036 105,429 47,251 37,752 94,963 10,639 47,731 13,620 22,972 250,471 221,360 172,224 177,845 1,238,894. — — 14 24 26 — 29 20 31 13 39 — 2 — 12 —. Source: Reed Electronics Research, Yearbook of World Electronics Data. 3. 13 8 -6 12 7 6 12 14 11 17 11 25 2 2 0 5. Share of world electronics production (%) 1992 2005 16 11 1 4 3 3 3 0 2 0 1 2 27 22 28 100. 43 16 0 9 4 3 8 1 4 1 2 20 18 14 14 100.
(7) Table 2: Trade in Electronics. Country. IT Exports ($ Mill) 1980 2004. East Asia (Incl.)* East Asia (Excl.) NIEs Hong Kong South Korea Singapore Taiwan ASEAN4 Indonesia Malaysia Philippines Thailand China United States EU 15 (Excl.) Japan Total Market. 12,395 9,608 10,472 2,571 1,860 3,018 3,023 1,838 103 1,325 72 339 84 17,889 14,990 19,795 96,453. 701,962 376,325 385,334 101,455 91,412 94,294 98,173 119,989 7,771 65,218 15,823 31,176 196,639 142,720 134,801 125,927 1,429,699. Export Share (percent) 1980 2004. 13 10 11 3 2 3 3 2 0 1 0 0 0 19 16 21 100. IT Imports ($ Mill) 1980 2004. 49 26 27 7 6 7 7 8 1 5 1 2 14 10 9 9 100. 10,652 7,865 7,481 2,261 1,374 2,316 1,531 2,431 413 1,171 430 416 740 13,629 17,455 2,267 96,453. 477,866 152,229 240,421 101,525 41,179 58,769 38,949 87,752 2,371 46,682 20,078 18,622 149,692 226,705 204,182 71,668 1,429,699. Import Share (percent) 1980 2004. 11 8 8 2 1 2 2 3 0 1 0 0 1 14 18 2 100. Source: Statistics Canada World Trade Analyzer. *Incl. indicates that intra-regional trade is included; Excl. indicates that intra-regional trade is excluded.. 4. 33 11 17 7 3 4 3 6 0 3 1 1 10 16 14 5 100. Growth Rate 1980-2004 Exports Imports. 18 17 16 17 18 15 16 19 20 18 25 21 38 9 10 8 12. 17 13 16 17 15 14 14 16 8 17 17 17 25 12 11 15 12.
(8) The very rapid growth of East Asia’s electronics trade was accompanied by a rise in the importance of intra-regional trade. In 1980, only 23% of EA-9 electronics exports went to other EA-9 countries, and only 26% of imports came from other EA-9 countries. By 2004, 46% of exports were intra-regional and fully 68% of imports. The biggest external export market for East Asian producers continues to be the US, although both the EU and Japan have risen in relative importance. Japan plays a dominant role as a source of extraregional imports, but the US is also very important. Figure 1 demonstrates that the expansion and diffusion of East Asia’s electronics production and trade occurred in waves. The first wave, which began in about 1983, saw the NIEs rapidly expand their electronics exports. The NIEs initially began with laborintensive activities in consumer electronics products such as audio and video, moving later into electronic data processing and other more sophisticated areas. Growth in the ASEAN-4 countries also began about this time, but they remained very small players until the 1990s, when rising labor costs in the NIEs made ASEAN countries an attractive alternative. The most recent third wave—and in some ways the most dramatic—has been the surge of electronics production and trade in China since the early 1990s. China’s electronics exports breached the US$10 billion dollar mark for the first time in 1994 and had surged to nearly US$200 billion by 2004. In 2004, China’s share of world electronics exports, 14%, exceeded that of the US, EU, Japan and the ASEAN-4 countries, trailing only the NIEs, who as a group still commanded 27% of the world’s electronics exports.. 450 400. US$ Billions. 350 300 250. NIEs. 200. ASEAN‐4. 150. China. 100 50. Figure 1. East Asian Electronics Exports. 5.
(9) US$ Billions ‐3.5. ‐3.0. ‐2.5. ‐2.0. ‐1.5. ‐1.0. ‐0.5. 0.0 World US Total EU‐15 ROW. Final Parts. Japan ASEAN‐4 NIE. Figure 2. China’s Electronics Trade Balance, 1987. China’s recent emergence has led to a major restructuring of the region’s trade and production patterns. This is evident from an examination of China’s changing bilateral trade patterns in electronics. As is shown in Figure 2, in 1987 China was a net importer of both electronics components and electronics final goods from its major trading partners. By 2004, however, a different picture had emerged (see Figure 3). China was no longer a net importer of electronics products, but rather had built up an impressive trade surplus of US$43.7 billion. This trade surplus was driven by a dramatic increase of China’s net exports of electronic final goods that more than offset China’s rising trade deficit in electronic components. The breakdown of China’s bilateral trade patterns by trading partners shows that China primarily sources its components from its East Asian neighbors while sending its final goods to high-income countries. China is a net importer of electronics components from Japan, the NIEs and the ASEAN-4. It is a net exporter of electronics final goods to the United States, the EU-15 and Japan. The primary source countries for Chinese component imports vary by component type. Table 3 reports the bilateral import shares from each of China’s East Asian neighbors and the rest of the world in 2004. Note first that more than 80 percent of China’s component imports came from Japan and the NIEs. Taiwan, Singapore and Malaysia sent relatively more active components (SITC 776), primilary semiconductors. Japan, on the other hand, sent relatively more passive components (772) such as switches and relays, while South. 6.
(10) US$ Billions ‐60. ‐40. ‐20. 0. 20. 40. 60. 80. World US Total EU‐15. Final Parts. ROW Japan ASEAN‐4 NIE. Figure 3. China’s Electronics Trade Balance, 2004. Table 3. Sources of China’s Component Imports, 2004 Share of China’s Imports (%) Office Telecom Passive Active equip. parts equip. parts components components Japan 15.2 12.2 22.4 14.6 NIEs 68.1 71.8 54.3 67.2 Hong Kong 59.7 49.4 27.7 28.4 Taiwan 2.8 5.2 17.5 24.8 South Korea 3.9 15.9 6.5 6.9 Singapore 1.7 1.3 2.6 7.1 ASEAN-4 4.2 3.6 2.5 9.0 Malaysia 0.3 1.4 1.0 5.8 Thailand 1.7 1.6 1.1 2.6 Indonesia 0.5 0.4 0.4 0.4 Philippines 1.7 0.2 0.0 0.2 ROW 12.5 12.4 20.8 9.4 Source: Statistics Canada World Trade Analyzer. Korea specialized in telecom equipment parts (7649). Hong Kong and the Philippines, finally, sent relatively more parts for office equipment (759). These trade patterns demonstrate China’s emergence during the 1990s as a key final assembly platform for East Asia’s electronics industry. This role is confirmed by data on the extent of “processing trade” in overall Chinese electronics exports, reported in Table 4. Processing trade—the practice of assembling duty free imported inputs for export— 7.
(11) represented fully 92 percent of China’s electronics exports in 2000 and 58 percent of its electronics imports. Foreign-invested enterprises were at the core of China’s electronics processing trade. In 2000, 84 percent of China’s electronics exports were conducted by firms with at least 25 percent foreign ownership. On the import side, the share of foreigninvested enterprises was 86 percent. In twenty-five years, East Asia has become the center of global electronics production. In the past decade, China has emerged as the leading electronics final assembler. We turn in the next section to a discussion of the forces that have driven these rapid transformations. Table 4. Chinese Electronics Processing Trade, 2000 Processing trade as Share of foreign firms share of total trade in processing trade Exports Imports Exports Imports Final goods 93.7 17.7 82.6 84.9 Intermediate goods 90.6 66.8 85.8 86.0 TOTAL 92.1 58.1 84.3 85.5 Source: China’s Customs Statistics. 3. Modularity and Theory of International Production Fragmentation The theory of international production fragmentation can be used to explain the gravitation of global electronics production to East Asia and the evolving roles of China and the other EA-9 countries. This framework provides a comparative advantage rationale for the development of global production networks and the resulting growth in intra-industry trade. The theory of international production fragmentation posits that if different stages of the production process are separable and have varying factor intensities, then firms in laborscarce developed countries have an incentive to relocate their labor-intensive production blocks into low-wage countries (Jones & Kierzkowski 1990, Jones & Kierzkowski 2001). Firms will only do so, however, if the benefits of fragmenting their production process exceed the extra costs of coordinating activities across borders. Such coordination costs include trade and investment barriers, transportation costs, communication costs and governance costs. In this context, the expansion of international production fragmentation in the global electronics industry has been largely driven by three mutually reinforcing developments. First, the modularization of electronics products has enabled the industry to more easily slice up the value chain into separable production stages. Second, technological innovations in communication and transportation have improved the efficiency of coordinating geographically dispersed production stages (Jones and Kierzkowski 2001).. 8.
(12) Third, liberalization policy reforms in both home and host countries have considerably reduced barriers to trade and investment. A minimum technical requirement for fragmentation is separability of production stages. The modularization of electronics products in the last few decades has significantly increased the separability of electronics production (Sturgeon, 2002; Van Assche, forthcoming). Modularity is a technological property of a product that is related to the way different components of a final good interact with one another. When a product is non-modular, components need to be specifically adjusted to one other in order to achieve the desired performance of the final product, thus making it difficult to locate their production in different places. On the contrary, modular products consist of loosely coupled components that interact with one another through well-defined and codified architectural standards. Advances in information technology have enabled electronics firms to more easily standardize the interfaces between components, thus allowing for production separability. The advent of the Personal Computer (PC) is perhaps the best example of this. Before the PC, electronics companies generally built computers with a fully closed proprietary architecture. The non-modular system implied a high cost of coordinating interoperability between components and led firms to produce almost all components—semiconductors, hardware and operating systems—in-house and usually within one country (Dedrick & Kraemer 1998, Chandler 2001). IBM’s adoption of a modular architecture for its PC dramatically reduced costs of coordinating activities across stages. Because standards of compatibility and interoperability among components were fixed and publicly known (Langlois & Robertson 1995), component manufacturers could improve their piece of the system independently from others, and then the various components could be easily assembled. The modular structure of the PC also induced fragmentation by increasing competitive pressure on multinational enterprises (MNEs). Once the de facto standards of interoperability and compatibility were set, barriers to entry into the industry were substantially lowered and thousands of IBM clones and component producers entered into the various niches of the computer business. The resulting competition drove down prices in almost all areas (Langlois & Robertson 1995). In order to survive in this highly competitive environment, electronics producers were forced to reduce production costs by moving labor-intensive production blocks to East Asia (Dedrick & Kraemer 1998). In addition, as component prices fell, labor costs became a bigger share of PC production costs (Curry & Kenney 1999), further increasing pressures on firms to improve labor productivity through international fragmentation. The NIEs initially, and the ASEAN-4 and China later, were seen as a favorable place to move labor-intensive electronics production blocks for a number of reasons. First, the region had already demonstrated success in consumer electronics production as early as the 1960s (Lowe & Kenney 1999). The region was known to have not only an abundant supply of low-wage labor but also a large and growing pool of high-skilled engineers. In addition, East Asia had a relatively stable political and macroeconomic environment, conducive to long-term investment projects and business relations (Yusuf 2001). 9.
(13) Changes within the region during the 1980s enhanced its attractiveness. During the early part of the decade, a number of East Asian countries changed their policy stance from import substitution to export promotion, providing an improved environment for international business linkages. Reductions in trade barriers are particularly important for international production fragmentation, where a good needs to cross borders multiple occasions during the production process (Hummels, Rapoport & Yi, 1998). Deregulation of domestic insurance, banking and transportation sectors also helped support East Asia’s emerging role. At the same time, there have been technological changes that reduce coordination costs and shrink global distance. In the past few decades, the cost of making phone calls has reduced precipitously; computers have allowed virtually costless means of communication via e-mail and Internet; the use of fax machines has decreased the need for courier services and sped up the communication of important documents. These reductions in communication costs have made it easier for firms to coordinate, manage and monitor production activities in different locations. Transportation costs have also declined, particularly for air freight. The combination of technological and economic developments transformed the electronics industry and drove East Asia’s ascendance. Throughout the 1980s and 1990s the number of foreign affiliates of MNEs producing in the region mushroomed, and stronger relations were built with non-affiliated host country firms. As we noted above, the NIEs joined the global electronics production networks first. As electronics producers in the NIEs gained in expertise, and as their labor costs rose, competitive pressure forced new rounds of offshoring to lower-wage ASEAN countries and then to China, both by rich-country MNEs and by companies headquartered in the NIEs.. 4. Mapping Fragmentation in the Electronics Industry3 To analyze the role of international production fragmentation on East Asian trade patterns, studies by Ng & Yeats (2001) and Athukorola (2001) have compared trade in intermediate goods with that of final products. They found that in a broad range of industries Asian component trade has grown particularly rapidly, and that within the region assembly operations have tended to migrate to lower-income countries. In this section, we show that similar patterns exist in the electronics industry. Table 5 shows electronics export and import shares for China, the NIEs, and the ASEAN-4 countries, divided into intermediate and final goods categories.4 Not surprisingly, the US 3. We have deliberately borrowed this section title from Lall et al. (2004).. 4. We construct seven electronics categories based on three and four digit SITC Rev. 2 data. Four of the nine are judged to be predominantly “Intermediate Goods” and the remaining three categories are primarily “Final Products”. “Intermediate Goods” comprise active components, such as transistors, integrated circuits, etc. (SITC 776) and passive components, such as switches, relays, fuses, etc. (772), as well as parts for electronic data processing and office equipment (759) and parts for telecom. related devices (764.9). “Final Products” include electronic data processing 10.
(14) and EU-15 dominate final goods demand, purchasing a combined 42–50% of the final goods exports of the EA-9. The US market is particularly important for ASEAN countries (especially Malaysia). Developing Asia’s imports of final goods come primarily from within the region. Trade patterns for intermediate goods are very different. The NIEs are the most important source of intermediate electronics imports for other developing Asian countries, but they are also the leading destination for the region’s component exports. (Japan and the US also export a substantial portion of their component production to NIEs.) The NIEs in turn export heavily to China, as well as to other NIE countries. Hong Kong takes the largest share of these component exports by the NIEs, but there are significant bilateral flows in virtually all directions. Table 5. Patterns of East Asian Electronics Trade (Percentages) Final Goods. NIES ASEAN CHINA. NIES ASEAN 12.3 18.3 23.4. NIES ASEAN CHINA. NIES ASEAN 23.5 39.6 66.4. CHINA 6.2 4.7 4.0. CHINA 15.2 13.2 13.9. Export shares US EU 20.2 20.1 9.7 32.6 --27.6. 22.1 15.1 22.4. Import Shares US EU 40.1 7.6 22.8 7.9 --5.9. 4.4 5.3 3.4. Export shares US EU 28.9 12.3 11.6 14.8 --19.8. 10.9 15.6 15.8. Japan 6.9 9.1 11.8. Japan 7.5 9.2 8.8. Intermediate Goods. NIES ASEAN CHINA. NIES ASEAN 22.7 31.2 40.0. CHINA 10.2 7.3 4.7. Import Shares NIES ASEAN CHINA US EU NIES 33.6 11.3 19.1 10.5 ASEAN 38.7 6.8 5.8 20.1 CHINA 66.6 6.6 --4.2 Source: Statistics Canada World Trade Analyzer.. Japan 6.5 11.2 9.7. Japan 6.4 11.1 6.3. and office equipment (SITC 751 and 752), television receivers (761), and telecommunication equipnent (764.1 and 764.2) Trade data for two three-digit electronics categories was excluded from our analysis, because no data for the category was provided in the Statistics Canada World Trade Analyzer (763, television and sound recorders) or the available data was not sufficiently detailed to permit subdivision between intermediate and final goods (762, radio-broadcast receivers). 11. 17.5 16.2 15.0.
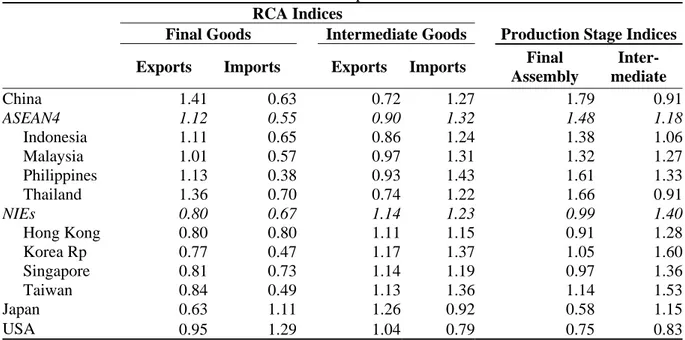
(15) These trade patterns suggest that country groups within East Asia play distinct roles in the electronics industry. The NIEs are primary involved in the production and export of intermediate goods. The lower-income ASEAN-4 economies are big importers of parts, which are used to produce final goods for sale both in the middle-income NIE markets and especially in developed-country markets. China closely resembles the ASEAN-4 countries, but with an even stronger bias toward final goods exports. The relative positions of the region’s economies within electronics production value chains can be seen more clearly through the use of revealed comparative advantage (RCA) indices. Measures of export RCA are often used to help assess a country’s export specialization. A value that exceeds unity implies that the country has a greater than average share of electronics exports in that category.5 Ng & Yeats (2001) argue that a similar import RCA index can be used as a reliable predictor of specialization in final product assembly. A country that specializes in the export of final assembly is likely to import more than proportionately parts and components in that sector. It follows that countries with above average import shares for components in a sector are relatively heavily specialized in assembly operations. Export and import RCA indices for East Asian electronics are given in Table 6 (RCA indices for detailed subcategories are reported in Gangnes and Van Assche, forthcoming.) As expected, the ASEAN-4 countries have final good export RCA indices that are above 1, indicating that final goods make up a larger-than-average share of their electronics exports. Their export RCA indices for intermediate goods are below one. Import RCAs for ASEAN-4 show the opposite pattern: high import intensity in intermediate goods and lower-than-average imports of final goods. Again we see that China is similar to the ASEAN-4 economies, although even more specialized as a producer of final goods. The NIEs exhibit high intermediate good intensity on both the import and export side. And the US and Japan are disproportionately heavy importers of final goods while also exporting a significant amount of intermediate goods. We can combine information from export and import RCAs to rank Asian developing economies according to their degree of specialization in final good and intermediate good activities. These summary indices are reported as the final two columns of Table 6. The final assembly stage index is the product of the intermediate good import RCA and the final good export RCA; higher values suggest more intensive specialization in final assembly activities. The intermediate stage index is the product of export and import. 5. The export RCA index is calculated as the ratio of two ratios, the ratio of exports for each subsection of electronics in an economy to that economy’s total electronics exports, relative to the ratio of world exports for each corresponding section to world total electronics exports. The index reveals the pattern of export specialization for an economy relative to worldwide patterns. The greater a sector’s RCA, the more an economy specializes in that sector’s exports relative to world specialization patterns. The import RCA index is defined analogously. While such indices by definition measure the degree of specialization of exports in product categories, the term “revealed comparative advantage” is an unfortunate misnomer. Because trade may be highly distorted by trade barriers and implicit or explicit domestic taxes and subsidies, such measures may “reveal” little about the actual comparative advantage of countries. 12.
(16) RCAs for intermediate goods; high values suggest high degrees of specialization in the intermediate good stage of the electronics value chain. Looking first at the final assembly stage index, note that the ASEAN-4 countries plus China occupy the top five spots, and that China ranks number one. These countries occupy the furthest downstream position in the electronics value chain, specializing in the assembly of final electronics products. The NIEs generally have smaller final assembly indices, and the US and Japan—large final goods consumers—have the smallest index values. Four of the top-five ranked economies on the intermediate stage index are the NIEs, who occupy a position further upstream, sourcing relatively unsophisticated parts from lower-wage Asian economies that they use to produce more sophisticated electronics components. They then supply these components to China and other lowerwage Asian economies for final assembly. (The Philippines relatively high ranking on the intermediate stage index comes from its high degree of specialization in semiconductors. We’ll discuss this further below.) Table 6. Electronics Trade Specialization in East Asia RCA Indices Intermediate Goods. Production Stage Indices Final InterExports Imports Exports Imports Assembly mediate China 1.41 0.63 0.72 1.27 1.79 0.91 ASEAN4 1.32 1.48 1.18 1.12 0.55 0.90 Indonesia 1.11 0.65 0.86 1.24 1.38 1.06 Malaysia 1.01 0.57 0.97 1.31 1.32 1.27 Philippines 1.13 0.38 0.93 1.43 1.61 1.33 Thailand 1.36 0.70 0.74 1.22 1.66 0.91 NIEs 1.14 1.23 0.99 1.40 0.80 0.67 Hong Kong 0.80 0.80 1.11 1.15 0.91 1.28 Korea Rp 0.77 0.47 1.17 1.37 1.05 1.60 Singapore 0.81 0.73 1.14 1.19 0.97 1.36 Taiwan 0.84 0.49 1.13 1.36 1.14 1.53 Japan 0.63 1.11 1.26 0.92 0.58 1.15 USA 0.95 1.29 1.04 0.79 0.75 0.83 Notes: Final assembly stage index is the product of the intermediate good Import RCA index and the final good export RCA index. Intermediate stage index is the product of the intermediate good import RCA index and intermediate good export RCA index. Final Goods. This approach to analyzing East Asia’s trade patterns is useful for demonstrating specialization patterns within the electronics industry. There is often a presumption that the countries specializing in intermediate good exports are engaged in activities with a higher degree of technical sophistication than those engaged in assembly activities. In fact, these trade data provide no direct evidence on levels of technical sophistication, nor are they particularly useful in assessing countries’ upgrading trajectories, areas of key concern to policymakers within the region. We address these issues in the following section.. 13.
(17) 5. The China Challenge: Can Asia Upgrade? We have noted above that China’s rapid emergence as an electronics production powerhouse has ignited concerns about possible adverse implications for other East Asian economies. The ASEAN-4 countries fear an inability to compete in final assembly activities with China’s rising competence and seemingly endless supply of cheap labor (Ernst, 2004). The higher-income countries such as Japan and the NIEs worry about industrial hollowing out as final assembly activities are moved to China and that the production of more complex components may soon follow. These concerns are tied up with the question of how successfully electronics sectors within the region can reposition themselves to exploit segments of the value chain that are complementary to China’s assembly activities. How able are they to upgrade their level of sophistication in order to create and maintain comparative advantage in higher-value activities? To our knowledge, there are no existing quantitative studies that assess technological upgrading by East Asian countries in the electronics industry. The chief obstacle to such an empirical exercise is the lack of data customarily used to measure variation in the technology intensity of production activities. Standard measures of technology intensity such as R&D as a share of sales and number of patents cannot be used since crosscountry data do not exist at such a disaggregated intra-industry level. Lall et al. (2006) and Hausmann et al. (2007) propose a methodology for estimating the technology intensity of a product indirectly using trade data. The two studies posit that a product is more sophisticated the higher the weighted average income of its exporting countries. The rationale is that richer countries generally have characteristics that provide a comparative advantage in more-advanced industries. These characteristics may include high capital abundance, the embodiment of higher-level technology and better institutions. This methodology permits a ranking of products according to their implied sophistication level and an estimate of a country’s technology level by analyzing its export mix. As we argue in Van Assche and Gangnes (forthcoming), however, export data can be a poor indication of the nature of production activities that take place in a country. Export data are collected and reported as gross flows rather than as the value added created in the exporting country. In an electronics industry characterized by international production fragmentation and widespread intermediate good trade, a country's exports will not necessarily reflect the embodied technology and relative endowments that have gone into the country's domestic production activities, but may simply reflect the technology and factors of the countries from which it imports intermediate goods. This may lead to significant biases in the estimated technology level of a country’s production activities.6 A more promising approach is to estimate a country’s revealed technology level in 6. See Baldone et al. (2007), Van Assche et al. (forthcoming) and Amiti and Freund (forthcoming) for similar arguments.. 14.
(18) electronics using production data rather than trade data. A unique dataset of electronics production is available in the Reed Electronics Production Data Set (REP), which measures a country's domestic production in a number of electronics categories for 51 countries. The data can be used to assess the relative sophistication of the electronics production mix of various East Asian economies and China and to look for evidence of technological upgrading by these countries. The coverage and degree of disaggregation in the REP varies across countries, but we have been able to extract a consistent panel for 9 electronics categories from 1992 to 2005 that is in line with our definition of electronics above (See Table 7 for the list of product categories). Table 7. Electronics Product Categories Category Type of Products Electronic Data Processing Computers, peripherals Office Equipment Photocopiers, electronic calculators Radio Communications and Radar Mobile radio telephones, pagers Telecommunications Telephones, fax, answering machines Video Equipment Television, video camera, DVD player Audio Equipment Portable audio, car audio, CD player Active Components Integrated circuits, diodes, transistors Passive Components Printed circuit boards, relays, switches Other Components Microphones, loudspeakers, amplifier Source: Reed Electronics Research Following Hausmann et al. (2007), we proceed in two steps. In the first step, we estimate the level of technological sophistication of each electronics category as the weightedaverage income of its producers between 2002 and 2005.7 Once the sophistication index has been estimated for all electronics categories, we proceed to calculate a country's technology index (CTI) as the production-weighted average of the sophistication levels of the electronics categories that it produces. (See the Appendix for details.) In Table 8, we present the sophistication indices for the various electronics categories and group them into three categories of high-, medium- and low-sophistication products. Within the electronics industry, there is a wide variation in revealed sophistication between the electronics categories. “Video equipment” and “audio equipment”, for example, are estimated to have degrees of sophistication that are just 39 and 52 percent that of the most sophisticated product category “radio communications and radar”. In line with our expectations, components (“active components”, “passive components” and “other components”) and final telecom goods (“radio comms. & radar” and “telecommunications”) are revealed to be high-sophistication products. The final goods “electronic data processing” and “office equipment” are medium-sophistication products 7. Sophistication indices can change substantially over time, both because of differential growth in national incomes and changing patterns of specialization by countries of different income levels. See the discussion in Gangnes and Van Assche (forthcoming). For the present analysis, we apply constant sophistication indices based on average data for the 2002-2005 period to focus on production upgrading. 15.
(19) and the final goods “audio equipment” and “video equipment” are low-sophistication products.. Table 8. Absolute and Relative Product Sophistication Indices PRODUCT CATEGORY. SOPHISTICATION INDEX. RELATIVE SOPHISTICATION INDEX. High sophistication Radio communications and radar Passive components Other components Active components Telecommunications. 21,434 19,330 18,947 18,270 18,254. 1.00 0.90 0.88 0.85 0.85. Medium sophistication Electronic data processing Office equipment. 17,393 16,076. 0.81 0.75. Low sophistication Audio equipment Video equipment. 11,092 8,338. 0.52 0.39. Source: Authors’ calculations based on Reed Electronics Research data.. With this sophistication index in mind, we can evaluate the relative sophistication of East Asian countries’ electronics industries by looking at their patterns of production specialization. In Table 9, we present the shares of production by East Asian countries in the high-, medium- and low-sophistication categories. Table 9 confirms that there is a wide variation in production specialization across East Asian economies, which is to a large extent in line with their level of economic development. In 2005, the richer East Asian economies of Japan and the NIEs were generally more specialized in high-sophistication products and less specialized in medium- and low-sophistication products than their less developed neighbors. The richer East Asian countries have a production mix that is similar to high-income OECD countries overall, while the less-developed economies of China, Vietnam and the ASEAN-4 are relatively more specialized in low and medium-sophistication products and less specialized in high-sophistication products.. 16.
(20) Table 9. Shares of Countries’ Electronics Production by Sophistication Category (Percentages). Japan NIEs South Korea Taiwan Singapore Hong Kong ASEAN-4 Philippines Malaysia Thailand Indonesia China Vietnam High-Income OECD. HighSophistication 1992 2005 50.7 68.9 48.1 64.9 61.0 73.9 48.5 77.4 35.0 52.8 47.9 55.7 53.5 53.7 80.0 67.9 55.3 56.8 35.3 47.1 43.5 43.0 45.7 35.3 — 43.2 57.5 65.9. MediumSophistication 1992 2005 33.3 19.8 38.0 27.0 15.5 20.9 44.8 15.3 52.6 44.6 39.1 27.2 21.2 32.3 11.3 29.8 14.6 30.4 42.1 39.7 16.7 29.3 18.1 50.6 — 26.5 32.2 28.6. LowSophistication 1992 2005 16.0 11.03 13.9 8.1 23.5 5.3 6.7 7.3 12.4 2.6 13.0 17.1 25.3 14.0 8.7 2.3 30.1 12.8 22.5 13.2 39.8 27.8 36.3 14.1 — 30.3 10.3 5.5. Source: Authors’ calculations based on Reed Electronics Research data. There are several notable exceptions to this pattern, however, that warrant discussion. A surprisingly large share of production activity in the Philippines is in the highsophistication category. In 1992, a staggering 80 percent of its electronics production was in high-sophistication products, a share that was not only larger than its East Asian neighbors, but that was also significantly larger than for the typical high-income OECD country. In 2004, this share had come down to 67.9 percent, but it remained higher than its richer neighbors, the NIEs. This result to a large extent reflects the lack of granularity of the product categories in the REP data. An industry study by Austria (2006) confirms that more than half of Philippine electronics production takes place in the highsophistication category “active components,” which primarily consists of semiconductors. But the role of the Philippines in the semiconductor industry is largely limited to the labor-intensive assembly and testing segments of semiconductor production. Its role in the capital-intensive production stages of wafer design and fabrication remains very minor. Japan’s and Hong Kong’s relatively large share in low-sophistication products can be explained in a similar fashion. In 2005, 11 percent of Japan’s electronics production and 17 percent of Hong Kong’s electronics production was “audio equipment” and “video equipment,” shares significantly higher than the 5.5 percent share of high-income OECD countries overall. This is likely due to the fact that the audio and video equipment produced in these countries falls in a higher-quality, higher-price segment of the market than those produced in Indonesia or Vietnam. A comparison of the 1992 and 2005 production shares in Table 9 shows that the electronics production mix of the various East Asian countries has evolved over the 17.
(21) fourteen-year period. Japan and the NIEs have moved away from low- and mediumsophistication activities into high-sophistication production activities. The ASEAN-4 countries (with the exception of Thailand) and China have increased their specialization in the medium-sophistication category primarily at the expense of low-sophistication products. By altering their production mix, East Asian countries have to varying degrees begun to catch up with the high-income OECD countries. Upgrading trajectories for these countries can be assessed by tracking changes in their CTIs over time. Figure 4 shows that Japan, the NIEs, the ASEAN-4 and China have all seen an increase in their CTI relative to the high-income OECD countries, although the net change for Japan and ASEAN-4 was very small. (The common downward drift shared by many East Asian countries after 2000 reflects more rapid increases in sophistication by high income-OECD countries.). CTI relative to high‐income countries. 1 0.98 0.96 China. 0.94. Japan 0.92. NIEs ASEAN‐4. 0.9 0.88 0.86 1992 1994 1996 1998 2000 2002 2004. Figure 4. CTI Relative to High-Income OECD Countries, Country Groupings. There continues to be wide variation in CTI across countries within the East Asian region. The relative CTIs of the richer economies of Japan and the NIEs consistently register higher than those of the developing economies of ASEAN-4 and China, but China and ASEAN-4 have seen periods of more rapid upgrading. China and the better-performing ASEAN countries have begun to close the technological gap. An analysis of individual East Asian countries’ upgrading trajectories reveals a high degree of heterogeneity within the NIEs and ASEAN-4. In Figure 5, we graph the upgrading trajectories of the NIEs individually. The figure shows that two NIEs have upgraded their electronics production mix, while two have actually adopted a lesssophisticated production mix. The most significant upgrader has been South Korea, which in 1992 had a CTI level only slightly higher than that of the ASEAN-4 countries, 18.
(22) but which rapidly moved up to become the regional CTI leader by 1998. Singapore has also seen a positive upgrading trajectory, albeit less steep. Taiwan and especially Hong Kong, however, have seen their CTI drop relative to high-income OECD countries. For both countries, this is due to the increase in their low-sophistication share and relatively small increase in high-sophistication shares. 1.02. CTI relative to high‐income OECD. 1.00 0.98 China. 0.96. Japan. 0.94. Hong Kong. 0.92. Singapore South Korea. 0.90. Taiwan. 0.88 0.86 1992. 1994. 1996. 1998. 2000. 2002. 2004. Figure 5. NIEs’ Upgrading Trajectory. In Figure 6, we conduct a similar analysis for the ASEAN-4 countries and Vietnam. In line with our analysis above, the Philippines is the outlier with a CTI consistently higher than that of Japan, the NIEs and the high-income OECD countries. This is due to their extremely large share in high-sophistication semiconductor products. Malaysia and Thailand, on the other hand, have followed an upgrading trajectory similar to China. Finally, Indonesia’s upgrading path seems to have been reversed in the wake of the Asian Financial Crisis. Indeed, Indonesia’s CTI is currently similar to that of Vietnam. In line with the theory of international production fragmentation, our analysis confirms that the production mix of Japan and the NIEs is of a higher sophistication level than that of China and the ASEAN-4. Japan and the NIEs are specialized in the production of the high-sophistication components and telecom products while China and the ASEAN-4 primarily focus on medium-sophistication electronic data processing (EDP) and office equipment. These results suggest that the richer East Asian economies have been able to retain a production mix that is complementary to that of China. Thailand and Malaysia face a more direct competition from China due to their highly similar production mix, and yet they too have shown some progress in upgrading over time.. 19.
(23) CTI relative to high‐income OECD countries. 1.03. 0.98 China Japan. 0.93. Indonesia Malaysia 0.88. Philippines Thailand. 0.83. Vietnam. 0.78 1992. 1994. 1996. 1998. 2000. 2002. 2004. Figure 6. ASEAN’s Upgrading Trajectory. But our analysis also shows the high degree of dynamism that exists in East Asia’s electronics industry. Nearly all East Asian countries have at least partially caught up with the high-income OECD countries over the last fourteen years by upgrading into more sophisticated electronics production activities. If they can continue this upward trajectory, the electronics industry can continue to act as a source of growth in the standard of living for the East Asian region. It is important to note that this analysis focuses solely on electronics production and ignores non-production activities where much of the innovation in electronics takes place, and where most of the value added occurs. A recent study by Dedrick et al. (2007) shows that Japan and the United States continue to capture the largest share of the value in iPods and notebook PCs despite the fact that very little production takes place in these countries. To the extent that leading companies in the NIEs are beginning to move into these more lucrative areas of product development, design, and marketing, our results may underestimate their progress moving up the value chain. Certainly this is true for Japan. This may also provide a development route for other East Asian countries as production capability is upgraded across the region.. 6. Prospects for Asian Production and Trade Despite some evidence of upgrading, there remains a considerable gap between the sophistication of electronics production of Japan and the NIEs on the one hand and China and ASEAN on the other. China and ASEAN (particularly Thailand and Malaysia) now occupy similar positions, with some evidence of upgrading for both camps. Even if developing East Asia is able to respond to China’s emergence by further upgrading, there 20.
(24) is still a question about whether these economies can maintain market share in the face of surging Chinese exports in areas of direct competition. In this section, we look at recent trends in production and trade values for an indication of how they are faring. China has captured much of the growth in global electronics production in recent years, but (perhaps surprisingly) most Asian developing economies have maintained or seen modest gains in their global production shares. Most significantly, the ASEAN-4—who specialize in the same final assembly activities as China—have largely maintained their global position in EDP and office equipment, with some small share losses for individual countries since 2000 (Figure 7). While Taiwan, Singapore and Hong Kong have reduced their production shares in this category through offshoring to the ASEAN-4 and China, South Korea’s share has risen. And all developing Asian economies have experienced growth in their global shares of active and passive components (Figure 8). Across all electronics categories, the EA-9 have seen their share of global production rise from 14% in 1992 to 23% in 2005. And, because of rapid growth in the global market for electronics, the dollar value of electronics production by the NIEs and ASEAN-4 has grown from US$92 billion to US$288 billion over this time period.. 70% 60% 50% ASEAN‐4. 40%. NIEs. 30% 20%. Japan. 10%. China. 0%. Figure 7. Shares of Global Production, EDP and Office Equipment. 21.
(25) 70% 60% 50% ASEAN‐4. 40%. NIEs. 30% 20%. Japan. 10%. China. 0%. Figure 8. Shares of Global Production, Active and Passive Components. In fact, China’s gains have come largely from reductions in Japanese electronics production, as well as an overall rise in the share of global electronics production taking place in East Asia. Once again, this reflects the extensive offshoring of production by MNEs to low-cost—but increasingly competent—East Asian facilities, as well as the movement of higher-income countries out of production into service areas. This process is likely to continue. In addition to potential changes in global market shares, developing East Asia will also be affected by growth in the Chinese domestic market for electronics. Indeed, China is already playing a measurable positive role. As shown in Figure 9, between 1990 and 2004, The share of the region’s final goods exports going to China rose from 2% to more than 16%. The intermediate good share is larger, rising from 6% in 1990 to 26% in 2004. In both cases, the largest increases in shares occurred after 2000. To date, the NIEs have seen the biggest direct effect from growing Chinese electronics import demand; the shares of ASEAN-4 exports to China in 2004 were 9.7% for final goods and 11.6% for intermediate goods. Nevertheless, the growth trajectory is very positive for both groups of East Asian countries; the shares of ASEAN-4 final and intermediate goods exports bound for China roughly tripled between 2000 and 2004. Every developing East Asian country has seen rapid growth in the value of its exports to China since 2000, ranging from an 80% increase for the Philippines to a 280% increase for Taiwan.. 22.
(26) 30% 25% 20% 15%. Final. 10%. Intermediate. 5% 0% 1990 1992 1994 1996 1998 2000 2002 2004 Figure 9. China’s Share in Developing East Asia's Electronics Exports. While it is surely foolhardy to make long-term predictions for such a dynamic industry, there are several reasons to think that China will continue to shape trade patterns in East Asia’s electronics industry. First, the process of offshoring to China probably still has considerable room to run. If there may not be much potential for growth in computer assembly—where China already has a third of global production activity—it is yet a small player in areas of higher sophistication such as component production. This may change as components become ever more standardized, as competition pushes other Asian countries up the technology ladder and as enterprises in China acquire more technological competencies. Second, China’s domestic market for electronics products is set to take off as rising incomes lead to further growth in domestic consumer spending. This will likely spur China to import ever more electronics components and final goods from its East Asian neighbors. Finally, the graduation of some high-income East Asian countries from electronics production into higher-value service areas is a new trend that needs to be taken into account when analyzing future trade and production patterns. There remains a question about the prospects for China and other recent entrants such as the ASEAN-4 and Vietnam to capture more profitable slices of the global electronics value chain. We have noted that the emergence of East Asia in electronics was made possible by the modularization of production and the resulting vertical fragmentation of value chains. But, as Steinfeld (2004) has argued, this has commoditized many electronic components and forced Chinese producers in particular to compete aggressively on price in markets with very thin margins. While we have provided some evidence of upgrading to more sophisticated product types, it is not clear that this has contributed to great valueadded being captured by developing Asian firms. This will likely remain an important challenge going forward.. 23.
(27) 7. Conclusions In this chapter, we have reviewed the emerging role of China as a major electronics producer and considered its implications for East Asian electronics production and trade. We have taken advantage of a unique electronics production data set collected by Reed Electronics Research to investigate the upgrading trajectories of East Asian countries in the highly dynamic electronics industry. Consistent with the theory of international production fragmentation, we find that Japan and the NIEs have a more sophisticated electronics sector due to their specialization in high-sophistication components while China and the better-performing ASEAN countries focus on medium-sophistication computer assembly. These latter countries, however, are upgrading their electronics industries more rapidly. Since this is titled a paper on Asian trade, it is reasonable to ask why there is no mention of India or other South Asian economies. The simple answer is that these countries remain minor players in global electronics production. Of course this may change over time, and the same paper written ten years from now may very well need to include these economies. Of bigger concern today is the exclusion from our analysis of the area in which India excels, information technology services. That industry is of interest in its own right, but also because, as we have seen, part of the evolution that is taking place in electronics involves the gravitation of higher-income economies away from production into product development, design, marketing and other service areas. And in an interconnected world, service provision may increasingly substitute for trade in electronics goods themselves. We can only note this limitation of the present analysis and mark this as an important area for further research. This graduation to services can play havoc with our interpretation of trade statistics, since in the polar case where a country has completely shifted to service aspects of the value chain, it would appear to have absolutely no specialization in electronics whatsoever. In some ways, this is an extreme analogue of a general problem in using trade statistics to assess specialization patterns in the electronics industry: because of the extensive trade in components, gross trade flows may tell us little about the true factor content or level of sophistication of a country’s production. In particular, countries that are specialized in the final stages of a value chain (here China and the ASEAN-4) appear to be much more open and much more competitive than they really are. We have tried to address this problem by using statistics on national production levels. But this is a general problem that practitioners should consider when analyzing industries such as electronics with internationally fragmented production structures. Once the structure of international production is understood, and the positions of individual countries within production networks are identified, trade in electronics—like all trade—is driven by familiar principles of comparative advantage. Countries specialize based on factor endowments, technology intensity and other influences on relative costs. But in electronics, comparative advantage can shift rapidly, resulting in the dramatic shifts in the locus of production that we have seen in East Asia in the last twenty-five years. 24.
(28) References Amiti, M. & Freund, C. (forthcoming). “An Anatomy of China’s Export Growth,” in: Feenstra, R. & Wei, S.-J. (Eds.) China’s Growing Role in World Trade, Chicago, University of Chicago Press. Athukorola, P. (2003), “Product Fragmentation and Trade Patterns in East Asia,” mimeo. Austria, M. (2006), “Enhancement and Deepening of the Competitiveness of the Philippine Eelectronics Industry Under a Bilateral Setting”, Philippine Instite for Development Studies Discussion Paper Series No. 2006-09, February 2006. Baldone, S., Sdogati, F. & Tajoli, L. (2007), “On Some Effects of International Fragmentation of Production on Comparative Advantages, Trade Flows and the Income of Countries,” The World Economy 30(11), 1726–1769. Bonham, C., Gangnes, B. & Van Assche, A. (2007), “Fragmentation and East Asia’s information technology trade,” Applied Economics 39, 215–228. Chandler, A. D. (2001), Inventing the Electronic Century: The Epic Story of the Consumer Electronics and Computer Industries, The Free Press, New York. Curry, J. & Kenney, M. (1999), “Beating the clock: corporate responses to rapid change in the PC industry,” California Management Review 42(1), 8–36. Dedrick, J. & Kraemer, K. (1998), Asia’s Computer Challenge: Threat Or Opportunity for the United States and the World? , Oxford University Press, Oxford. Dedrick, J.; Kraemer, K. & Linden, G. (2007), “Capturing Value in a Global Innovation Network: A Comparison between Radical and Incremental Innovation,” mimeo. Ernst, D. (2004), “Global production networks in East Asia’s electronics industry and upgrading perspectives in Malaysia,” In: Yusuf, S.; Altaf, A. & Nabeshima, K. (Eds.), Global production networking and technological change in East Asia., The World Bank, Washington DC. Feenstra, R. (2000), “World Trade Flows, 1980-1997,” Center for International Data, UC—Davis, March, revised. Gangnes, B. and Van Assche, A. (2007), “Global Production Networks in Electronics and Intra-Asian Trade,” prepared for the SCAPE-EABER workshop ‘Intra-Asia Trade and Factor Flows: Trends, Determination and Implications.’ Singapore, 89 October 2007. Forthcoming in conference volume. Hausmann, R; Hwang, J. & Rodrik, D. (2007) What You Export Matters, Journal of Economic Growth, 12, 1-25. Hummels, D.; Rapoport, D. & Yi, K.-M. (1998), ‘Vertical Specialization and the Changing Nature of World Trade’, Federal Reserve Bank of New York Economic Policy Review 4(2), 79–99. Jones, R. & Kierzkowski, H. (1990), “The Role of Services in Production and International Trade: A Theoretical Framework,” In: Jones, R. & Krueger, A. 25.
(29) (eds.), The Political Economy of International Trade: Essays in Honor of Robert E. Baldwin, Blackwell, Cambridge, MA, pp. 31–48. Jones, R. & Kierzkowski, H. (2001), “A Framework for Fragmentation,” In: Arndt, S. & Kierzkowski, H. (eds.), Fragmentation: New Production Patterns in the World Economy’, Oxford University Press, New York, pp. 17–34. Lall, S.; Albalajedo, M. & Zhang, J. “Mapping Fragmentation: Electronics and Automobiles in East Asia and Latin America” Oxford Development Studies 32(3), 407-432. Lall, S.; Weiss, J. & Zhang, J. (2006), “The Sophistication of Exports: A New Trade Measure,” World Development 34(2), 222–237. Langlois, R. & Robertson, P. (1995), Firms, Markets, and Economic Change: A Dynamic Theory of Business Institutions, Routledge, London. Lowe, N. & Kenney, M. (1999), “Foreign Investment and the Global Geography of Production: Why the Mexican Consumer Electronics Industry Failed’, World Development 27(8), 1427–43. Ng, F. & Yeats, A. (2001), “Production Sharing in East Asia: Who Does What for Whom and Why?” In: Cheng, L. & Kierzkowski, H. (eds.), Global Production and Trade in East Asia, Kluwer Academic Publishers, Boston. Reed Electronics Research (2007) Guide to the Interpretation of the Statistics, Mimeo. Steinfeld, E. (2004) “China’s Shallow Integration: Networked Production and the New Challenges for Late Industrialization.” World Development 32(11), pp. 1971-1987. Sturgeon, T. (2002) “Modular Production Networks: A New American Model of Industrial Organization. Industrial and Corporate Change 11, 451–496. Van Assche, A. (forthcoming), “Modularity and the Organization of International Production,” Japan and the World Economy. Van Assche, A. & Gangnes, B. (forthcoming), “Electronics Production Upgrading: Is China Exceptional?” Applied Economics Letters. Van Assche, A., Hong, C. & Slootmaekers, V. (2007), “China’s International Competitiveness: Reassessing the Evidence”, mimeo. Yusuf, S. (2001), “The East Asian Miracle at the Millennium,” In:¸Stiglitz, J. & Yusuf, S. (Eds.) Rethinking the East Asian Miracle, Oxford University Press, New York, pp. 1–53.. 26.
(30) Appendix To estimate countries’ position on the technology ladder as well as their upgrading trajectory in the electronics industry, we apply Hausmann et al.’s (2007) methodology to the 51 countries and 9 electronics categories in the REP data. In a first step, we compute for each product in each country its production intensity index (PII). Let xi,c denote the production value of electronics category i in country c so that X c = ∑ i xi ,c equals country 's total electronics production value. The PII of country i in product c is then given by: xi ,c Xc PII i ,c = ∑ c xi,c. ∑. c. Xc. In a second step, we estimate for the years 2002, 2003, 2004 and 2005 the level of technological sophistication of each electronics category as the weighted-average income of its producers. Let Yc represent country c's per-capita GDP in current prices. Then the level of product sophistication S for good i is given by. Si = ∑ ωi ,cYc c. where a country’s weight ωi,c equals. ωi ,c =. PII i ,c. ∑. c. PII i ,c. In a third step, we then use the average product sophistication S from 2002-2005 to calculate a country's technology index CTI as the weighted average of the sophistication levels of the electronics categories that it produces: CTI c = ∑θi ,c Si i. where a product's weight θi,c equals the share of good i in country c's total electronics output: x θi ,c = i ,c Xc. We can then analyze countries’ upgrading trajectories by comparing their CTIs over time.. 27.
(31)
Figure


+7


Documents relatifs
To test the potential clinical relevance of the IFN α 17/ α 2 ratio in disease we applied both IFN α 2 and pan-IFN α assays to plasma from patients with
Specialty section: This article was submitted to Head and Neck Cancer, a section of the journal Frontiers in Oncology Received: 29 August 2018 Accepted: 22 November 2018 Published:
outsourcing production.. Because firms only sell their products abroad if their profits are at least zero – that is, if variable income at least equals fixed costs – two
Motile cilia, laterality and primary ciliary dyskinesia The plenary speaker Martina Brueckner (Yale University, USA) opened the scientific part of the meeting with an introduction
Les délais d’accès à une hotte stérile, la rareté d’informations vali- dées sur la conservation des produits, la rigueur des techniques d’asepsie devant être pratiquées par
n Digital electronics design (front-end board) partly common n Same crate with a dedicated backplane for trigger treatment. Components have been tested
The trigger logic is of course a very crucial feature of the electronic system, because it must assure that EAS signals corresponding to EECR of energy below 10 20 eV can be
Write the trade balance equation under free trade (or equivalently the equilibrium in the domestic labor market) and show how this determines a second relationship between
