Are Firms That Received R&D Subsidies More Innovative?
24
0
0
Texte intégral
(2) CIRANO Le CIRANO est un organisme sans but lucratif constitué en vertu de la Loi des compagnies du Québec. Le financement de son infrastructure et de ses activités de recherche provient des cotisations de ses organisations-membres, d’une subvention d’infrastructure du Ministère du Développement économique et régional et de la Recherche, de même que des subventions et mandats obtenus par ses équipes de recherche. CIRANO is a private non-profit organization incorporated under the Québec Companies Act. Its infrastructure and research activities are funded through fees paid by member organizations, an infrastructure grant from the Ministère du Développement économique et régional et de la Recherche, and grants and research mandates obtained by its research teams. Les partenaires du CIRANO Partenaire majeur Ministère du Développement économique, de l’Innovation et de l’Exportation Partenaires corporatifs Alcan inc. Banque de développement du Canada Banque du Canada Banque Laurentienne du Canada Banque Nationale du Canada Banque Royale du Canada Banque Scotia Bell Canada BMO Groupe financier Bourse de Montréal Caisse de dépôt et placement du Québec DMR Conseil Fédération des caisses Desjardins du Québec Gaz de France Gaz Métro Hydro-Québec Industrie Canada Investissements PSP Ministère des Finances du Québec Raymond Chabot Grant Thornton State Street Global Advisors Transat A.T. Ville de Montréal Partenaires universitaires École Polytechnique de Montréal HEC Montréal McGill University Université Concordia Université de Montréal Université de Sherbrooke Université du Québec Université du Québec à Montréal Université Laval Le CIRANO collabore avec de nombreux centres et chaires de recherche universitaires dont on peut consulter la liste sur son site web. Les cahiers de la série scientifique (CS) visent à rendre accessibles des résultats de recherche effectuée au CIRANO afin de susciter échanges et commentaires. Ces cahiers sont écrits dans le style des publications scientifiques. Les idées et les opinions émises sont sous l’unique responsabilité des auteurs et ne représentent pas nécessairement les positions du CIRANO ou de ses partenaires. This paper presents research carried out at CIRANO and aims at encouraging discussion and comment. The observations and viewpoints expressed are the sole responsibility of the authors. They do not necessarily represent positions of CIRANO or its partners.. ISSN 1198-8177. Partenaire financier.
(3) Are Firms That Received R&D Subsidies * More Innovative? Charles Bérubé †, Pierre Mohnen‡. Résumé / Abstract Cette étude examine l’efficacité des subventions à la recherche-développement pour les établissements canadiens qui bénéficient déjà de crédits d’impôt à la recherche. En utilisant un estimateur non-paramétrique d’appariement, nous trouvons que les établissements qui bénéficient des deux mesures de soutien à la recherche introduisent plus de nouveaux produits sur le marché que ceux qui ne bénéficient que des crédits d’impôt. Ils réussissent aussi à mettre plus de premières mondiales sur le marché et à mieux commercialiser leurs nouveaux produits. Mots clés : innovations, R-D, estimateur d’appariement, crédits d’impôt à la recherche, subventions à la recherche. This paper looks at the effectiveness of R&D grants for Canadian plants that already benefit from R&D tax credits. Using a non-parametric matching estimator, we find that firms that benefited from both policy measures introduced more new products than their counterparts that only benefited from R&D tax incentives. They also made more world-first product innovations and were more successful in commercializing their innovations. Keywords: innovations, R&D, matching estimators, R&D tax credits, R&D grants Codes JEL : C14, C25, H25, H32, O38. *. The research and analysis are based on data from Statistics Canada and the opinions expressed do not represent the views of Statistics Canada. The authors are solely responsible for the contents. The authors would like to thank Guy Sabourin, Frances Anderson and Susan Schaan from Statistics Canada for their help with the Survey of Innovation 2005. † Industrial research and analysis directorate, Industry Canada ‡ Maastricht University, UNU-MERIT and CIRANO, email: P.Mohnen@MERIT.unimaas.nl..
(4) 1. INTRODUCTION Business R&D is a key indicator of the innovation performance of a country. In many situations, without government intervention, the business sector would not invest the R&D amount that corresponds to the socially optimal level. Financial markets imperfections, informational asymmetries and positive R&D spillovers are market failures that can lead the business sector to under-invest in R&D. The inability of R&D investors to capture all the benefits of their investment are responsible for this underinvestment in R&D. Most countries have decided to correct for the presence of market failures by supporting business-funded R&D via direct grants, tax incentives or a mixture of the two approaches. There is a considerable body of international experience with all types of instruments used to support business R&D. The arguments in favor of one or the other policy measure generally are based on evidence from factual situations in a specific country or industrial context. There exist a number of studies that have formally examined the effectiveness of R&D tax incentives or direct support measures (see the surveys by David, Hall and Poole (2000) and Hall and van Reenen (2000)). A few studies on the effectiveness of R&D tax incentives have been made using Canadian data: McFetridge and Warda (1983), Mansfield and Switzer (1985), Bernstein (1986), Dagenais, Mohnen, Therrien (1997), Dahlby (2005), and Czarnitzki, Hanel and Rosa (2005). The latest Canadian studies (e.g. Dahlby, 2005; Dagenais et al., 1997) indicate that tax incentives stimulate R&D activity between $0.98 and $1.38 per dollar of foregone tax expenditure (excluding possible provincial tax incentives) and that R&D tax credits have a positive impact on the firm’s decision to conduct R&D and to increase innovation output (Czarnitzki et al. (2005)). Only one study to our knowledge (Pagé, 1995) has formally examined the effectiveness of direct government support for innovation in Canada. The debate is still going on. On the one hand, tax incentives are provided to encourage the broadest range of firms to engage in R&D. They have an administrative cost (OECD, 2002) and are neutral with respect to the choice of industry and the nature of the firm (Czarnitzki et al., 2005). On the other hand, more direct support (like grants) is provided to individual firms for promising R&D projects, and their effects can be better measured than those from fiscal indirect support (OECD, 2002). Direct support or subsidies allow government to retain control over the type of R&D and to. 1.
(5) promote mission objectives (OECD, 2002). They are neutral with respect to the business tax structure and they usually focus on projects with a higher social rate of return. We shall not draw an exhaustive list of pros and cons. In any case, a review of the existing literature suggests that it is not possible to conclude in favour of one instrument over the other, at least, not in an obvious way. We used micro data from the 2005 Canadian Innovation Survey to examine whether firms that receive R&D grants in addition to R&D tax credits perform any better in terms of various innovation output measures than firms that receive only R&D tax credits. Section 2 of the paper presents the data used and the characteristics of the survey. We split our sample into two groups: firms that claimed tax credits only and firms that claimed tax credits and received R&D grants. Section 3 reviews and discusses important aspects of the matching estimators method. In section 4 we present the characteristics of both groups before the matching process occurs. Section 5 discusses the results of the weighted logistic model that was used to compute the propensity scores. In section 6 we briefly present the characteristics of both groups, this time after the matching process has occurred. After matching, both groups have the same characteristics and the difference in output variables is then attributable to the policy incentives considered. This section also presents the results for the innovators subsample. 2. DATA 2.1 The Survey1 This study uses the 2005 Survey of Innovation from Statistics Canada1. The survey collects information on new and significantly improved products and processes introduced during the period 2002-2004. The target population includes all establishments in the manufacturing sector2 and logging2 with at least 20 employees and $250,000 in revenues. The overall response rate for the survey was 71.9%, for a total of 6,143 completed questionnaires. The sampling weights of the respondent population were adjusted for non-responses. 2.2 The sample From the 6,143 completed questionnaires, 2,200 establishments reported using R&D tax credits without receiving any R&D grants. 585 establishments reported using both types of programs, while 66 used government R&D grants without using tax credit programs, and 3,292 used neither program. Given the very small number of establishments that used only direct grants programs, we restricted our analysis to those 2,200 establishments that used tax credits only and those 585 that 1. For more details on the methodology of the survey see the Statcan website: http://www.statcan.ca/cgi-bin/imdb/p2SV.pl?Function=getSurvey&SDDS=4218&lang=en&db=IMDB& dbg=f&adm=8&dis=2. 2. North American Industry Classification System, Statistics Canada, 2002. M anufacturing (NAIC S 31-33), Logging (NAIC S 1133 ).. 2.
(6) used both programs. The 3,292 establishments that did not use any programs are out of the scope of this analysis. Our sample is a cross-section of 2,785 manufacturing3 plants that used R&D support programs sponsored by both the federal and provincial governments. We also conduct the analysis on innovators4 only, in which case our sample reduces to 2,468 establishments, of which 536 use both programs. We use normalized survey weights (Binder 1983) throughout the analysis, giving us population figures rather than sample results. The inferences using conventional software with normalized weights may be valid when the assumed model is true, but they are not robust to model misspecification (Binder and Roberts, 2006). For confidence intervals and statistical tests of significance, estimates that take into account the unequal probabilities of selection in the sample design were computed to ensure the validity of results. 3. MATCHING ESTIMATOR FRAMEWORK We want to estimate the average effect on various innovation measures of receiving an R&D grant in the presence of R&D tax credits. Therefore we distinguish two groups of firms, those claiming tax credits and receiving an R&D grant (BTG=1) and those claiming tax credits and receiving no R&D grant (BTG=0). In this paper, we will often refer to the first group as the group using two policy instruments (claiming tax credits and receiving a grant). The treatment will also refer to claiming tax credits and receiving a grant (BTG=1). Let Yi(0) be the outcome of firm i if it claims only tax credits and Yi(1) be the outcome of the same firm when it claims tax credits and receives an R&D grant. Obviously, both outcomes are not observable for the same firm. But, if they were observable, the effect of using both instruments instead of just one for a firm i that receives the treatment (i.e. that enjoys both R&D support measures) would be E[Yi(1)-Yi(0)| BTG=1]. The so called Sample Average Treatment Effect on the Treated (SATT) would be estimated by:. (1). N1 being the number of treated units.. 3. 4. Our sample also includes less than 0.2% of logging industries (NAICS 1133). Innovating firms are d efined as firms that report hav ing introduced either a new pro duct or a ne w process during the 2002-2004 time period .. 3.
(7) An issue in our case is that only one of the two outcomes is observed for a specific firm i. Unlike controlled randomized studies, ordinary observational data do not provide counterparts for the missing counterfactual. As only one outcome is observed for each firm, it is not possible to calculate directly the individual gains (or loss) from using both instruments. The problem, therefore, is a missing data problem (Heckman, Ichimura and Todd, 1997). Suppose we observe Yi(1). We could ask what would have been firm i’s output Y if it had not used both instruments? Estimating the untreated outcome Yi(0) for firm i which was exposed to the treatment (BTG=1) could be a solution. If the decision to receive the treatment (BTG=1) would have been purely random for firms having similar characteristics, then we could simply use the average outcome of similar firms which were not exposed to the treatment. This is the idea behind matching estimators. For each firm i, matching estimators associate the missing outcome by finding another firm whose covariates X are similar but who were exposed to the other treatment. Obviously two assumptions are needed to obtain consistent and valid estimation of the average treatment effect. Assumptions: (i) Unconfoundedness: BTG is independent of [Y(1),Y(0)] conditional on X=x (ii) Common support: c < Pr(BTG=1 | X=x ) < 1-c, for some c > 0 and all x in X Condition (i) states that assignment of the treatment BTG is independent of the outcomes conditional on the covariates X. Condition (ii) states that we must have an overlap between those that received the treatment and those that did not. Under these assumptions, we can then rewrite equation (1) as the mean difference of the matched samples: (2) Conditioning on X takes account of the selection bias due to observable differences between treated and non-treated firms. Heckman, Ichimura and Todd (1998) point out that for identification of equation (2), assumption (i) can be weakened to mean independence. The process of matching then consists of picking for each treated firm the most similar firm within the non-treated sample. Different types of matching estimators exist, with various properties. It is important to keep in mind that causal questions from nonrandomized studies can only adjust for observed confounding covariates and not unobserved ones. While research and refinements in econometric techniques are always evolving, this is always a limitation of nonrandomized studies relative to controlled randomized studies. The average treatment effect is traditionally measured using covariates adjustment and various matching algorithms (parametric and non parametric) to reduce the possible bias in the average treatment effect (e.g. Heckman, Ichimura and Todd, 1997; Abadie and Imbens, 2006). The 4.
(8) propensity score, defined as the conditional probability of receiving a treatment (BTG=1) versus another treatment (BTG=0) given the characteristics (covariates) X of participants, Pr(BTG=1 |X=x), was first introduced by Rosenbaum and Rubin (1983). Lechner (1998) suggested a hybrid matching, where the propensity score and a subset of X is used in the matching process. However, in some situations these methods are not adequate and may lead to inefficient estimates of the treatment effect. Abadie and Imbens (2006) have shown that using more than a single continuous covariate for matching may result in a matching discrepancy of stochastic order N-1/K (K being the number of continuous matching variables and N being the number of observations to match). When K=1, the bias term can be ignored and the matching estimator is %N-consistent. The choice of a single continuous covariate, such as the propensity score, for matching becomes critical. We use matched pairing which consists of sampling from potential firms in group BTG=0 for which the distribution of covariates X are similar to those in group BTG=1. More specifically we use the nearest neighbour Mahalanobis5 metric matching defined on the propensity score. The matching scheme is illustrated in Chart 1 and can be summarized by the following matching algorithm steps: Step1 Define a logistic model with all possible independent variables that may have affected the choice of treatment BTG and compute the propensity scores (that is the estimated probability of obtaining a tax credit and a grant). Step 2 Create two groups. One is the treated group where BTG=1 and the other is the non-treated group BTG=0 (usually the larger one) where all firms are considered a potential match. Step 3 Choose one observation to match from the group BTG=1. Firms in group BTG=0 for which propensity scores are within one quarter of a standard deviation of the chosen observation propensity score are retained as potential candidates for matching. Step 4 Three situations may happen from the previous step: (1) No candidate is located, the chosen observation won’t be matched. Go back to Step 3. (2) Only one candidate is found and the match is retained for this observation. Go back to Step 3. (3) More than one candidate is found. Use the Mahalanobis distance in Step 5 to find the best match. Step 5 Mahalanobis distances based on propensity scores and a small number of key variables are calculated between the observation to match, and the pool of potential candidates found in step 3. The firm in this pool with the smallest distance to the observation to match is selected and retained as a match.. 5. The M ahalanobis distance is a measure based on correlation between variables and can be expressed as MD (K,L)=(K-L)tO -1(K-L ) where K and L are two N-dimensional p oints from the sa me d istribution with covariance matrix O.. 5.
(9) Step 6 The matching process will repeat at Step 3 until all firms in the group BTG=1 have been matched. Matched candidates in Steps 4 or 5 from BTG=0 are never removed from the matching consideration in Step 36. Chart 1. 6. The results presented in this paper do not allow different treated firms to be matched to the same non-treated firm. T o allow ma tching with replacem ent may introduc e a bias in statistical tests. Maha lanobis distance is the criterion used to get a unique match. Remaining treated firms that were matched to the same non-treated firm after a full cycle have to be rematched until all treated firms are uniquely matched.. 6.
(10) We transformed the propensity scores and key variables selected in Step 5 into standardized variables having an identity variance-covariance matrix. The Mahalanobis distance for data points before standardization will be identical to the Euclidean distance for data points in the standardized space. Specifically, we used SAS procedure PROC PRINCOMP and PROC SCORE to obtain the principal components scores with an identity variance-covariance matrix and PROC FASTCLUS to compute Euclidean distances from the pool of potential candidates and the reference point selected in Step 3. If one had used only the propensity score in Step 5, transformations are unnecessary to obtain an identity variance-covariance matrix and the Euclidean distance applied to original data is sufficient. 4. BEFORE MATCHING 4.1 Control variables We used many observed confounding covariates to find which ones had an effect on the decision to use only R&D tax credits versus using both R&D tax credits and grants. Of course, we could only take into account variables included in the survey. Our two groups already showed more homogeneity than if we were comparing a group receiving government support to a group receiving none. Because of the homogeneous nature of our two groups, we believe that unobserved variables are also of comparable magnitude. Moreover, we consider that key variables were available in the survey to help us identify important firm characteristics in light of their decision to choose one or two instruments. Table 1 describes the relevant characteristics of the treated (BTG=1) and non-treated establishments (BTG=0) before matching. For continuous variables the p-values pertain to a t-test on mean difference. For categorical variables, the p-values are based on the Chi-Square test of independence, testing whether distributions of categorical variables differ from one another.. 7.
(11) Table 1*: Means and pro portions of relevant characteristics before matching Characteristics. Tax Credits only (N=2200). Tax cred its + R& D grants (N=585). P-Value. Lnemp. 4.3346. 4.2499. 0.0669. Mean of predicted probabilities. 0.1786. 0.2317. <0.0001. Atlantic Region. 3.63 %. 5.70 %. 0.0298. Quebec Region. 36.37 %. 42.11 %. 0.0145. Ontario Region. 43.89 %. 33.68 %. <0.0001. Western Region. 16.10 %. 18.51 %. 0.1806. Resources Ind.. 24.50 %. 23.78 %. 0.7315. Labour Ind.. 24.15 %. 27.75 %. 0.0851. Scale Ind.. 24.45 %. 19.44 %. 0.0148. Specialized Ind.. 18.69 %. 15.04 %. 0.0502. Science Ind.. 7.52 %. 13.13 %. <0.0001. Niche. 37.06 %. 44.89 %. 0.0009. New Ind. Standards. 10.63 %. 17.10 %. <0.0001. Environment. 34.10 %. 37.22 %. 0.1761. Applied for patents. 21.39 %. 31.93 %. <0.0001. Outsourcing R&D. 20.65 %. 31.26 %. <0.0001. External funding. 48.45 %. 61.46 %. <0.0001. *Statistics Canada, Survey of Innovation 200 5, authors’ calculations.. Before matching, most variables showed differences between both groups at the 1% significance level. To control for firm size, we used the number of employees specified in natural logarithms (Lnemp). As expected, due to the homogeneity of our two groups, the difference in firm size is not significant at the 5% level. The group which used tax credits and grants has about 70 employees on average while the group which used tax credits only has 76 employees on average. The literature shows that firm size is an important characteristic regarding R&D expenditures and innovation activities. However, since our two groups are already performing R&D, we did not expect firm size to have strong explanatory power. Geography was another important characteristic to consider as provincial R&D incentives differ. Any help and services offered to get an R&D grant might be different from one province to 8.
(12) another. To control for this aspect, we considered four regions in our analysis (represented as dummies in the logistic regression): Atlantic region, Quebec region, Ontario region and Western region. Table 1 shows that our two samples are not balanced with respect to geographic characteristics. As an example, firms from Quebec are significantly (at the 5% level) more represented in the group that received both tax credits and grants (BTG=1) than in the group that only claimed tax credits (BTG=0). Firms in Ontario are significantly (at 1% level) more represented in the group that claimed tax credits only (BTG=0). Sectoral patterns in the production of innovations are well known. It would not be acceptable, for example, to match a firm specialized in textile products with a firm specialized in computer equipment. We tried various taxonomies of industries including the OECD definition based on the level of technology. After a few tests, we concluded that a definition based on Pavitt (1984) taxonomy was the most appropriate. Pavitt (1984) classified sectoral patterns of innovation into three sectors. The sectors were later increased or reclassified into five sectors (see appendix 1): The supplier dominated category was broken into Resources and Labour; The production intensive was defined as Scale-intensive and Specialized suppliers; and the Science-based remained a single category. Firms in the supplier dominated category are traditionally characterized as having a low to medium-low technology orientation. Innovation therefore is dependent on external factors, such as suppliers of equipment and materials. Firms in the scale intensive sector have some in-house development capability. They interact mostly with specialized supplier firms where the level of technology is higher. In the science-based sector, the main source of innovation is in-house development. Table 1 indicates that science based firms (e.g. computer equipment manufacturing) were significantly (at 1% level) more represented in the group that received both tax credits and grants (BTG=1), while scale intensive firms (like pharmaceutical and medicine manufacturing) were significantly less represented in that group (at 5% level) . The survey asked plants to rate the importance of some success factors according to a scale (High, Medium, Low and not relevant). Factors of success can be an important aspect in a firm’s decision to undertake R&D. They can also affect firms’ decisions to claim tax credits and/or grants. For example a firm might need to comply with environmental standards which makes it a good candidate to apply for a special grant. Outcomes can also be affected by success factors. For example, firms developing new industry standards might be more innovative than others. Only three factors from all success factors were included in the logistic regression. We defined a dummy named Niche when a firm reported a high degree of importance for developing niche or specialized markets. New Ind. Standards is a dummy indicating that the firm gives a high degree of importance to active involvement in developing new industry-wide standards. And finally, the dummy Enviro is equal to one when the firm declared a high degree of importance in its ability to comply with environmental standards and regulations. The two first dummies are not “balanced” between our two groups while we cannot say that there is a significant difference between both groups concerning the Enviro dummy.. 9.
(13) We considered three other variables as determinants in how firms organize their innovation activities. Firms that applied for patents might be more organized and have more experience in filling paperwork. Claiming a tax credit is usually less constraining than applying for a grant. For the same reason, firms that outsourced R&D are more likely to be well organized. They are usually larger firms familiar with negotiating contracts and filing paperwork. External funding also seems to be a key variable when choosing governmental programs. Firms that applied for patents, outsourced R&D or received external funding are proportionally more represented in the category “tax credits and grants” than in the category “tax credits only”. More variables were considered as control variables but were not significant in the logistic regression. Some variables were highly correlated and we had to choose between them to avoid strong dependence (multicollinearity). For example, the percentage of employees working in R&D was negatively correlated with the total number of employees. When one variable was included in the regression, the other became non-significant while the other covariates remained basically the same. The percentage of employees with a university degree was positively correlated with the industry of science and the percentage of employees in R&D. We verified that the choice of one or the other variable did not change the results after the matching process. Table 1 shows that the two sub-samples, while not totally heterogeneous, are not balanced. For example, we cannot say the mean number of employees is different at the 5% level, but some geographic characteristics are very different, even at the 1% level. After the matching process, all controlling variables should no longer be statistically different. The mean of predicted probabilities of assignment to the target or the control group should also be the same between the two samples. 4.2 Outcome variables (before matching) We used three types of outcomes variables. The first type considers the nature of innovations. We want to know whether firms that used tax credits and grants instead of only tax credits were sometimes first to innovate. We created four dummies indicating the following: World First if the firm introduced a world-first innovation; North A. First for a North American first innovation; and Canadian First and Province First for Canadian and Provincial first innovations. The second type of outcome variables considered the number of new or significantly improved products. We defined two variables: New innovation > 0 and New innovation > 2. The last type of outcome variables considered the economic success of the newly introduced products. The products can be a first-to-market product or an already-on-the-market-product. Both variables % Rev. first-to-market > 0 and % Rev. already-on-market > 0 measure whether the new or significantly improved products had an important share of the firms revenues. 10.
(14) Table 2 shows that, except for the percentage of revenue from already-on-the-market product innovation, the outcome variables are different between the two groups. But these differences might simply be explained by the different characteristics of firms in the two groups and not by the public policy incentive schemes. We cannot compare directly the means or proportions of our two groups because of this potential sample selection bias. The matching process will make an adjustment to correct this potential problem. If the outcome variables differ significantly after the matching, we will be able to assign the differences to the policy incentives considered. Table 2*: Prop ortions of relevant outcome measures before matching Outcome variables. Tax Credits only (N=2200). Tax cred its + R& D grants (N=585). P-Value. Province First. 52.89%. 64.80%. <0.0001. Canad ian First. 41.41%. 53.01%. <0.0001. North A. First. 27.24%. 38.24%. <0.0001. W orld First. 13.24%. 25.26%. <0.0001. New innovation > 0. 70.11%. 80.49%. <0.0001. New innovation > 2. 52.95%. 64.75%. <0.0001. % Rev. First-to-market > 0. 48.86%. 60.84%. <0.0001. % Rev. Already-on-market > 0. 40.71%. 43.96%. 0.1727. *Statistics Canada, Survey of Innovation 200 5, authors’ calculations.. 5. MATCHING As mentioned in section 3, we defined a logistic model including all the control variables that had an effect on the decision to use tax credits and grants. The propensity scores are estimated using the results of the logistic regression presented in Table 3. For nearly all variables, the probability of using tax credits and grants relative to only tax credits is positive. This means, for example, that given all other variables, firms in Quebec, Atlantic or the Western region compared to firms in the Ontario region have more chances of claiming tax credits and receiving a grant than claiming only tax credits. Some regional aspects can explain this result. For example, there are more firms in Quebec than in Ontario offering services to help build cases in order to apply for a grant. The Ontario region was taken as the reference region. Picking another region as reference would not have changed the propensity scores.. 11.
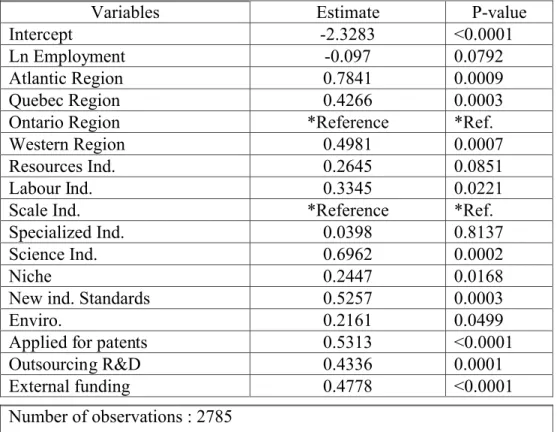
(15) It seems the size of the firm (measured by employment) is not as important as the geographic aspect for receiving tax credits only and tax credits with grants. The negative sign of the variable tends to suggest that the bigger the firm the less chance it has to apply for tax credits and grants. But, it is significant only at the10% level. The literature clearly states that the larger the firm is, the more likely it will use government support for R&D. When choosing between instruments the size of the firm doesn’t appear to matter as much. Sectoral patterns in the production of innovation are also significant, especially for sciencebased industries. Science-based industries (when compared to scale-intensive) are more likely to use tax credits and grants than tax credits only. Actually science-based industries are more likely to use tax credits and grants than any other type of industry used in our taxonomy. It then becomes very important to have balanced samples with respect to this variable. It would certainly not be desirable to match a science-based firm with another firm from a different sector. As for geographic variables, the scale-intensive variable was picked as reference. Again, this choice was arbitrary and has no influence on the propensity scores calculation. Firms developing niche or specialized markets, as well as firms developing new industrywide standards, are more likely to claim tax credits and receive grants. Firms which are highly concerned about the ability to comply with environmental standards and regulations are also more likely to use both instruments (significant at 5%). Three other characteristics are important in being classified in the group of firms that receives both tax credits and grants: applying for a patent, outsourcing R&D, or receiving external funding (excluding governmental support). These three characteristics are strongly significant (at a 1% level). Ideally, we certainly do not want to match a firm which applied for a patent with a firm that did not. In fact, we do not want this to happen on average. In other words, we do not want the matching process to give us an overrepresentation of these characteristics and introduce a bias in one of our two groups. For example, if the application for a patent is correlated with the number of innovations, a group with more firms that applied for a patent would falsely lead us to conclude that firms using tax credits and grants are more innovative.. 12.
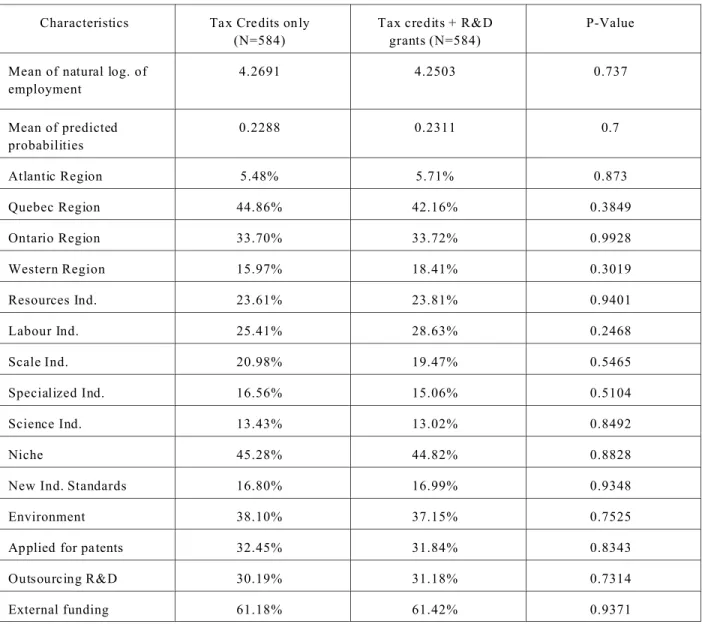
(16) Table 3: Weighted logit model on the tax credits and grants dummy. Variables Intercept Ln Employment Atlantic Region Quebec Region Ontario Region Western Region Resources Ind. Labour Ind. Scale Ind. Specialized Ind. Science Ind. Niche New ind. Standards Enviro. Applied for patents Outsourcing R&D External funding. Estimate -2.3283 -0.097 0.7841 0.4266 *Reference 0.4981 0.2645 0.3345 *Reference 0.0398 0.6962 0.2447 0.5257 0.2161 0.5313 0.4336 0.4778. P-value <0.0001 0.0792 0.0009 0.0003 *Ref. 0.0007 0.0851 0.0221 *Ref. 0.8137 0.0002 0.0168 0.0003 0.0499 <0.0001 0.0001 <0.0001. Number of observations : 2785 Likelihood Ratio test: P2=140.1629 Pr > ChiSq <0.0001 *Statistics Canada, Survey of Innovation 200 5, authors’ calculations.. 6. AFTER MATCHING 6.1 Control variables Table 4 describes the matched samples and shows the relevant characteristics of the treated (BTG=1) and non-treated (BTG=0). Using the algorithm described in section 3, we succeeded in matching 584 firms out of 585. The variables used for matching were the propensity score, Quebec region, Ontario region, Science-based and Scale-intensive industries, as well as outsourced R&D. The difference between the matched pairs is evaluated using a t-test for the continuous variable and a Chi-square for the categorical variables. The mean of predicted probabilities and all control variables after matching showed no significant differences between the two groups. This shows that the two matched groups are well balanced. Because of this, the differences in outcome variables are not the result of differences in firm characteristics between the two groups.. 13.
(17) Table 4*: M ean and propo rtions of relevant characteristics after matching Characteristics. Tax Credits only (N=584). Tax credits + R&D grants (N=584). P-Value. Mean of natural log. of employment. 4.2691. 4.2503. 0.737. Mean of predicted probabilities. 0.2288. 0.2311. 0.7. Atlantic Region. 5.48%. 5.71%. 0.873. Quebec Region. 44.86%. 42.16%. 0.3849. Ontario Region. 33.70%. 33.72%. 0.9928. Western Region. 15.97%. 18.41%. 0.3019. Resources Ind.. 23.61%. 23.81%. 0.9401. Labour Ind.. 25.41%. 28.63%. 0.2468. Scale Ind.. 20.98%. 19.47%. 0.5465. Specialized Ind.. 16.56%. 15.06%. 0.5104. Science Ind.. 13.43%. 13.02%. 0.8492. Niche. 45.28%. 44.82%. 0.8828. New Ind. Standards. 16.80%. 16.99%. 0.9348. Environment. 38.10%. 37.15%. 0.7525. Applied for patents. 32.45%. 31.84%. 0.8343. Outsourcing R&D. 30.19%. 31.18%. 0.7314. External funding. 61.18%. 61.42%. 0.9371. *Statistics Canada, Survey of Innovation 200 5, authors’ calculations.. 6.2 Outcome variables (after matching) Table 5 can be used to estimate the effect of using tax credits and grants instead of tax credits only on the outcome variables. The differences between our two groups can now be interpreted as the result of receiving the treatment and not as differences in firms characteristics. As in Table 2 (before matching), outcome variables are almost all significantly different between our two groups. As expected once the two groups are balanced in firm characteristics, the differences in outcome variables are not as large.. 14.
(18) Table 5*: Prop ortions of relevant outcome measures after matching Outcome variables. Tax Credits only (N=584). Tax credits + R&D grants (N=584). P-Value. Province first. 58.84%. 64.75%. 0.0819. Canad ian first. 47.84%. 52.96%. 0.1068. North A. First. 31.4%. 38.17%. 0.0598. W orld first. 17.24%. 25.29%. 0.0046. New innovation > 0. 71.80%. 80.47%. 0.0011. New innovation > 2. 50.86%. 64.70%. <0.0001. % Rev. First-to-market > 0. 52.49%. 60.79%. 0.0074. % Rev. Already-on-market > 0. 40.13%. 44.02%. 0.2086. *Statistics Canada, Survey of Innovation 200 5, authors’ calculations.. In the first type of outcome variable, considering the nature of innovations, firms that used tax credits and grants instead of just tax credits are clearly favoured. At the 1% level significance level, 25.29% of the firms which used both instruments made a world first innovation during the three years considered, against only 17.24% among those that used tax credits only. This is a very important result as we know that world first innovations have more chances to enjoy commercial success. The impact on the Canadian economy is therefore usually much larger. North-American and province first innovations also were more frequent among firms that used both instruments: 38.17% of firms using both instruments made North American first innovations against only 31.4% among firms using tax credits only. For province-first innovations, the proportions are 64.75% compared to 58.84% for firms that used tax credits only. These difference are significant at the 10% level. At the same level of significance, we cannot conclude that Canadian-first innovations are performed in a larger proportion for firms using both instruments. The second type of outcome variables, which measure the number of new or significantly improved products, are even more conclusive. 80.47% of the firms that used both instruments made at least one innovation during the period considered, while 71.8% did so among the firms that used tax credits only. The difference between the two groups is even larger when we consider firms that made three innovations or more (New innovation >2). 64.7% of the firms that used both instruments made three innovations or more and only 50.86%within the other group. We looked at firms producing even more innovations and every time firms that used both instruments performed better than firms that used tax credits only. Of course, we have no information on the economic value nor on the returns to establishments from these innovations. But we have no reason to believe that, on average, they are different between groups.. 15.
(19) The economic success of newly introduced products, measured by the percentage of revenue from first-to-market or already-on-market innovations, provided the expected results. A firm which develops a first-to-market innovation generally has an economic advantage over a firm that develops an already-on-market innovation. Usually a higher percentage of a firm’s revenue coming from firstto-market products gives an indication of higher success in commercializing the innovation product. 60.79% of firms that claimed tax credits and received grants reported to have at least some commercial success (i.e. more than 0% as a share of revenues). Only 52.49% of the firms that claimed only tax credits reported the same. We still get similar results if we look at firms that reported to have some percentage of their revenue coming from first-to-market innovation. For example, 52.8% of the firms using both instruments, compared to 38.8% of the firms using tax credits only, declared a percentage of revenue above 3% due to first-to-market innovations. An interesting result also comes from the fact that the percentage of sales from already-onthe-market products are not significantly different between our two groups. Using tax credits and grants instead of tax credits only seems to make a significant difference when commercializing innovation in immature markets, but it does not seem to make a significant difference in established markets. 6.3 Innovators’ subsample We also conducted the analysis on innovators only. This reduced our sample to 2,468 establishments of which 536 used both instruments. Using the same algorithm as for the full sample, we succeeded in matching 533 firms out of 536. Because we had no reason to believe that the control variables should have been exactly the same as in the full sample, we tried for various control variables again. After several experiments with different covariates, we concluded that the innovators subsample shared very similar characteristics with the full sample. The computation of the propensity score was then done with the same controlling variables as in the full sample. We do not present the logistic regression results for the subsample, as they are very similar to Table 37. As in the full sample, the controlling variables are different between our two groups before matching and not different after matching. Table 6 shows the effect of using tax credits and grants instead of just tax credits on the outcome variables for the innovators subsample. As in Table 5, the differences between our two groups can be interpreted as the result of using two instruments instead of one and not as differences in firms characteristics.. 7. The results can be obtained fro m the authors upo n request.. 16.
(20) Table 6*: Prop ortions of relevant outcome measures after matching (innovators subsample) Outcome variables. Tax Credits only (N=533). Tax credits + R&D grants (N=533). P-Value. Province First. 63.00%. 69.95%. 0.0618. Canad ian First. 48.81%. 57.14%. 0.0162. North A. First. 34.30%. 41.35%. 0.0638. W orld First. 17.10%. 27.36%. 0.0007. New innovation > 0. 75.98%. 87.03%. <0.0001. New innovation > 2. 57.90%. 69.90%. 0.0001. % Rev. First-to-market > 0. 52.4%. 65.65%. <0.0001. % Rev. Already-on-market > 0. 46.42%. 47.43%. 0.7548. *Statistics Canada, Survey of Innovation 200 5, authors’ calculations.. The results for innovators are similar to the full sample results except for firms which declared their innovation a first in Canada. The difference between firms using both instruments and firms using tax credits only was not significant when considering “Canadian-first” innovation. For the innovators, at a 5% level of significance, 57.14% of firms that used tax credits and grants declared a “Canadian-first” innovation against 48.81% of firms that used tax credits only. For most other outcome variables, the differences between our two groups are even wider than in the full sample. There are two exceptions though. First, the difference between our two groups for firms that had made at least 3 innovations ( New innovation > 2) is not as large for the innovators subsample. The difference between our two groups for the full sample was 13.84 percentage points while it was 12 percentage points for the innovators’ subsample. The difference is still large and significant enough (1% level) to conclude that firms using tax credits and grants performed better than firms using tax credits only. We also tested for firms producing even more innovations. In each case, firms that used both instruments performed better than firms that used tax credits only. For example, 38.85% of the firms that used tax credits and grants made at least 7 innovations while only 32.46% did the same in the other group. The difference is significant at the 5% level. Second, the difference between our two groups for the percentage of revenue from alreadyon-the market innovations, is greatly reduced. The difference was already not significant in the full sample, but it is even less so in the innovators’ subsample. This means that R&D grants make no difference for innovators when it comes to commercialize their innovation in mature markets. It is clearly not the case in immature markets. 22.28% of the firms that claimed tax credits and received grants declared that at least 20% of their revenues came from first-to-market innovations. Only 17.
(21) 17.05% of firms that claimed tax credits only declared the same. Table 6 shows that there is also a smaller proportion (52.4%) among the firms that claimed tax credits only which declared a positive share of revenues from first-to-market innovation. 7. CONCLUSION This paper looked at the effectiveness of R&D grants by comparing innovation performance measures for firms that received R&D tax credits only and firms that received both R&D tax credits and R&D grants. To our knowledge, this is the first Canadian study using micro data to measure the effectiveness of direct grants on innovation and correcting for the endogeneity of policy treatment. We find that using tax credits and grants is more effective than using tax credits only. In other words, firms that benefitted from both policy measures were significantly more innovative than their counterparts that only benefitted from R&D tax incentives. Firms that received R&D grants in addition to enjoying R&D tax credits not only introduced more innovations but made more world-first innovations and were more successful in commercializing their innovations. The R&D grants program stimulates in particular world-first innovations and not so much products already known in Canada. World-first innovations are more likely to produce externalities and therefore we can claim that the R&D grants program stimulates innovation precisely in areas where the market failure is highest. We obtained very similar results when we considered innovators only. We again found that firms that received both R&D tax credits and R&D grants had more innovations, more “world-first” innovations, and a greater share of having their revenue come from first-to-market innovations than firms that received only R&D tax credits. Unfortunately the amount (level) of governmental support for both tax credit and grant programs were not available in the survey. Because of this lack of information, this study cannot shed light on the efficiency of tax credit versus direct grants. Future research could make sure that the same amount of support is available to both groups. Another aspect concerns the value of innovations for which no data exist. It is possible that grant programs have more impact on the value of innovation because of its inherent capacity to choose promising project.. 18.
(22) Appendix 1: Sectoral Pattern Taxonomy. Pavitt Taxonomy. Resource-intensive. Labour-intensive. Scale-intensive. Science-Based Specialized. NAICS Code. Description. 311. Food M anufacturing. 312. Beverage and T obacco P roduct Manufacturing. 321. W ood P roduct Manufacturing. 322. Paper M anufacturing. 324. Petroleum and Co al Product M anufacturing. 327. Non-M etallic Mineral Produc t Manufacturing. 313. Textile M ills. 314. Textile Product M ills. 315. Clothing Manufacturing. 316. Leather and Allied Product Ma nufacturing. 332. Fabricated Me tal Product Manufacturing. 337. Furniture and Related Product Manufacturing. 339. Miscellaneous Manufacturing. 323. Printing and Related Support Activities. 325. Chemical Ma nufacturing. 331. Primary Metal M anufacturing. 3361. Mo tor Vehicle Manufacturing. 3362. Mo tor Vehicle Body and T railer Manufacturing. 3363. Mo tor Vehicle Parts Manufacturing. 3365. Railroad Rolling Stock Manufacturing. 3366. Ship and Bo at Building. 3369. Other Transpo rtation Equipm ent Manufacturing. 334. Comp uter and Electronic Product Manufacturing. 3364. Aerospace P roduct and Parts Ma nufacturing. 333. Mac hinery Manufacturing. 335. Electrical Equipment, Appliance and Compo nent Manufacturing. 19.
(23) REFERENCES Abadie, A., Imbens, G. (2006), “Large sample properties of matching estimators for average treatment effects”, Econometrica, 74(1), 235-267. Bernstein, Jeffrey I. (1986), "The Effect of Direct and Indirect Tax Incentives on Canadian Industrial R&D Expenditures", Canadian Public Policy, 12(3), 438-448. Binder, David A. (1983), “On the variances of asymptotically normal estimators from complex surveys”, International Statistical Review, 51, pp. 279- 292. Binder, David A., Roberts, Georgia R. (2006), “Statistical inference in survey data analysis: where does the sample design fit in?”, Data Analysis Resource Center, University of Western Ontario Research Data Center. Czarnitzki, D., Hanel, P. and Rosa, J.M. (2005), “Evaluating the impact of R&D Tax credits on Innovation: A Microeconometric study on Canadian Firms”, CIRST – Note de recherche 200502. Dagenais, M., Mohnen,P., Therrien,P., “Les firmes canadiennes répondent-elles aux incitations fiscales à la recherche-développement?”, Actualité Économique, 80(2/3), 175-206, 2004 Dahlby, B., (2005), “A Framework for Evaluating Provincial R&D Tax Subsidies”, Canadian Public policy, Vol. 31, No.1, pp. 45-58. David, P., B. Hall, and A. Toole (2000), “Is public R&D a complement or a substitute for private R&D? A review of the econometric evidence”, Research Policy, 29, 497-520. Hall, B., Van Reenen, J. (2000), “How effective are fiscal incentives for R&D? A review of the evidence”, Research Policy, Vol. 29, pp. 449-469. Heckman, J., Ichimura, H. and Todd, P. (1997), “Matching as an Econometric Evaluation Estimator: Evidence from Evaluating a Job Training Program”, Review of Economic Studies, Vol. 64, No. 4, pp. 605-654.. 20.
(24) Heckman, J., Ichimura, H. and Todd, P. (1998), “Matching as an Econometric Evaluation Estimator”, Review of Economic Studies, Vol. 65, No. 2, pp. 261–294. Lechner, M. (1998), “Training the East German Labour Force. Microeconometric Evaluations of Continuous Vocational Training after Unification. Studies in Contemporary Economics”, Heidelberg : Springer/Physica, ISBN 3-7908-1091-6. Mansfield, Edwin and Lorne Switzer (1985), "The Effects of R&D Tax Credits and Allowances in Canada", Research Policy, 14, 97-107. McFetridge, D.G. and J.P. Warda (1983), Canadian R&D Incentives: Their Adequacy and Impact. Canadian Tax Paper no. 70, Toronto: Canadian Tax Foundation. OECD (2002), STI Report: tax incentives for research and development - trends and issues, Paris. Pagé, L. (1995), L'incidence des subventions sur les dépenses privées en recherche et développement: une approche microéconomique. Mémoire de maîtrise, Université de Sherbrooke. Rosenbaum, P., and Rubin, D. (1983), “The Central Role of the Propensity Score in Observational Studies for Causal Effects”, Biometrika, Vol. 70, No. 1, pp. 41-55.. 21.
(25)
Figure

Documents relatifs
The RSPCA :Royal Society for the Prevention of Cruelty to Animals; was the first organisation dedicated to the well-(done /exists / being )of animals.. anywhere in
The vector Boolean functions are used in cryptography to construct block ciphers and an important criterion on these functions is high resistance to differential cryptanalysis.. Let q
Rodier, A Few More Functions That Are Not APN Infinitely Often, Finite Fields: Theory and applications, Ninth International conference Finite Fields and Applications, McGuire et
Ultimately, the switch in the relative stability of the sodium and potassium structures of the (GGGTTA) 7 GGG sequence results from the interplay between ‘G4 cation-
Nachr. Mertens, Ueber einige asymptotische Gesetze der Zahlentheorie, J. Montgomery, Fluctuations in the mean of Euler’s phi function, Proc. Titchmarsh, The theory of the
To install voice communication on modem A, take the end of the telephone line that you disconnected from the wall jack in step 1 and connect it to the second jack
• If you need the ability to halt the system from the console terminal, for example, when installing system software or performing certain types of backup, set
In this paper, we describe Dickson polynomials of the first kind in F 2 [x] that are involutions over finite fields of characteristic 2.. Such description is obtained using
