NBER WORKING PAPER SERIES
DISABILITY, PENSION REFORM AND EARLY RETIREMENT IN GERMANY
Axel H. Boersch-Supan
Hendrik Juerges
Working Paper 17079
http://www.nber.org/papers/w17079
NATIONAL BUREAU OF ECONOMIC RESEARCH
1050 Massachusetts Avenue
Cambridge, MA 02138
May 2011
The views expressed herein are those of the authors and do not necessarily reflect the views of the
National Bureau of Economic Research.
© 2011 by Axel H. Boersch-Supan and Hendrik Juerges. All rights reserved. Short sections of text,
not to exceed two paragraphs, may be quoted without explicit permission provided that full credit,
including © notice, is given to the source.
Disability, Pension Reform and Early Retirement in Germany
Axel H. Boersch-Supan and Hendrik Juerges
NBER Working Paper No. 17079
May 2011
JEL No. H55,J14
ABSTRACT
The aim of this paper is to describe for (West) Germany the historical relationship between health
and disability on the one hand and old-age labor force participation or early retirement on the other
hand. We explore how both are linked with various pension reforms. To put the historical developments
into context, the paper first describes the most salient features and reforms of the pension system since
the 1960s. Then we show how mortality, health and labor force participation of the elderly have changed
since the 1970. While mortality (as our main measure of health) has continuously decreased and population
health improved, labor force participation has also decreased, which is counterintuitive. We then look
at a number of specific pension reforms in the 1970s and 1980s and show that increasing or decreasing
the generosity of the pension system has had the expected large effects on old-age labor force participation.
Finally, we explore the possible link between early childhood environment and early retirement by
analyzing the retirement behavior of cohorts born during World War I, a period of harsh living conditions
among the civilian population in Germany. Our data show higher early retirement rates among those
cohorts, presumably because those cohorts still suffer from worse health on average many decades
after their birth.
Axel H. Boersch-Supan
Mannheim Research Institute for the
Economics of Aging
University of Mannheim
Building L13, 17
D-68131 Mannheim
GERMANY
and NBER
axel@boersch-supan.de
Hendrik Juerges
Schumpeter School of Business and Economics
University of Wuppertal
Rainer-Gruenter-Str. 21 [FN.01]
42119 Wuppertal
GERMANY
Disability, Pension Reform and Early Retirement in Germany
Axel Börsch-Supan and Hendrik Jürges1. Introduction
Disability insurance – the insurance against the loss of the ability to work – is a substantial part of social security expenditures and an important part of the welfare state regime in all developed countries (Aarts et al. 1996). Like almost all elements of modern social security systems, disability insurance faces a trade-off. On the one hand, disability insurance protects unhealthy people who are not able to work from falling into poverty before they are eligible for normal retirement benefits. On the other hand, however, disability insurance creates incentives to exit the labour force early and may act as another pathway to early retirement without the incidence of a major health loss.
The recipiency rates of disability insurance (DI) benefits vary strikingly across European countries, see Börsch-Supan and Roth (2010). Germany is in between countries of very high recipiency rates such as Sweden, Denmark and the Netherlands (more than 12%), but with 6.5% of all 50 to 64 year old persons substantially higher than in France (less than 2%). Three candidate causes of this international variation come to mind: cross-national differences in the age structure, cross-national differences in health, and cross-national differences in the early retirement incentives created by the DI system. Based on the 2004 waves of SHARE, ELSA and HRS, we showed that cross-sectional differences in demographic structure and current health status cannot explain the cross-national differences in DI recipiency (Börsch-Supan, 2005) although health explains a great deal of the within-country variation (see also Avendano and Mackenbach, 2010). Using the same data, we showed that adverse health events in a two-year observation window do not significantly trigger a higher probability of becoming a DI benefit recipient at the end of this window (Börsch-Supan, 2008). Finally, we exploited data on childhood and mid-life health only to find that also these health measures, while capturing a large share of the within-country variation, do not explain the cross-national differences in DI recipiency (Börsch-Supan and Roth, 2010).
The current paper concentrates on time series variation in health and DI uptake or early retirement in Germany. It follows the structure of the other papers in this volume and has two aims:
To provide historical information on mortality and “health” status measures in each country.
To understand the relationship between changes over time in disability program reforms particular—as well as other social security programs—on the one hand and DI program participation on the other hand.
Section 2 describes the most relevant features of the German pension system and which reforms the system has undergone since the 1970s. Section 3 shows long-term trends in mortality, primary diagnoses for DI benefit recipients, and subjective health measures together with long-term trends in labor force participation. In Section 4 we analyze how selected reforms of the pension system, in particular introductions of or changes in the generosity of various early retirement options, have affected the retirement behavior in Germany. Section 5 tracks early retirement behavior by birth cohorts and shows that cohorts born during World War I have retired early than cohorts born before or after the war. Section 6 concludes the paper.
2. Regimes of retirement policies in Germany
The German pension system began as a funded disability insurance scheme some 120 years ago, but was quickly broadened into a general old-age pension system and was transformed into a pay-as-you-go system in 1957 after about half of the capital stock was lost in two world wars and a hyperinflation.
As opposed to other countries such as the United Kingdom and the Netherlands, which originally adopted a Beveridgian social security system that provided only a base pension, public pensions in Germany are designed to extend the standard of living that was achieved during work life also to the time after retirement: Individual pension benefits are therefore proportional to individual labor income averaged over the entire course of the working life and feature only few redistributive properties, in particular a minimum pension at the social assistance level. Benefits in the disability branch are identical to benefits for old-age pensions. They are, however, calculated as if the working life had extended to the early retirement age. Subsection 2.1 adds further details to this bird’s eye view of the German pension system, and subsection 2.2 describes the changes in legislation that will be used to identify the incentives generated by the system.
2.1 Pathways to retirement in Germany
From the very beginning, the German system has distinguished “old-age pensions” from “disability pensions”. Old age pensions have an earliest retirement age as fundamental
eligibility criterion, independent of the ability to work, while disability pensions require an assessment of the inability to do work, independent of age.
In practice, the difference is less clear cut. Disability pensions require a work history of at least 5 years of contribution, of which 3 years have to be during the last 5 years. The assessment of the inability to work is typically record-based, i.e., there will be no specific medical exam but a submission of medical records by a general practitioner or a company doctor, potentially but rarely audited by a government official.
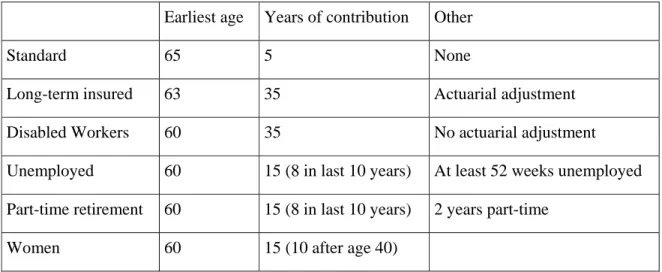
Old age pensions have various pathways, summarized in Table 1, including an “old-age disability pension” characterized but a much more lenient medical check.
Table 1: Pathways to old-age pensions
Earliest age Years of contribution Other
Standard 65 5 None
Long-term insured 63 35 Actuarial adjustment
Disabled Workers 60 35 No actuarial adjustment
Unemployed 60 15 (8 in last 10 years) At least 52 weeks unemployed Part-time retirement 60 15 (8 in last 10 years) 2 years part-time
Women 60 15 (10 after age 40)
In addition, there are several pre-retirement options, such as the “unemployment channel” where a workers first receives unemployment benefits (possibly augmented by a severance payment by his former employer) until age 59, then switches to an old-age pension for the unemployed which is converted to a standard pension after age 65. In the sequel of the paper, we will refer to “retirement” in a strict sense as receiving an old-age or disability pension, and not in the sense of exiting the labor force, e.g. via the unemployment channel.
While, in principle, all old-age and disability pathways to retirement generate the same retirement income, the pathways differ by the eligibility age and the various extra requirements indicated in table 1. Moreover, disability pensions are attractive because they feature an upper limit of actuarial adjustments. These are 3.6% per year, but are limited to 10.8% in case of a disability.
The choice among these pathways thus has three components which are well-defined and straightforward to model (earliest retirement age, minimum employment requirement, and actuarial adjustment) plus “soft” factors such as the lenience of the medical exam and a possible deal between employer and employee regarding severance pay and a recommendation by the company doctor which are hard to detect in the usual data sources.
2.2 Regimes of retirement policies in Germany
The system has experienced many changes, and the pathways in Table 1 refer essentially to the time between 1972 and 2002, during which most of our analysis takes place. There were, however, several important changes which we will exploit to identify the incentives exerted by the German pension system. It should be noted that the multitude of pathways is currently being simplified while the standard retirement age is increased to age 67.
The following brief history of the German pension system distinguishes five phases:1 (1) a relatively stable phase after the introduction of the pay-as-you-go system until 1972; (2) a phase of increasing generosity precipitated by the 1972 pension reform; (3) a phase of modest retrenchment, especially affecting disability benefits in the mid 1980s; (4) a phase of cost cutting reforms after 1992 leading to a sustainable pension system by 2007; and (5) first signs that we may actually experience a phase of reform backlash.
Phase 1 (1957 to 1972): Stability. Initially, the pay-as-you-go system introduced in 1957 had
a single eligibility age for old age pension: age 65 for men and age 60 for women (conditioned on a minimum number of years of service). Earlier retirement was impossible unless one could prove a disability. Disability rates were very high after World War II and then declined. As Figure 1 shows, disability insurance was the main entry path into the German pension system until 1972 for both men and women.
--- about here Figure 1 (Pathways to retirement) ---
Phase 2 (1972 to 1984): Increasing generosity. The 1972 reform was a major change in
policy. It introduced “flexible retirement for the long-term insured” by providing old age pension benefits at age 63, given that workers had a minimum of 35 years in which they
1
contributed to the system. These benefits were not actuarially adjusted. Average retirement age dropped by more than 2 years (Börsch-Supan, 2000), and the “flexible retirement” pathway partly substituted for the disability pathway into retirement, see Figure 1.
At the same time, the “old-age pension for disabled workers” was introduced, first with a earliest entry age of 62, then, after 1978, in two steps to age 60.
Between 1984 and 1987, early retirement was further extended by creating a “bridge to retirement”. The government introduced more generous unemployment insurance benefits for older workers which were especially attractive in the age rage from 55 to 59 years: up to 32 months of unemployment insurance benefits at 63 or 68 percent of former net wages. These benefits were neither means tested nor were job-search activities required for those unemployed who were aged 55 and older. In addition, severance pay became tax advantaged for the employers. As a result of the “bridge to retirement”, the pathways to retirement changed again: registered unemployment of elderly (age 55-59) rose – particularly dramatically between 1991 and 1996 – and the uptake of disability benefits declined (see Figure 1).
Phase 3 (1984 to 1992): Modest Retrenchment. In 1984, the balance between old-age and
disability pensions was changed by reducing the eligibility requirement for old-age pensions (at regular retirement age 65) from 15 to 5 contribution years. At the same time, restrictions on the eligibility for disability pension were strengthened. This included the introduction of a minimum of three contribution years in last five years and stricter medical examinations.
Phase 4 (1992 to 2007): Sustainability reforms. Threatened by demographic change,
Germany began in the early 1990s a 15-year lasting process of reform steps. These reform steps were not master-minded; some “happened” due to budget crises and new political constellations. Seen from hindsight, however, the reform steps follow an astoundingly consistent red threat.
Step 1: Towards actuarial adjustments (1992). The first step in the long German reform
process was the 1992 reform. It anchored benefits to net rather than to gross wages. This removed an odd mechanism that would have created a vicious cycle of increasing pension benefits in response to increasing contribution rates. At the same time, credits for higher education were abolished and survivor benefits reduced.
The second important element in the 1992 reform was the introduction of “actuarial” adjustments to benefits to retirement age. Actuarial is set in quotes because the adjustments factors have been set discretionarily at 3.6% for each year of earlier retirement and are not directly linked to changes in life expectancy. They are about 1.5 percentage points lower than current life tables and a 3 percent discount rate would imply.2 Nevertheless, their gradual introduction between 1998 and 2006 reduced incentives to retire early, and retirement age and labor force participation of older individuals has indeed increased since then, almost symmetrically to the decline after the 1972 reform (see Börsch-Supan, 1992, for an early prediction of this effect).
Step 2: Towards a genuine multi-pillar system (2001). The financial situation of the pension
system worsened rather quickly after the 1998 elections that brought the Social Democrats to power in Germany. As a remarkable irony in politics, the former union leader then secretary of labor Walter Riester successfully passed a major reform bill through parliament in 2001.3 The Riester reform is a major change of the German public pension system. It changed the monolithic pay-as-you-go retirement insurance to a genuine multi-pillar system by partially substituting pay-as-you-go financed pensions with funded pensions. The reform aimed to achieve three main objectives. First, the reform was to stabilize contribution rates. The Riester reform law actually states that contribution rates to the public retirement insurance scheme must stay below 20 percent until 2020 and below 22 percent until 2030 while the net replacement rate must stay above 67 percent. Failure must precipitate further government action. Second, a new pillar of supplementary funded pensions was introduced. Contributions to this pillar are subsidized, either by tax deferral and tax deduction, or by direct subsidies. These supplementary pensions are, however, not mandatory. Third, benefits of the pay-as-you-go system were scheduled to be gradually reduced in proportion to the maximum subsidized contribution to the new supplementary pensions.
Step 3: Towards sustainability (2004). Although praised as a “century reform”, it quickly
became obvious that the cost-cutting measures of the Riester reform would not suffice to meet the contribution rate targets. A new reform commission, the “Commission for Sustainability
2
Actuarial computations depend on a discount or interest rate which makes payments made or received at different points in time commensurable. Usually, a rate of 3 percent is assumed, sometimes 4 or 5 percent. The German computations rest on a discount rate of about 1 percent.
3
in Financing the German Social Insurance Systems”, was established in November 2002.4 Its twin objectives were those of the Riester reform: to stabilize contribution rates while at the same time ensuring appropriate future benefit levels.
The Commission met in 2003 very different circumstances than Riester faced just a few years earlier. Unexpectedly high unemployment rates and the poor performance of the German economy with extremely low growth rates precipitated a short-run financial crisis of the pension system and created a sense of urgency for reform. Moreover, the electorate became increasingly aware that stabilizing social security contributions and thus limiting the increase of total labor compensation will be essential for enhancing future growth. This paradigm shift away from thinking in pension claims toward thinking in financing possibilities had a noticeable impact on the Commission’s reform proposals.
The Commission proposed an entire reform package (Kommission, 2003). In addition to a gradual shift of the retirement age in proportion to the expected change of life length after retirement, the key element of the Commission’s reform proposal was a new pension benefit indexation formula linking benefits to the system dependency ratio, called “sustainability formula”.5 It will lead to further decreases in pension benefits vis-à-vis the path planned by the Riester reform. Most of the Commission proposals, and most significantly the introduction of the sustainability formula, were quickly passed by the German parliament in May 2004. In parallel, the government also passed major changes in the unemployment insurance system, called “Hartz reforms”.6 They dramatically shortened the duration of unemployment benefits, especially for older individuals, to 18 months (rather than 32 months) and made unemployment insurance much less attractive as a substitute for early retirement and disability insurance benefits. This was accompanied by shifting the age limit for “old-age pensions due to unemployment” to age 63.
Step 4: Towards later retirement ages (2007). The Commission also proposed an increase of
the normal retirement age from 65 to 67 years according to a schedule from 2011 to 2035 reflecting expected future changes in life expectancy. The underlying rationale was to divide the life time gained in proportion to the current division between life time in work and in retirement, namely two-to-one. In order to prevent substitution into early retirement and
4
Popularly referred to as the Rürup commission after its chairman, Bert Rürup. The Commission was in charge of making reform proposals for the pension system, health care, and long-term care insurance. We only refer to the proposals of the pension group which was co-chaired by one of the authors of this paper.
5
Technical details are described in Börsch-Supan and Wilke (2006).
6
disability pensions as a result of the increase in the retirement age, the Commission also proposed to increase the early retirement ages (to the same extent and on the same schedule as the normal retirement age) and to increase the actuarial adjustments for disabled and long-term insured workers.
The shift in the retirement age was deemed politically too dangerous and was excluded from the legislation package in March 2004. The unions heavily opposed this adaptation of retirement age to life expectancy, using the argument that it would lead to higher unemployment and take jobs away from the young.
Nevertheless, in yet another ironic move, just two years later, with population aging high on the political agenda, the then labor secretary Müntefering unilaterally announced an accelerated increase of the retirement age, being fully effective in 2029. It was legislated in March 2007. The age limit for “old-age pensions for disabled” was shifted to 65 years, and the “old-pension for women” effectively phased out.
Phase 5: Reform backlash? The increase of the retirement age irated the left wing and was
watered down by exemptions for those workers who have 45 years of service. This may be the begin of a period of reform backlash. Under increasing pressure from the newly founded “Left Party”, the grand coalition government reverted the decision to shorten the duration of unemployment insurance benefits for older workers which was part of the “Hartz-IV” labor market reform. Moreover, the government decided in the spring of 2008 to make a two-year exemption from the sustainability formula to increase pension benefits in 2008 and 2009 when Federal elections will be held. Finally, the issue of “blockwise partial retirement” – essentially an early retirement device – is back on the agenda. It is too early to judge whether these changes will end the phase of sustainability reform and begin a phase of reform roll-backs.
3. Trends in Mortality, Health, DI uptake and labor force participation
We start the empirical analysis of the relationship between health, DI uptake and labor force participation by showing long-term trends in mortality, other measures of health, and labor force participation at older ages in Germany, from the 1960s to today. We first document the substantial increases in life expectancy in the last 50 years. Then we relate those increases (as proxies for improvements in general health and – by extension – ability to work) to patterns of labor force participation. All numbers refer to West Germany only, unless stated otherwise.
3.1 Trends in Mortality
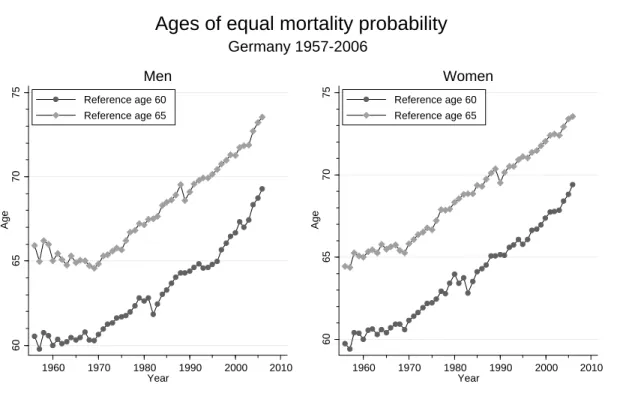
In this section we describe secular changes in mortality in Germany in the last four decades. All mortality data used in this study were drawn from the Human Mortality Database (www.mortality.org). Figure 3.1 shows trends in ages of equal mortality rates from 1957 to 2006. References are given by one year mortality probabilities of 60 and 65 year olds in 1960. Thus 60 (65) year olds have the mortality of 60 (65) year olds in 1960 by definition. Positive trends in age of equal mortality rates mean that individuals become older and older when they reach the mortality probability of a 60 (65) year old in 1960. Presumably, mortality probabilities are a good proxy for current health, thus rising trends in ages of equal mortality probability indicate improvements in population health over time.
--- about here Figure 2 (ages of equal mortality) ---
Figure 2 reveals a number of remarkable facts about mortality in Germany. First, mortality decreases (health improves) substantially between the 1960s and the 2000s. In 2006, a 73 year old man or woman had the same probability of dying within the next year as a 65 year old in 1960. Second, relatively speaking, men and women have fared equally well. Compared to 1960 mortality levels, neither sex has experienced a larger increase than the other. The time pattern, however, differs somewhat. Until 1970, men experienced hardly any improvement in mortality. 60 and 65 year olds in 1970 had practically the same mortality probabilities as 60 and 65 year olds in the late 1950s. For women, we observe an increase of approximately 1.5 years. For both sexes, improvements in health/mortality have gained considerable momentum in 1970, after which we observe a nearly linear increase in ages of equal mortality. Finally, most observers will notice seemingly erratic fluctuations around the linear trend in the early 1980s (for reference age 60) and the late 1980s (for reference age 65). These fluctuations reflect changing mortality patterns among cohorts born during and after World War I. We will come back to the possible long-term effects of birth during times of war and hunger on health and disability uptake in Section 5.
In addition to just showing the improvement in longevity in the last 50 years, Figure 2 can also be used for a simple thought experiment to put current discussions about raising the mandatory retirement age to 67 in perspective. Let us imagine that – in order to create a sustainable pension system – the German government had decided in 1960 to link the future mandatory retirement age to the mortality risk at age 65 for men and 60 for women (the
mandatory retirement age in the baseline year). The rationale would be to link the retirement age not to chronological age but to "functional age", average health or life expectancy. Figure 2 shows how the mandatory retirement age would have increased in the last five decades. In 2006, men would have had to work until they were 73 years and 6 months old. Women would have had to work until they were 69 years and 4 months old.
--- about here Figure 3 (one-year mortality rates 1960 and 2005) ---
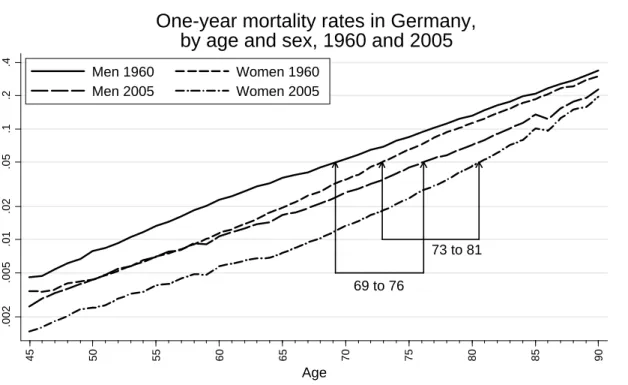
Figure 3 gives a different representation of the gains in longevity. It shows one-year mortality rates by age for men and women in 1960 and 2005. Note that mortality rates are depicted on a logarithmic scale. The nearly linear increase in log mortality rates between age 45 and age 90 thus reflects an exponential increase in mortality rates by age. Mortality rates of men are higher at all ages than mortality rates of women. Further, mortality rates at all ages are substantially smaller in 2005 than 1960. In 1960, a 69-year old man had a probability of dying within the next year of 5 percent. In 2005, such a mortality rate was reached only at age 76, representing a gain of 7 years. For women, the respective numbers were 73 and 81, representing an 8 year gain.
--- about here Figure 4 (ratio of mortality rates) ---
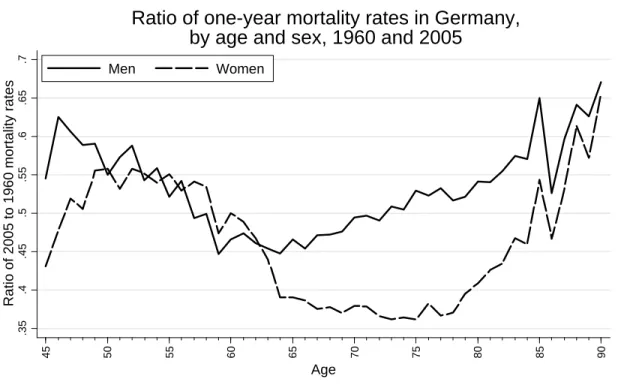
Figure 4 shows relative improvements in mortality rates by age and sex. Note that smaller numbers indicate larger improvements. Across the whole age range, women have gained more than men. However, there is hardly any difference in relative changes between age 50 and 63, where mortality rates have roughly halved since 1960. The biggest relative improvements for women have been between ages 64 and 85. Mortality rates in 2005 were nearly as small as one third of the mortality rates in 1960. For men, the ratio of 2005 to 1960 mortality rates is substantially higher.
Two findings in Figure 4 are relevant for the explanation (or lack of explanation) of trends in labor force participation at older ages in Germany. First, in the relevant age range, secular increases in life expectancy (and health) have favored neither sex. Second, the biggest relative improvements in life expectancy (and health) for men have been exactly at the relevant ages of 59 to 66.
3.2 Trends in other health measures
Although mortality rates are arguably a good measure of health of a specific cohort at some point in time, it might not be the best proxy for work disability. Death is usually the endpoint of a longer-lasting disease that might have reduced work capacity of individuals years before their death. Further, certain diseases and conditions are known to reduce the ability to work in the labor market without being lethal. Depression and musculoskeletal diseases are two prominent examples. Moreover, as mortality declines further among cohorts that are still of working age, the relative importance of non-lethal and lethal conditions for early retirement behavior and disability uptake may shift dramatically. A weak or missing relationship between mortality and health does not necessarily imply that health is irrelevant for early retirement behavior.
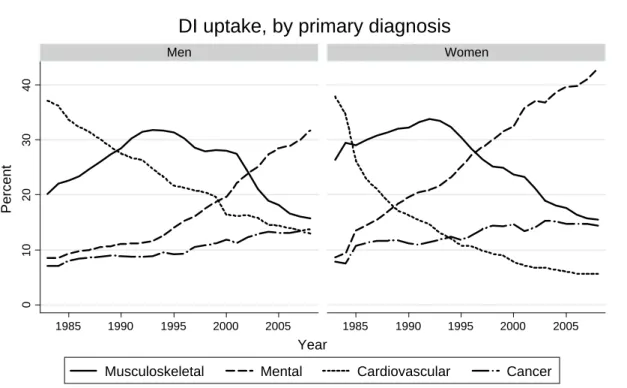
--- about here Figure 5 (diagnoses) ---
Figure 5 shows the development of the proportion of primary diagnoses for disability pension uptake between 1983 and 2008. The importance of cardiovascular diseases has diminished dramatically. In 1983, 37 percent of all men entered DI with cardiovascular disease as primary diagnosis. This percentage has dropped to 14 percent in 2008. Among women the drop was even larger (from 38 percent to 6 percent). During the same period, the relative importance of mental illness has nearly quadrupled for men and quintupled for women. In 2008, mental illness was by far the most frequent primary diagnosis (31 and 43 percent, respectively). Detailed statistics by ICD codes reveal that among women, 43 percent of those retiring early because of mental illness suffered from affective disorders (i.e. depression). Among men, alcohol-related psychiatric problems play an important role. In 2008, more men retired early because of alcohol-related psychiatric problems than because of ischemic heart disease (Deutsche Rentenversicherung 2009). Another noteworthy finding in Figure 5 is the hump-shaped trend for musculoskeletal diseases (mostly osteoarthritis and back problems). While being on the increase as primary diagnosis until the early 1990s, reaching primary diagnosis rates of about one third, musculoskeletal diseases have become much less prevalent among both men and women and are now at 15 percent. Finally, cancer as primary diagnosis for DI uptake has nearly doubled between 1983 and 2008, increasing from some 7 percent to 15 percent for both sexes. To summarize, Figure 5 clearly shows that, with the exception of cancer, non-lethal conditions are important drivers of work disability in Germany. Mental
illness and musculoskeletal diseases account for about half of all men and three fifths of all women retiring on DI.
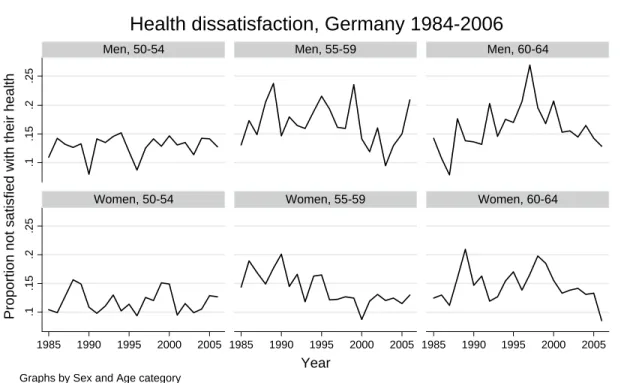
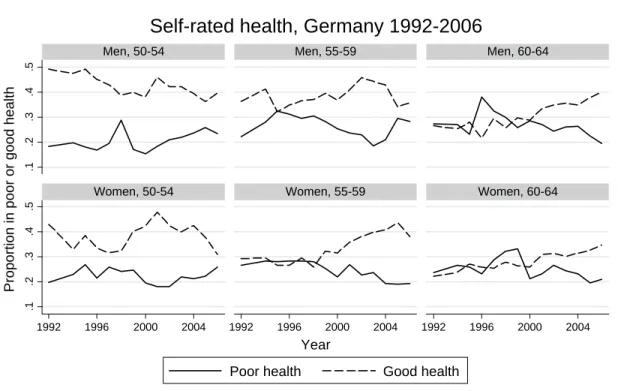
--- about here Figure 6 and 7 (Health satisfaction and self-rated health) ---
Mortality might thus not in all circumstances be the best proxy for work disability. Figures 6 and 7 show – by age and sex – trends in health satisfaction and self-rated health drawn from the German Socio-Economic Panel (SOEP). Data on satisfaction with health have been collected annually in the same format since the first wave of the SOEP in 1984. Data on self-rated health are available only since 1992. With few exceptions, it is hard to see any salient trends in the data. Health dissatisfaction (defined as rating one's satisfaction with health below 5 on a 0-to-10 scale) and poor health (defined as rating one's health as poor or very poor) are basically flat. Good health (defined as rating one's health as good or very good) seems to be increasing among 60 to 64 year old men and women and 55 to 59 year old women. While this pattern seems largely compatible with the secular increase in life expectancy, the downward trend in good health among 50 to 54 year old men does not fit the general picture of improving health status. Moreover, due to sampling variability and other reasons, the data on health satisfaction and general health appear quite volatile. It is unlikely that these data could be usefully employed to explain more short-term trends in disability uptake and labor force participation.
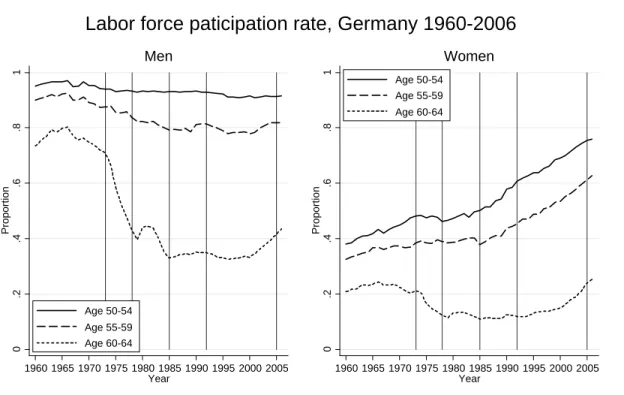
3.3 Trends in labor force participation
Trends in old-age labor force participation rates for men and women are shown in Figure 8. The thin vertical lines indicate the years of various reforms. Looking first at the trend in labor force participation among men, it becomes obvious the that largest changes have happened in the 60 to 64 age range. Labor force participation has dropped from more than 80 percent in 1966 to less than 35 percent in 1980s and 1990s. This was not a long-term process, though. Between 1973 and 1979, labor force participation dropped from 71 percent to 39 percent. Of course, this should not come as a surprise. The 1972 reform addressed exactly the age groups before the official retirement age of 65 years. Since about the year 2000, we observe an increase in labor force participation in this age group. This is most likely a result of the 1992 reform, which is phased in only slowly and which raised legal retirement ages in almost all early retirement options (cf. Börsch-Supan, 1992, 2000). Among men aged 50 to 54 and men aged 55 to 59, Figure 8 shows a steady decline in labor force participation rates between the
years 1965 and 2000. Nothing happens on a similar scale as for 60 to 64 year olds and it is hard to see any connection between the various pension reforms (as indicated by the vertical lines) and changes in labor force participation at ages 50 to 59.
--- about here Figure 8 ---
Labor force participation of older women clearly follows a secular trend towards higher participation rates. Between 1960 and 2006, participation rates of women aged 50 to 54 doubled from 38 to 76 percent and participation rates of women aged 55 to 59 nearly doubled from 33 to 63 percent. Among women aged 60 to 64, we observe a similar pattern as for men in that age range (although on a lower level). The highest labor force participation rate was reached in 1966 (24 percent) and dropped to around 12 percent in the 1980s and 1990s. Again, the largest part of the decline happened as a results of the 1972 reform. In recent years, however, we see a steep increase in labor force participation due to various changes in the course of the 1992 reform. Börsch-Supan (2000) shows that this change can be traced to the introduction of actuarial adjustments enacted with this reform.
3.4 Mortality and labor force participation
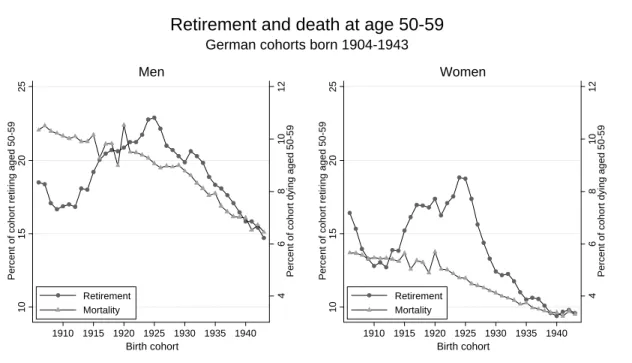
Using mortality rates at a specific age as a proxy for health at a specific age, we now compare long-term trends in mortality and early retirement/DI uptake. We shift perspective by looking at the mortality and retirement at ages 50 to 59 for German cohorts born between 1906 and 1943. The retirement data are aggregated administrative figures collected by the German Pension Fund (available at www.fdz-rv.de). For cohorts born between 1906 and 1943, we know what proportion retired at what age. The data do not show which type of pension was drawn when individuals retired, but this can be more or less inferred from the retirement age. Men and women retiring before age 60, which is what we look at in the following, can only draw DI benefits.
--- about here Figure 9 ---
If long-term trends in disability pension update were driven by long-term trends in health, and given the vast improvements in life expectancy/health seen above, we should expect to see a secular decline in early retirement rates. Figure 9 contrasts trends in mortality and early retirement rates for men and women. 10-year mortality rates at age 50 have gone down from
10.3 to 6.5 percent among men and 5.7 to 3.3. percent among women. Again, we observe a nearly linear decrease with somewhat erratic movement for births around the time of World War I. In contrast, the long-term changes in early retirement are best described by a "down-up-down" pattern. First a decline for cohorts born before 1913, then a steep increase for cohorts born 1913 to 1925, and another decline for cohorts born after 1925. Among men, the proportion who retired aged 50 to 59 decreased from 18.5 for the 1908 cohort to 16.8 percent for the 1912 cohort, then shot up to 22.9 percent for the 1925 cohort and decreased to 14.7 percent for the 1943 cohort. Among women, the proportion who retired aged 50 to 59 decreased from 16.4 (1908 cohort) to 12.7 (1912 cohort), surged to 18.8 (1924 cohort), and then fell to 9.6 percent (1943 cohort).
Whereas the trends before 1913 and after 1925 are in line with the notion that early retirement behavior is largely driven by health, the increase between 1913 and 1925 clearly isn't. On the contrary, cohorts were getting healthier and healthier whilst retiring earlier and earlier. As we show below (section 4.3), trends in labor force participation can at least partly be explained by changes in eligibility rules for disability pensions.
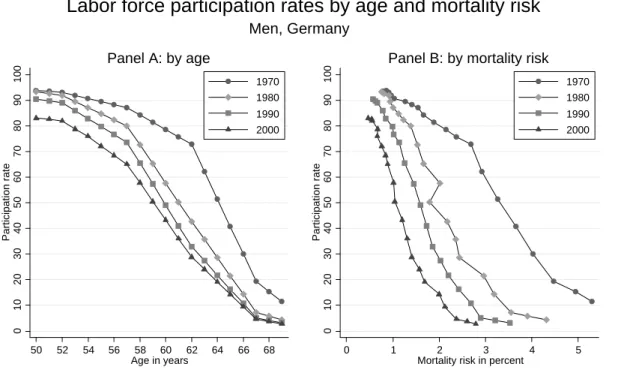
Another way to show the relationship between age, mortality risk/health and labor force participation over the years is presented in Figure 10, which shows labor force participation rates by one-year mortality rates for 1970, 1980, 1990, and 2000, and contrasts this with participation rates by age. Panel A shows that labor force participation rates have decreased at all ages. The biggest shifts have happened between 1970 and 1980 and in the 60 to 64 age range (due to the 1972 and 1978 reforms). For instance, in 1970, 62 percent of all 63-year old men were in the labor force. In 1980, these were 36 percent and 24 percent in 2000. We know from the earlier analysis that life expectancy has increased substantially at all ages since 1970. Thus despite better health, more and more men have left the labor market.
To account for both types of changes, reductions in labor force participation and gains in longevity, at the same time, Panel B shows labor force participation by mortality risk (and thus mutatis mutandis health levels). For instance, a man facing a one percent mortality risk had a likelihood of being in the labor force of 91 percent in 1970 but only 57 percent in 2000. A man facing a two percent mortality rate had a likelihood of being in the labor force of about 80 percent in 1970 and 14 percent in 2000. Thus conditional on health (as measured by
mortality risk), old-age labor force participation has dropped dramatically in the three decades between 1970 and 2000.
--- about here Figure 10 (participation rates by mortality risk) ---
4. How specific reforms have affected the retirement age of different cohorts
In this section we illustrate by three examples how changing social security and disability insurance laws have changed the retirement behavior of German workers. Specifically we look at the 1972, 1978, and 1984 reforms already described in Section 2. We also look at retirement behavior from a different angle than before by exploring how reforms have affected the retirement age of different cohorts. Often reforms take effect sharply and by birth cohort, i.e. individuals born before a certain cut-off date are not affected by a reform, while all individuals born after the cut-off date are affected. Straightforward before-after comparisons of retirement age by cohort thus allow to assess the effect of those reforms. Since the changes in early retirement rules have such predictable and sharp temporary and permanent effects on early retirement and DI uptake, it is highly unlikely that sharp health changes happening simultaneously can explain those effect. As shown in the previous section, mortality rates have decreased steadily and fairly smoothly.
4.1. The 1972 reform
As shown above, the 1972 reform, which took effect in 1973, increased the generosity of the German pension system by a substantial margin. The reform had two components: first, the retirement age of workers with a minimum contribution of 35 years (long-term employed) was reduced from 65 to 63 (without actuarial reductions). Second, disabled workers could draw old-age pensions (instead of disability pensions) from age 62 onwards. The eligibility criteria and the year the reform took effect taken together allow us to identify the cohorts that have been affected by each reform component and to predict how the retirement age has been affected.
The last cohort not affected by the reduction of the retirement age for the long-term employed from 65 to 63 years in 1973 are individuals born in 1908, i.e. those who were already 65 in 1973. The first cohort affected by the reform are those born in 1909 who "suddenly" became eligible for old-age pensions at age 64 if they contributed for at least 35 years to the pension system. Cohorts born 1910 and later became eligible at 63. Consequently, we expect to see a
sudden jump in proportion of workers retiring at age 64 exactly for the 1909 cohort. This should only be a transitory phenomenon, as every cohort born later would be given the option of retiring at age 63 if they had worked long enough.
--- about here Figure 11 (1972 reform) ---
The above prediction is borne out by the Figure 11, which shows for each cohort from 1904 to 1943 the hazard rate of retiring at ages 64, 63, and 62. While the retirement hazard of workers at age 64 was around 10 percent in the cohorts up to 1908, it jumped to 41 percent for the 1909 cohort and dropped back to less than 24 percent for the 1910 cohort. In contrast, the retirement hazard rate at age 63 jumps from 10 percent in the 1909 cohort to 40 percent in the 1910 cohort and even increases to nearly 60 percent for the 1915 cohort.
The second component of the 1972 reform was the introduction of old-age pensions for disabled workers aged 62. Thus cohorts born from 1911 onwards had been given one more early retirement option and we should see a permanent jump in retirement hazard rates at age 62. However, this is not what we see in Figure 11. Retirement hazard rates at age 62 start to increase only from the 1913 cohort onwards until the 1917 cohorts, probably due to the delays in the medical assessment process. Afterwards the retirement hazard at age 62 decline sharply, which is due to the next reform we discuss in this section.
4.2 The 1978 reform
In 1978, it was decided to reduce the age limit for old-age pensions for disabled workers from 62 to 60 years (in two steps in 1979 and 1980). Thus, workers born in 1918 fulfilling all eligibility criteria could draw this pension in 1979 at the age of 61. Workers born in 1919 became first eligible in 1980 also at the age of 61. Finally, workers born 1920 or later could draw this pension from 1980 onwards at the age of 60. Consequently, we expect to see a temporary jump in retirement hazards at age 61 for cohorts 1918 and 1919, and a permanent jump in retirement hazards at age 60 from the 1920 cohort onwards. Again, this expectation is confirmed by the numbers shown in Figure 12. Retirement hazards at age 61 increase from around 12 percent for the 1917 cohort to around 20 percent for those born 1918 and 1919 and then drop back again to 16 percent (and declining) for workers born 1920 or later. The latter group shows a marked increase in retirement at age 60 (from 13 to 23 percent)
--- about here Figure 12 (1978 reform) ---
4.3 The 1984 reform
The 1984 reform, which took effect in 1985, was characterized by restrictions in disability pension eligibility. To be eligible for disability benefits, workers had to have a minimum of three contribution years in last five years before they could draw a pension. In effect, this has ruled out claiming DI for many women who did not work on a regular basis. It is more easy to illustrate how the 1984 reform has affected retirement behavior by changing the graphical representation. Figure 13 shows the absolute number of workers entering disability insurance, by calendar year.
--- about here Figure 13 (1984 reform) ---
It is obvious that the 1984 reform has dramatically changed the number of women retiring on DI pensions. The number has practically halved from 173,000 in 1984 to 86,000 in 1985 (with further decreases in 1986). Among men, the number has dropped from 163,000 in 1984 to 129,000 in 1986.
5. Early childhood environment and very early retirement – an illustrative case study Although the preceding sections have clearly suggested that health is not the main driver behind long-term trends and major short-term changes in early retirement behavior, in particular on disability pensions, it would be surprising if health played no role at all in explaining early retirement. To illustrate possible causal effect of health on retirement, we draw on the current literature on early childhood conditions and long-term health effects. In particular, we show how adverse early childhood conditions which presumably affect health and work capacity in the long run might be responsible for retirement behavior some 50 years onward. We show this using again the data on cohorts born 1904 to 1943, for which we know at what age people entered retirement. Within these cohorts are those born during World War I (1914-1918). In particular the last two years of war (1917 and 1918) have been characterized by widespread hunger among the civilian population. Our question is, does being born during wartime (as a health-shock) explain some of the time-series variation in retirement behavior?
Figure 14 shows the proportion of each cohort born 1904 to 1943 retiring below age 55. Since no other early retirement schemes exist before age 55, these "very early retirees" are exclusively on disability insurance when they retire. In the cohorts 1904 to 1914, the proportion of very early retirees is fairly stable at about 12 to 13 percent. For cohorts 1915 to 1918, this proportion increases steadily until it reaches 17.2 percent in 1918 (an increase of nearly 36 percent ). The first two post-war cohorts show a marked decrease in very early retirement. Beginning at cohorts born 1921, another wave of very early retirement sets in. At this point, we can only speculate about the reasons. The picture for women is even clearer. We observe a continuous decline in very early retirement rates for women born between 1904 and the beginning of World War I. Then very early retirement rates rise by approximately three percentage points or 29 percent. For the 1920 cohort, retirement rates are back to the pre-war level of slighly less than 10 percent, before they increase again slowly. However, they never reach the 1918 levels again.
The purpose of this short section was to illustrate how short-term fluctuations in disability that are independent of reforms may indeed be explained by health-shocks. However, the key is to find the "right" health measure. Mortality rates have not proved to be very successful in explaining early retirement and disability rates. Being born during wartime and times of hunger may have had long-term effects on health and ability to work, and the effects of World War I appear to show in the retirement behavior of German cohorts. Although birth cohort is a very "distant" proxy for health in later adulthood, it has the advantage of being presumably exogenous to disability pension rules.
5. Conclusion
This paper exploited the history of the German pension system with its phases of increasing generosity and subsequent retrenchment in form of several "case studies" and low-level "natural experiments". These reforms suddenly affected many people (mostly by cohort). Simple before-after comparisons suggest that these reforms had substantial effects on labor force participation and retirement. Changes in rules had predictable and sharp temporary and permanent effects on early retirement and DI uptake. Since changes in mortality have generally been very smooth (with the exception of war and immediate post-war cohorts), it is highly unlikely that sharp health changes happening simultaneously are plausible alternative explanations of the effects of institutional change.
Specifically, there is hardly any cross-temporal correlation between DI uptake rates (or, more generally, old-age labor force participation) and available measures of health. We also know from other studies, such as Börsch-Supan (2005, 2008) that there is hardly any cross-national correlation between DI uptake rates and measures of health. This result holds notwithstanding that health does explain within country variation at a specific point in time. Especially mental illness (e.g. depression) has emerged as a driver for early retirement via the disability pathway. However, this is largely unrelated to mortality. Hence, in summary, disability insurance appears to be is mostly a train on its own track and it is largely unrelated to mortality or measures of health status over time and in a cross-national comparison.
References
Aarts, L. J. M., R. V. Burkhauser, and P. R. de Jong (eds) (1996): Curing the Dutch disease.
An international perspective on disability policy reform. Aldershot, Avebury.
Avendano, M, and J. P. Mackenbach (2010): Life-course health and labour market exit in 13 European countries: Results from SHARELIFE, in Börsch-Supan, Schröder et al., The Individual and the Welfare State – Life Histories in Europe, Springer: Berlin, Heidelberg, New York.
Banks, J., A. Kapteyn, J.P. Smith, A. van Soest. (2004): International Comparisons of Work Disability, RAND Working Paper, WP-155.
Börsch-Supan, A. (1992): Population Aging, Social Security Design, and Early Retirement.
Journal of Institutional and Theoretical Economics (Zeitschrift für die gesamte Staatswissenschaft) 148, 533-557.
Börsch-Supan, A. (2000): Incentive Effects of Social Security on Labor Force Participation: Evidence in Germany and Across Europe. Journal of Public Economics, Vol. 78, 25-49. Börsch-Supan, A. (2005): Work Disability and Health. In: A. Börsch-Supan et al. (eds.),
Health, Ageing, and Retirement in Europe – First Results from the Survey of Health, Ageing and Retirement in Europe. Mannheim. pp.253-258.
Börsch-Supan, A. and C. B. Wilke (2006): The German Public Pension System: How it will become an NDC System Look-Alike, In: Robert Holzmann and Edward Palmer (Eds.),
Pension Reform – Issues and Prospects for Non-Financial Defined Contribution (NDC) Schemes, World Bank, Washington D.C., 573-610.
Supan, A. (2008): Changes in Health Status and Work Disability. In: A. Börsch-Supan et al. (eds.), Health, Ageing, and Retirement in Europe – Starting the
Longitudinal Dimension. Mannheim. pp.228-236.
Börsch-Supan, A., and H. Roth (2010): Work Disability and Health over the Life Course, in Börsch-Supan, Schröder et al., The Individual and the Welfare State – Life Histories in Europe, Springer: Berlin, Heidelberg, New York.
Commission for Sustainability in Financing the Social Security Systems (Kommission für dieNachhaltigkeit in der Finanzierung der Sozialen Sicherungssysteme, 2003): Final
Report (Abschlußbericht). Bundesministerium für Gesundheit und Soziale Sicherheit,
Berlin. http://www.bmgs.bund.de/deu/gra/themen/sicherheit/kommission/index.cfm. Deutsche Rentenversicherung (2009): Rentenzugang 2008. Statistik der Deutschen
Rentenversicherung, Band 173.
Data Sources:
Mortality Data: Human Mortality Database (www.mortality.org)
Self-rated health and Health satisfaction: German SOEP, various waves (www.diw.de/soep/en)
Primary diagnosed for disability pensions, Retirement age by cohort: Forschungsportal der Deutschen Rentenversicherung (http://forschung.deutsche-rentenversicherung.de/)
Labor force participation: German Microcensus (Research Data Centre of the German Federal Statistical Office -- http://www.forschungsdatenzentrum.de/en/index.asp)
Figures:
Source: Deutsche Rentenversicherung Bund, Rentenzugangsstatistik Figure 1: Pathways to retirement
Men 0% 10% 20% 30% 40% 50% 60% 70% 80% 90% 100% 1960 1965 1970 1975 1980 1985 1990 1995 2000 2005 Regular old age pension (65)
Flexible retirement (63)
Old age pension for unemployed (60) Old age disability pension (60) Disability pension Women 0% 20% 40% 60% 80% 100% 1960 1965 1970 1975 1980 1985 1990 1995 2000 2005 Regular old age pension (65)
Flexible retirement (63) Old age disability pension (60) Old age pension for unemployed (60) Old age pension for w omen (60) Disability pension
60 65 70 75 Age 1960 1970 1980 1990 2000 2010 Year Reference age 60 Reference age 65 Men 60 65 70 75 Age 1960 1970 1980 1990 2000 2010 Year Reference age 60 Reference age 65 Women Germany 1957-2006
Ages of equal mortality probability
69 to 76 73 to 81 .002 .005 .01 .02 .05 .1 .2 .4 45 50 55 60 65 70 75 80 85 90 Age Men 1960 Women 1960 Men 2005 Women 2005
One-year mortality rates in Germany,
by age and sex, 1960 and 2005
.35 .4 .45 .5 .55 .6 .65 .7 R a
tio of 2005 to 1960 mortality rates
45 50 55 60 65 70 75 80 85 90
Age
Men Women
Ratio of one-year mortality rates in Germany,
by age and sex, 1960 and 2005
0 10 20 30 40 1985 1990 1995 2000 2005 1985 1990 1995 2000 2005 Men Women
Musculoskeletal Mental Cardiovascular Cancer
Percent
Year
DI uptake, by primary diagnosis
.1 .15 .2 .25 .1 .15 .2 .25 1985 1990 1995 2000 2005 1985 1990 1995 2000 2005 1985 1990 1995 2000 2005
Men, 50-54 Men, 55-59 Men, 60-64
Women, 50-54 Women, 55-59 Women, 60-64
Proportion not satisfied w
ith their health
Year
Graphs by Sex and Age category
Health dissatisfaction, Germany 1984-2006
.1 .2 .3 .4 .5 .1 .2 .3 .4 .5 1992 1996 2000 2004 1992 1996 2000 2004 1992 1996 2000 2004
Men, 50-54 Men, 55-59 Men, 60-64
Women, 50-54 Women, 55-59 Women, 60-64
Poor health Good health
Proportion in poor or good health
Year
Self-rated health, Germany 1992-2006
0 .2 .4 .6 .8 1 Proportion 1960 1965 1970 1975 1980 1985 1990 1995 2000 2005 Year Age 50-54 Age 55-59 Age 60-64 Men 0 .2 .4 .6 .8 1 Proportion 1960 1965 1970 1975 1980 1985 1990 1995 2000 2005 Year Age 50-54 Age 55-59 Age 60-64 Women
Labor force paticipation rate, Germany 1960-2006
4
6
8
10
12
Percent of cohort dying aged 50-59
10
15
20
25
Percent of cohort retiring aged 50-59
1910 1915 1920 1925 1930 1935 1940 Retirement Mortality Birth cohort Men 4 6 8 10 12
Percent of cohort dying aged 50-59
10
15
20
25
Percent of cohort retiring aged 50-59
1910 1915 1920 1925 1930 1935 1940 Retirement
Mortality
Birth cohort Women
German cohorts born 1904-1943
Retirement and death at age 50-59
0 10 20 30 40 50 60 70 80 90 100 Participation rate 50 52 54 56 58 60 62 64 66 68 Age in years 1970 1980 1990 2000 Panel A: by age 0 10 20 30 40 50 60 70 80 90 100 Participation rate 0 1 2 3 4 5
Mortality risk in percent
1970 1980 1990 2000
Panel B: by mortality risk Men, Germany
Labor force participation rates by age and mortality risk
.1 .2 .3 .4 .5 .6
Retirement hazard rate
1904 1908 1912 1916 1920 1924 1928 1932 1936 1940
Birth cohort
Age 64 Age 63 Age 62
Retirement Behavior of Male Cohorts
Germany 1904-1943
0
.1
.2
.3
Retirement hazard rate
1904 1908 1912 1916 1920 1924 1928 1932 1936 1940
Birth cohort
Age 61 Age 60
Retirement Behavior of Male Cohorts
Germany 1904-1943
50 75 100 125 150 175 N e w D I enrolment (in 1,000) 1960 1965 1970 1975 1980 1985 1990 1995 2000 2005 Year Men Women
New disability benefit claimants
Germany 1960-2005
8 10 12 14 16 18
Percent of cohort retiring below
age 55
1904 1908 1912 1916 1920 1924 1928 1932 1936 1940
Birth cohort
Men Women