HAL Id: tel-00818263
https://tel.archives-ouvertes.fr/tel-00818263
Submitted on 26 Apr 2013HAL is a multi-disciplinary open access
archive for the deposit and dissemination of sci-entific research documents, whether they are pub-lished or not. The documents may come from teaching and research institutions in France or abroad, or from public or private research centers.
L’archive ouverte pluridisciplinaire HAL, est destinée au dépôt et à la diffusion de documents scientifiques de niveau recherche, publiés ou non, émanant des établissements d’enseignement et de recherche français ou étrangers, des laboratoires publics ou privés.
in 3D media perception : Accommodation/Vergence
conflict in Stereopsis
Cyril Vienne
To cite this version:
Cyril Vienne. Understanding and Improving the Quality of Experience in 3D media perception : Accommodation/Vergence conflict in Stereopsis. Psychology. Université René Descartes - Paris V, 2013. English. �NNT : 2013PA05H102�. �tel-00818263�
- Année
Université Paris Descartes
Ecole doctorale 261 « Cognition, Comportements, Conduites Humaines »
Laboratoire de Psychologie de la Perception / Equipe Vision
Understanding and Improving the Quality
of Experience in 3D media perception
Accommodation/Vergence conflict in Stereopsis
Par Cyril Vienne
Thèse de doctorat de Psychologie
Supervisée par Pascal Mamassian et Laurent Blondé
Présentée et soutenue publiquement le 27 Mars 2013 Devant un jury composé de :
Pr Paul Hibbard, Université de Saint-Andrews (UK) (Rapporteur) Dr Paul Warren, Université de Manchester (UK) (Rapporteur)
Pr Jean-Louis de Bougrenet de la Tocnaye, Telecom Bretagne (Président) Dr Pascal Mamassian, Université Paris Descartes (Directeur)
Dr Laurent Blondé, Technicolor (Co-Directeur) Dr Mark Wexler, Université Paris Descartes
[Insérer le logo correspondant à la licence choisie] [Insérer le logo correspondant à la licence choisie]
Vienne Cyril – Thèse de doctorat - 2013
Résumé (français) :
Les technologies de relief tridimensionnel (3D) ont récemment reçu un nouvel attrait. Les raisons potentielles sont que ces technologies peuvent fournir une expérience visuelle plus riche et plus immersive. En effet, un observateur peut extraire les disparités binoculaires présentées entre les vues gauche et droite, pour retrouver plus efficacement la profondeur de la scène visuelle observée, et ainsi, trouver une nouvelle dimension dans le contenu. Cependant, tandis que la valeur de la profondeur est plutôt bien appréciée, un certain nombre de problèmes qui impactent la qualité de l’expérience dans les représentations 3D ont été identifiés. L’objective de cette thèse est d’étudier les principaux facteurs qui affectent la qualité de l’expérience en stéréoscopie dans le but de fournir des méthodes qui pourraient améliorer l’utilisation des systèmes stéréoscopiques. Trois aspects majeurs de la qualité de l’expérience sont adressés : (1) les sources et causes de la fatigue visuelle, (2) les distorsions perceptives et (3) l’amélioration de la qualité de l’expérience en 3D au travers de l’adaptation du contenu visuel. Pour étudier la fatigue visuelle, les mouvements de vergence étaient mesurés à la fois avec un écran 3D et avec un système à double écran qui permettaient la présentation de stimuli avec les informations de disparité et de flou présentés en congruence comme en incongruence. L’effet de la stéréoscopie sur les mouvements de vergence a été étudié dans le but de tester si la mesure oculaire pouvait être utilisée comme indicateur de fatigue visuelle. Le sujet suivant étudiait la consistance de la perception des formes 3D stéréoscopiques en fonction de distances virtuelles induites par la disparité et par le signal d’accommodation. Le rôle de la taille de la pupille et de la profondeur de champ en stéréoscopie étaient étudiés par la manipulation de la taille de la pupille avec deux conditions d’illumination contrôlée. Finalement, l’amélioration de la perception de la forme 3D est questionnée au travers de l’adaptation du contenu visuel en fonction de la mesure de seuils perceptifs individuels pour des stimuli se déplaçant en profondeur.
Mots clés (français) : perception, 3D, stereoscopy, qualité d’expérience, accommodation, convergence, mouvements oculaires, psychophysique
Title: Understanding and improving the Quality of Experience in 3D media perception Abstract:
Stereoscopic 3-Dimensional (S3D) technology has recently received growing attraction, potentially because it provides a more informative and more immersive visual experience. Indeed, the viewer may extract the binocular disparities displayed between the left and the right views, more efficiently retrieve the depth of the observed visual scene, and thus, give visual content another dimension. However, while the additional value of depth is rather appreciated, a number of problems have been raised that impact the Quality of Experience (QoE) in S3D representations. The objective of this thesis is to investigate the main factors affecting QoE in stereopsis in order to provide guidelines towards the improvement and further use of stereoscopic systems. Three main aspects of QoE in S3D are addressed: (1) the sources and causes of visual fatigue, (2) the perceptual distortions arising in S3D and, (3) the improvement of S3D QoE through content adaptation. To study visual fatigue in S3D, vergence eye movements were measured both in S3D display and in dual-screen display that enables the presentation of matched disparity and defocus stimuli. The effect of stereopsis on vergence movements was studied so as to test whether vergence tracking can be used as indicator of visual fatigue. The next topic investigated the consistency in stereoscopic 3D shape perception as a function of vergence distance and accommodation distance. The role of the pupil size and the depth of focus in S3D were evaluated by manipulating the pupil aperture with two controlled lighting conditions. Finally, the improvement of 3D shape perception is addressed through content adaptation according to individual perception thresholds measurement for motion-in-depth stimuli.
Keywords: perception, 3D, stereopsis, quality of experience, accommodation, vergence, eye movements,psychophysics
Vienne Cyril – Thèse de doctorat - 2013
To my son,
Remerciements
I am very indebted to my supervisor Dr. Laurent Blondé. First, because he offered me the opportunity to work with him and others engineers in the research lab in Technicolor. Second, he always trusted me in the advance of my research and provided me a great support and guidance that were very helpful all along the PhD. I think he is the person who taught me the most during these three last years. I know now that, more than a supervisor, he is a friend.
I would like to express my sincere gratitude to Dr. Pascal Mamassian. Your valuable guidance and scientific suggestions always helped me in my work. I would also like to thank you for your help in administrative steps and communication with the university staff.
These three years in Technicolor would have been absolutely different without all the great people I have met, colleagues and friends will recognize themselves in these words.
I would like to thank Mélanie Reversat for the support for helping me in the organization of the defense procedure.
I would like to thank Cécile and Quan for precious help in correcting some spelling details in the introduction.
Vienne Cyril – Thèse de doctorat - 2013
Table des matières
REMERCIEMENTS ... 6
INTRODUCTION ... 10
CHAPTER 1: INTRODUCTION ... 11
1.1VISUAL INFORMATION FOR DEPTH PERCEPTION IN HUMAN VISION ... 11
1.1.1THE SOURCES OF INFORMATION... 11
1.1.2DEPTH FROM MONOCULAR AND BINOCULAR INFORMATION ... 13
1.1.3BINOCULAR VISION & CORRESPONDENCE: GEOMETRY OF PERCEIVED DEPTH ... 16
1.1.4AMBIGUITY OF DISPARITY INFORMATION & THE NEED FOR SCALING ... 20
1.1.5CUES FOR SCALING HORIZONTAL BINOCULAR DISPARITY ... 21
1.1.6INTERACTIONS BETWEEN DEPTH CUES: BRIEF OVERVIEW ... 23
1.1.7SUMMARY: FROM MULTIPLE CUES TO ONE PERCEPT ... 25
1.2PHYSIOLOGY OF DEPTH PERCEPTION ... 26
1.2.1THE OCULOMOTOR SYSTEM: ELEMENTS AND RESPONSES ... 26
1.2.2MODELING OF ACCOMMODATION AND VERGENCE ACTIVITY ... 34
1.2.3THE OCULOMOTOR DYNAMICS ... 37
1.2.4ADAPTIVE OCULOMOTRICITY AND DEPTH PERCEPTION ... 39
1.2.5SUMMARY: ACCOMMODATION, VERGENCE AND PUPIL IN STEREOSCOPIC DISPLAYS ... 41
1.3STEREOPSIS ... 41
1.3.1BASIC PRINCIPLE ... 41
1.3.2STEREOSCOPIC SYSTEMS ... 43
1.3.3SOME EVIDENCES FOR NEURAL ORGANIZATION ... 45
1.3.4LIMITATIONS: STEREOSCOPIC DISTORTIONS ... 46
1.3.5THE STEREOSCOPIC DEMAND ... 48
1.3.6LIMITATIONS: VISUAL FATIGUE & DISCOMFORT ... 50
1.3.7SUMMARY: DISAPPOINTMENT OF STEREOPSIS, ANY CHANCE FOR IMPROVING? ... 54
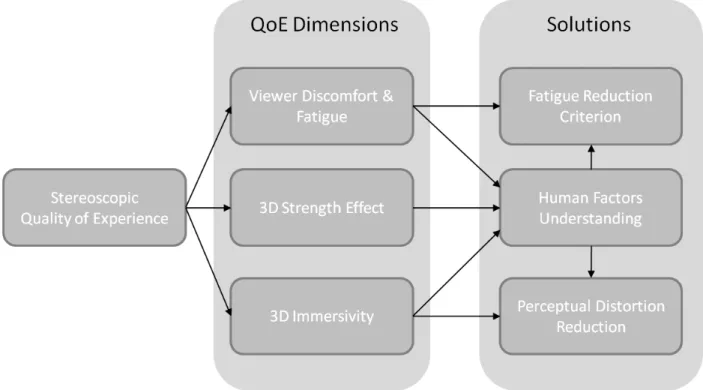
1.4THE QUALITY OF EXPERIENCE IN 3D MEDIA PERCEPTION ... 56
1.4.1UNDERSTANDING VISUAL DISCOMFORT AND FATIGUE ... 58
1.4.2EXPLAINING PERCEPTUAL DISTORTIONS OCCURRING IN STEREOPSIS ... 59
1.4.3IMPROVING S3DQUALITY OF EXPERIENCE ... 61
1.5OVERVIEW OF SUBSEQUENT CHAPTERS ... 62
CHAPTER 2: EXPLORATORY STUDY: VISUAL FATIGUE, VERGENCE EYE MOVEMENTS AND PERCEPTUAL BIAS OF STEREOSCOPIC 3D SHAPE ... 63
2.1INTRODUCTION ... 63
2.2MATERIALS AND METHODS ... 67
2.2.1OBSERVERS ... 67 2.2.2APPARATUS ... 67 2.2.3STIMULI ... 68 2.2.4PROCEDURE ... 70 2.3RESULTS ... 71 2.3.1SUBJECTIVE EXPERIENCE ... 71 2.3.2PERCEPTUAL ESTIMATION ... 71
2.3.3HETEROPHORIA AND FIXATION DISPARITY ... 75
2.3.4VERGENCE REACTION TO DISPARITY-STEP ... 76
2.4DISCUSSION ... 80
2.5CONCLUSION... 86
CHAPTER 3: OCULAR VERGENCE IN STEREOSCOPIC DISPLAYS... 89
3.1INTRODUCTION ... 89 3.2EXPERIMENT 1 ... 92 3.2.1METHOD ... 93 3.2.2RESULTS ... 96 3.2.3DISCUSSION ... 100 3.3EXPERIMENT 2 ... 101 3.3.1METHOD ... 102 3.3.2RESULTS ... 104 3.3.3DISCUSSION ... 108
3.3.4ANALYSIS OF VERGENCE POSITION DIFFERENCE ... 110
3.4GENERAL DISCUSSION ... 112
CHAPTER 4. AN ATTEMPT TO INCREASE THE DEPTH-OF-FOCUS OF THE EYES FOR REDUCING DISCOMFORT IN STEREOSCOPIC DISPLAYS ... 115
4.1INTRODUCTION ... 115 4.2METHOD... 118 4.2.1OBSERVERS ... 118 4.2.2APPARATUS ... 118 4.2.3STIMULI ... 119 4.2.4PROCEDURE ... 120 4.3RESULTS ... 120 4.4DISCUSSION ... 122
CHAPTER 5. THE WEIGHT OF ACCOMMODATION IN 3D SHAPE PERCEPTION WITH LIGHT-MODULATED DEPTH-OF-FOCUS ... 126 5.1INTRODUCTION ... 126 5.2.EXPERIMENT 1 ... 132 5.2.1METHOD ... 132 5.2.2RESULTS ... 136 5.2.3DISCUSSION ... 140 5.3EXPERIMENT 2 ... 142 5.3.1METHOD ... 142 5.3.3DISCUSSION ... 147 5.4.GENERAL DISCUSSION ... 150 5.5.CONCLUSION ... 152
Vienne Cyril – Thèse de doctorat - 2013
CHAPTER 6. PERCEPTUAL BIAS IN STEREOPSIS & OPTICAL MODELS OF THE EYE ... 155
6.1INTRODUCTION ... 155
6.2ORIGIN OF THE SCALING FACTOR ... 156
6.2.1OPTICAL EFFECT OF ACCOMMODATION AND THE “ZOOM LENS” HYPOTHESIS ... 156
6.2.2ACCOMMODATION CONTRIBUTION FROM SENSORIMOTOR FEEDBACK ... 159
6.3CONCLUSION... 160
CHAPTER 7. DISTORTION FROM STEREOPSIS IN MOTION-IN-DEPTH WITH LINEAR PERSPECTIVE .. 162
7.1INTRODUCTION ... 162 7.2.EXPERIMENT 1 ... 165 7.2.1METHOD ... 165 7.2.2RESULTS ... 169 7.2.3DISCUSSION ... 171 7.3.EXPERIMENT 2 ... 173 7.3.1.METHOD ... 175 7.3.2RESULTS ... 177 7.3.3DISCUSSION ... 180 7.4.GENERAL DISCUSSION ... 181 CHAPTER 8. CONCLUSION ... 184
8.1VISUAL FATIGUE AND DISCOMFORT IN STEREOSCOPIC DISPLAYS ... 185
8.2PERCEPTUAL DISTORTIONS IN STEREOPSIS WITH VIRTUAL VERGENCE DISTANCES ... 187
8.3ON THE POSSIBILITY TO ADJUST 3D CONTENT ON THE BASIS OF PERCEPTUAL THRESHOLDS ... 188
8.4UNDERSTANDING &IMPROVING QOE IN STEREOSCOPIC DISPLAYS ... 190
REFERENCES ... 192
Introduction
The new wave of stereoscopic movies has stimulated a novel interest regarding the understanding of stereopsis. The most interesting contribution of stereoscopic movies is certainly the introduction and, somewhat trivialization of motion in depth in natural visual scene rendering (e.g. the famous commercial for fruit gums). In stereoscopic movies, motion-in-depth is reproduced on the basis of the combination of stereoscopic depth and simulated motion. These two techniques of simulation have been invented independently in the middle of the 19th century. This is only with the advance of motion pictures that the first stereoscopic movies are born in the beginning of the 20th century.
A second contribution of this new generation is the advance of technology. The new buzz of stereoscopic films in theater has strongly benefited from the disappearance of anaglyphs systems in spite of the persisting need to wear glasses. This enthusiasm had led the entertainment industry to transfer the stereoscopic cinema movies to formats adapted to 3DTV. Many modern TVs are now 3D compatible, even though the available number of broadcasting 3D media did not really extend.
At the beginning, this thesis work was thus part of a 3DTV project. This explained why we used 3DTV instead of stereoscope and why we placed observers at viewing distances larger than those of previous studies on stereoscopic depth perception. As the title suggests, the objective of this thesis was to improve the understanding of the specificities of stereoscopic perception and systems that may impact the visual experience. From this better understanding, it will thus possible to derive the guidelines that may improve the stereoscopic experience. This thesis is a set of reports (sometimes of work submitted to scientific journals) preceded by an introduction which objective is to introduce the key concepts for the understanding of human factors involved in stereopsis and to explain what psychology as a science may do for improving the quality of experience in stereoscopic displays. A conclusion is proposed at the end of this thesis to summarize the findings and their possible use in stereoscopic imaging systems.
Vienne Cyril – Thèse de doctorat - 2013
Chapter 1: Introduction
1.1 Visual information for depth perception in human
vision
How humans see and understand their visual world and, especially, what information is needed to estimate the metrics used for visual perception is of major concern for who wants to address the quality of experience in 3D imaging displays. In order to understand perception, it is worth describing the visual environment and its constituents. This introduction part will describe the information available within the environment, what is monocular or binocular, the viewing geometry and, the special case of binocular disparity.
1.1.1 The sources of information
Information for perception is of pattern of stimulation from sensory input that is demonstrably used by an observer (Cutting, 1991). In this, a distinction can be made between the physics of natural situations and the pattern of stimulation per se. Koffka (1935) introduced the classical formal distinction between the energy emitted by or reflected from some object in the environment – the distal stimulus – and, the energy that reaches the senses – the proximal stimulus. The act of perceiving can thus be defined as the process of inferring the properties of the distal stimulus on the basis of the proximal stimulus (Koffka, 1935). Perception appears thus strongly based on the information from the structure of the environment. In nature, this flow of information may be considered as rich, organized and meaningful (Gibson, 1979). The information related to the spatial extent of the surrounding world is certainly one of the most relevant for the human visual system. The potential information that is available for the visual system is often labeled a “cue”. This term is used in literature to make mention of the available information in the surrounding world, but implicitly assumes that the observer has prior knowledge about the features he/she encounters in his/her environment (Cutting and Vishton, 1995). According to Woodworth (1938) the cue “is a stimulus which serves as a sign or signal of something else, the connection having previously been learned”. For Brunswik (1956), a cue consists in a visual pattern or set of visual relations about which one have
obtained experience. Each proximal depth cue is associated with a particular distal arrangement of objects whose association occurs with a given probability (Cutting, 1998). More specifically, Ernst and Bülthoff (2004) characterize the cue as “any sensory information that gives rise to a sensory estimate” which implies that a cue is a part of the proximal stimulus that has already been identified and pre-processed. It is important to note this term may be interchangeably used with others like signal, information, source of information and even clues.
Among the flow of information, the most important way by which humans obtain knowledge about the world is vision. As multiple cues can be projected onto the retina, the visual system can also make use of non-visual information, e.g., from oculomotor activity; this consists in the distinction between retinal and extra-retinal information. A number of visual information can be listed to account for visual perception of depth in three-dimensional space. For instance, Cutting and Vishton (1995) described several sources of information among others that are obviously useful for understanding layout and shape in the environment; their efficacy in mediating distance information are for many of them distance-dependent (Cutting, 1997). However, all of these cues do not provide the same sampling unit when sensed by the visual system and, therefore some provide ordinal information while other yields metric information about the world; these values are either relative or absolute. The redundancy of such sources of information provides the way by which individuals can efficiently interact within the environment.
It is broadly acknowledged that past experience can influence present perceptual experience; i.e., perceiving is also remembering (Gibson, 1979). As a matter of fact, prior knowledge or assumptions about the environment can influence the perceptual solution in various cases (Mamassian, 2006), i.e., when observers have to judge uncertain information or even when they have to combine multiple cues available in the rich environment (Hibbard et al., 2012). Hence, the perceptual systems enable individuals to see their surrounding world as stable, although the sensory information reaching the senses might be incomplete, uncertain and constantly changing. This is specifically the case when perceiving drawings and pictures, for example drawings on a two-dimensional flat surface that has to convey information about the three-dimensional structure (see Figure 1.1).
Figure 1.1: Depiction of four different cubes where occlusion is specified by different modes of intersection of the same line
Opaque sheets of a hollow body, (3) Anomalous occlusion leading to contradictory impression and, (4) Transparent cube leading to ambiguous impression due to reversibility.
1.1.2 Depth from monocular and binocular information
Humans have frontally located eyes allowing the acute perception of shapes and object positions without requiring head or body movements
frontal binocular information consists in two slightly different patterns of stimulation that lead to two overlapping points of view of the surrounding world. In that, information from the two eyes gives rise to both mismatched and matched optical information. Thus, binoculari provides both disparity and concordance of the visual information to the human visual system (Jones & Lee, 1981). In complement, even though it can be projected onto the retina of both eyes, there is monocular information available for depth perception.
about monocular information, one used to think about the visual information from one eye. Indeed, there are numerous monocular sources of information that contribute to depth perception.
The most basic source of depth information is
physically changes as the distance of the object changes from the observer. Using playing cards of various sizes, Ittelson (1951) showed that relative size can operate as a cue to distance; any change in the assumed
As a matter of fact, the more the object becomes distant from the observer, the more the retinal size of the object of interest appears small. As a consequence, retinal image size becomes a relative cue to distance from the change in size of a same object or when two identical objects project different retinal image sizes. However, information from retinal size is strongly related to information of familiar size because objects of particular size ofte belong to a category of common objects. Also, relative density is a powerful cue to depth in
Vienne Cyril – Thèse de doctorat
Depiction of four different cubes where occlusion is specified by different modes of intersection of the same line segments. From left to right: (1) Opaque surfaces cube, (2)
Opaque sheets of a hollow body, (3) Anomalous occlusion leading to contradictory impression and, (4) Transparent cube leading to ambiguous impression due to reversibility.
Figure from Gibson (1979, p290).
Depth from monocular and binocular information
Humans have frontally located eyes allowing the acute perception of shapes and object positions without requiring head or body movements – contrary to motion parallax. This ormation consists in two slightly different patterns of stimulation that lead to two overlapping points of view of the surrounding world. In that, information from the two eyes gives rise to both mismatched and matched optical information. Thus, binoculari provides both disparity and concordance of the visual information to the human visual system (Jones & Lee, 1981). In complement, even though it can be projected onto the retina of both eyes, there is monocular information available for depth perception. However, when speaking about monocular information, one used to think about the visual information from one eye. Indeed, there are numerous monocular sources of information that contribute to depth
The most basic source of depth information is conveyed by the retinal image size that physically changes as the distance of the object changes from the observer. Using playing cards of various sizes, Ittelson (1951) showed that relative size can operate as a cue to distance; any change in the assumed-size can be perceived as a change of apparent distance. As a matter of fact, the more the object becomes distant from the observer, the more the retinal size of the object of interest appears small. As a consequence, retinal image size cue to distance from the change in size of a same object or when two identical objects project different retinal image sizes. However, information from retinal size is strongly related to information of familiar size because objects of particular size ofte belong to a category of common objects. Also, relative density is a powerful cue to depth in
Thèse de doctorat - 2013
Depiction of four different cubes where occlusion is specified by different modes segments. From left to right: (1) Opaque surfaces cube, (2) Opaque sheets of a hollow body, (3) Anomalous occlusion leading to contradictory impression and, (4) Transparent cube leading to ambiguous impression due to reversibility.
Humans have frontally located eyes allowing the acute perception of shapes and object contrary to motion parallax. This ormation consists in two slightly different patterns of stimulation that lead to two overlapping points of view of the surrounding world. In that, information from the two eyes gives rise to both mismatched and matched optical information. Thus, binocularity provides both disparity and concordance of the visual information to the human visual system (Jones & Lee, 1981). In complement, even though it can be projected onto the retina of both However, when speaking about monocular information, one used to think about the visual information from one eye. Indeed, there are numerous monocular sources of information that contribute to depth
conveyed by the retinal image size that physically changes as the distance of the object changes from the observer. Using playing-cards of various sizes, Ittelson (1951) showed that relative size can operate as a cue to
size can be perceived as a change of apparent distance. As a matter of fact, the more the object becomes distant from the observer, the more the retinal size of the object of interest appears small. As a consequence, retinal image size cue to distance from the change in size of a same object or when two identical objects project different retinal image sizes. However, information from retinal size is strongly related to information of familiar size because objects of particular size often belong to a category of common objects. Also, relative density is a powerful cue to depth in
the way that the projected number of similar textures or patches per solid visual angle varies progressively with distance (Cutting, 1997). This is a particular case of texture gradients that Gibson (1950) was the first to notice as providing visual information about surface orientation and depth. At close viewing distances, the blur present in the retinal image due to defocus can play a role in judging ordinal depth relation (e.g., Hoffman & Banks, 2010; Mather, 1996) but its efficient range of distances is very limited because the depth-of-field rapidly increases with distance. Blur can however be used in photographs or pictures so as to create potent illusion of depth as for example in the tilt-shift illusion, where pictures of natural scenes are perceived as miniature models. In addition, extra-retinal information from the activity of the ciliary muscles controlling the eye-lens accommodation could also yield ordinal information about distance for a range of distances between 10 cm (the punctum proximum) to 2 or 3 meters (Mon-Williams & Tresilian, 2000; Fisher & Ciuffreda, 1988) because only in this range the changes in accommodation lens are significant enough. Another monocular source of information that varies with distance is the height in the visual field (Cutting, 1997). Height in the visual field yields information about distance because objects further away are generally higher in the visual field. This refers specifically to the relation among the bases of objects in the environment as projected to the eye, moving from the bottom of the visual field to the top. The utility of such information is questionable as it depends on the presence of a ground plane. However it is apparently used in pictures perception (Dunn, Gray & Thompson, 1965). Generally at far distance, aerial perspective can also play a role because of the apparent reduction of contrast due to solar light scattering by atmospheric molecules or particles on the optical path to the object. Two final strong monocular sources of information about depth relation are occlusion and motion parallax. Occlusion (or interposition) appears when one object partially hides another from view and, therein only provides ordinal information but over a wide range of distances (Chapanis & McCleary, 1955). Motion parallax is the kind of observer movement that induces a corresponding movement of the image onto the retina. Generally in case of horizontal translation of the observer (leftward or rightward), the retinal motion for objects before the fixation point is opposed to that of objects behind the fixation point. In addition, there is a relationship between the retinal motion velocity and the distance of the object in the visual field (Gibson, 1950).
As it can be seen from this non comprehensive list, a lot of monocular cues for perceiving depth are available in the flow of information. To all these monocular cues must be added two types of potential binocular information, vergence and disparities. The former consists in the extra-retinal signal provided by the counter-rotational activity of the two eyes in bringing the
gaze axes to the same fixation point. The measure of vergence is done through the angle between the visual axes of the two eyes; this angle increases for small viewing distance and decreases toward infinity. Contribution of vergence as extra
(e.g., Tresilian, Mon-Williams and Kelly, 1999; Gogel, 1961) and its involvement c
rather precise for distances up to 2 meters (Gogel, 1961). The second class of binocular cues refers to binocular disparities. They are the slight horizontal and vertical differences that arise through the projection of the perspective of two diffe
example of two pictures taken from two slightly different points of view. When presented to the visual system, the two inputs provide both similar and dissimilar information. In addition, it can be seen that a lot of cues are present to render the natural scene depth. The use of binocular disparity in depth perception has been widely confirmed (e.g., Julesz, 1971) and the understanding of how the human visual system extracts the depth relations from two different monocular inputs has fascinated many researchers for a long time (Howard, 2002). The geometry of horizontal disparity is thus discussed in the following subsection.
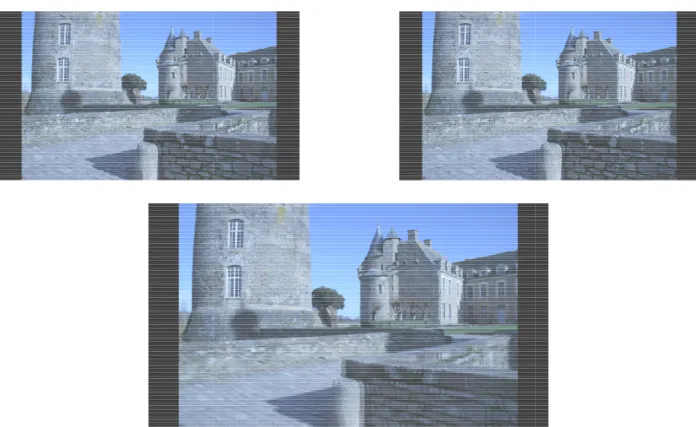
Figure 1.2: How two pictures from slightly different points of view (upper left and right views) give binocular disparity. Upper left and right pictures were taken with a camera baseline of 64 mm, they are here arranged for cross fusion (i.e. left image for right eye and right image for left eye). The lower image is a representation of the two v
them line-by-line; this method can be used to display 3D content on a polarized display such
Vienne Cyril – Thèse de doctorat
gaze axes to the same fixation point. The measure of vergence is done through the angle e visual axes of the two eyes; this angle increases for small viewing distance and decreases toward infinity. Contribution of vergence as extra-retinal cue was shown earlier
Williams and Kelly, 1999; Gogel, 1961) and its involvement c
rather precise for distances up to 2 meters (Gogel, 1961). The second class of binocular cues refers to binocular disparities. They are the slight horizontal and vertical differences that arise through the projection of the perspective of two different points of view. Figure 1.2 gives an example of two pictures taken from two slightly different points of view. When presented to the visual system, the two inputs provide both similar and dissimilar information. In addition, f cues are present to render the natural scene depth. The use of binocular disparity in depth perception has been widely confirmed (e.g., Julesz, 1971) and the understanding of how the human visual system extracts the depth relations from two different ocular inputs has fascinated many researchers for a long time (Howard, 2002). The geometry of horizontal disparity is thus discussed in the following subsection.
Figure 1.2: How two pictures from slightly different points of view (upper left and right iews) give binocular disparity. Upper left and right pictures were taken with a camera baseline of 64 mm, they are here arranged for cross fusion (i.e. left image for right eye and right image for left eye). The lower image is a representation of the two views by interlacing
line; this method can be used to display 3D content on a polarized display such
Thèse de doctorat - 2013
gaze axes to the same fixation point. The measure of vergence is done through the angle e visual axes of the two eyes; this angle increases for small viewing distance and retinal cue was shown earlier Williams and Kelly, 1999; Gogel, 1961) and its involvement could be rather precise for distances up to 2 meters (Gogel, 1961). The second class of binocular cues refers to binocular disparities. They are the slight horizontal and vertical differences that arise rent points of view. Figure 1.2 gives an example of two pictures taken from two slightly different points of view. When presented to the visual system, the two inputs provide both similar and dissimilar information. In addition, f cues are present to render the natural scene depth. The use of binocular disparity in depth perception has been widely confirmed (e.g., Julesz, 1971) and the understanding of how the human visual system extracts the depth relations from two different ocular inputs has fascinated many researchers for a long time (Howard, 2002). The geometry of horizontal disparity is thus discussed in the following subsection.
Figure 1.2: How two pictures from slightly different points of view (upper left and right iews) give binocular disparity. Upper left and right pictures were taken with a camera baseline of 64 mm, they are here arranged for cross fusion (i.e. left image for right eye and
iews by interlacing line; this method can be used to display 3D content on a polarized display such
as the one used in this thesis. Acknowledgments to Jean-Jacques Sacré for the photographs of Châteaugiron (Brittany, France).
1.1.3 Binocular vision & correspondence: geometry of perceived depth
When we look at a particular place in the environment, both eyes receive optical information through the pupil reaching the retinas. This optical information is formed of photons, which before arriving on the retina will cross a thick optical system, namely a “thick dual lens system” formed by the cornea and the crystalline-lens. For that reason, the imaging lens system produces an anterior nodal point and a posterior nodal point on the optical axis. The nodal point is the location through which passes all the straight lines that join points in the object plane to their corresponding points in the image plane on the retina (Howard and Rogers, 1995). These lines are labeled visual lines when intersecting the center of the fovea (central region of the retina where visual acuity is the highest) or optical lines when meeting the optical centre of the eye. This implies that the visual axis in focus and the optical axis do not coincide (see Figure 1.2 below).
Figure 1.2: Schematic representation of the projection of the optical axis and the visual axis in the human eye. The angle between the visual axis and the optical axis is about 5° on average.
The red dashed line represents the optical axis and the blue line represents the visual line projecting in the center of the fovea. The fovea is slightly shifted as compared to the
projection of the optical center of the eye on the retina.
When an observer converges forward to a fixation point P, the vergence angle depends on both the fixation distance and the inter-ocular separation – on average across observers about 64 mm. When the convergence angle is equal to zero, meaning that the lines of sight are
Vienne Cyril – Thèse de doctorat - 2013
parallel, both eyes supposedly receive the same optical information; the retinal images are similar. Now, increasing the vergence angle by fixating an object located nearer than infinity will increase the differences between the two retinal images. Differences between the retinal images of the left and the right eyes are called binocular disparities. Binocular disparities are described in three types: horizontal disparity, vertical disparity and cyclo-disparity. For each point in the retina of one eye, there is a corresponding point in the retina of the other eye. Specifically, corresponding points in the two eyes are pairs of points located in the binocular visual field that are seen in the same direction (Hillis & Banks, 2001). Hence, images in both eyes falling on corresponding points have zero binocular disparity. There is a combination of points in the binocular visual field that give rise to corresponding points in both eyes and has no disparity. This zone is the Vieth-Müller circle – also called the theoretical horopter – passing through the fixation point and the nodal points of the eyes (see Figure 1.3 just below). Any points located out of this zone will produce disparity on the retinas and the object will be seen either at a different depth or seen double if located away from this zone – objects perceived as double refer to the term “diplopia”.
The Vieth-Müller circle symbolizes the theoretical horopter that can be computed as a function of the geometry of the eyes and a given viewing distance. The empirical horopter can be measured according to different methods in laboratory. For instance, Hering (1879) estimated empirical horopters using a technique called the apparent fronto-parallel plane horopter method. The procedure is as follows: the observer has to keep fixating on the same point and align a number of stimuli on either side of the fixation point so that they all are in a plane parallel to the subject’s face, i.e. a fronto-parallel plane. Other methods have been developed since then (e.g., the diplopia based-horopter, stereoacuity horopter and nonius horopter). The most accurate method is the nonius horopter that is based on the Vernier technique through dichoptic vision (e.g., using a stereoscope). Here the upper half part of the line is seen by one eye while the other sees the lower half part. While keeping the same fixation point, the task is to align the two lines without fusion (Ogle, 1964).
An object located nearer to an observer than the horopter (see example in Figure 1.3, point P4) creates crossed disparities in the two eyes because the visual lines intersect in front of the horopter. An object located farther than the horopter produces uncrossed disparities in the two eyes because the visual lines cross this time beyond the horopter. The angular disparity produced by a point P when converging at a fixation point F can be calculated by the difference between the convergent angle at F and the convergent angle at P where η = αF - αP
(see Figure 1.4). By convention, in this document, the angular binocular disparity is negative for crossed disparity and positive for uncrossed disparity.
Figure 1.3: Schematic representation of the horizontal horopter. Here the two eyes converge on P1 that is “fovealized”. Fixation points P1, P2 and P3 have zero retinal disparity as visual lines fall on corresponding areas in both retinas; these three points have identical convergence
angles equal to α. P4 being not on the horopter generates disparity in the two eyes; the angle of convergence is larger than the one of P1,P2 and P3.
Retinal disparity can also be derived from the inter-ocular difference (I), the depth difference between point P and the fixation point F ( d) and the viewing distance between the observer and point P (D) such as:
=
.∆.∆ (1.1)
in radians (Howard & Rogers, 1995), assuming that P and F are on the sagittal plane and thus have no eccentricity.
One can also derive the following equations so as to reciprocally determine the theoretical depth distance (Adams, 1955):
=
. for Ds<D (crossed disparity) and,=
.
for Ds>D (uncrossed disparity) (1.2);
being the unsigned shift size (lateral displacement) on an imaged fronto-parallel plane situated at viewing distance D (see section about stereoscopy).
Vienne Cyril – Thèse de doctorat - 2013
The slight difference produced in the retinal images of both eyes when converging can also be characterized in terms of disparity gradients. A disparity gradient G between two points in the binocular visual field is the difference in their angular disparities divided by their separation in visual angle unit. This concept of disparity gradients is particularly interesting because fusion can fail when this gradient exceeds a critical value of about 1 (Trivedi & Lloyd, 1985). Furthermore, the range of disparities that gives rise to object perception with singleness is called Panum’s fusional area (Panum 1858). In other words, objects with small enough disparity that can be fused and seen as single fall in Panum’s fusional area. Conversely, the points falling outside this area are seen as double, which is referred to as diplopia. The angular extent of Panum’s fusional area depends on several factors, including retinal eccentricity, stimulus characteristics and surrounding stimuli (Howard & Rogers, 1995). For example, the limits of fusion have been shown to be influenced by the spatial frequencies of the stimulus; low spatial frequencies providing greater fusion capacities (Schor et al., 1984). Different images falling in Panum’s zone fail to provide fusion but instead exhibit binocular rivalry, that is, the alternate perception of the two images.
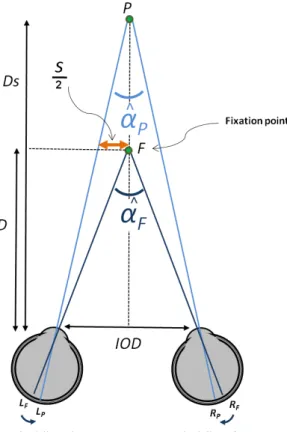
Figure 1.4: Schematic representation of convergence on fixation point F and the point P at disparity η (difference between
convergence angle αF and angle αP). D represents the distance from the cornea of
the eye to the fixation point F, DS represents the distance to the point P, IOD
is the inter-ocular distance and, s is the lateral displacement on the fronto-parallel
1.1.4 Ambiguity of disparity information & the need for scaling
Considering space perception as Euclidean and therefore that veridicality is possible, the perception of depth from stereopsis depends on viewing geometry and, for that reason is ambiguous when this information is considered alone. Indeed, the horizontal retinal disparity between two points depends on the distance between the observer and the points (Glennerster, Rogers & Bradshaw, 1996). Specifically, the magnitude of horizontal retinal disparity between any pair of points varies approximately inversely with the square of the viewing distance (Kaufman, 1974). Hence, knowing vergence angle and I, one can retrieve depth in 3D space only if the viewing distance that separates the observer from the pair of points is known. In order to see an object in stereopsis, the viewer thus has to determine an observation distance acting as a parameter in disparity disambiguation for depth perception. According to the pinhole model – simple projection geometry in paraxial approximation –, the depth of a point relative to another one can be calculated using the following formula:
=
. ²± . (1.3)
where η is the relative disparity between the pair of points, D is the viewing distance (i.e., accommodation-vergence distance) and I is the inter-ocular distance. Note that we purposefully use the ± sign in the denominator to emphasize the dependence of the value of depth on the location of the simulated point relative to the fixation plane.
For a depth difference of two points located on the same z axis, disparity is given by the following formula:
=
.( ± ) (1.4)
assuming that depth difference d is the difference between two symmetric vergence angles. Since d is usually small by comparison to D we get
≈
.² (1.5)
From equation 1.5, one can see the approximate inverse squared relationship between the disparity of an object and its distance from the observer. Rearranging the equation 1.5 gives:
≈
. ² (1.6)There it can be seen that in order to estimate the depth difference d, the visual system needs information about the viewing distance D. The information about the viewing distance can be
Vienne Cyril – Thèse de doctorat - 2013
perceived on the basis of visual cues under some conditions described in the following subsection.
1.1.5 Cues for scaling horizontal binocular disparity
It has been shown that observers can dramatically misperceive depth when judging 3D shape from binocular disparities (e.g., Johnston, 1991). According to the results of Johnston (1991), a disparity-defined hemi-cylinder is perceived circular at intermediate distance (107 cm) but its depth becomes overestimated (elongated) as the viewing distance decreases (53.5 cm) and underestimated (compressed) as the viewing distance increases (214 cm). This observation has been interpreted as the consequence of an incorrect estimate of scaling distance by the observer (Johnston, Cumming & Landy, 1994; Johnston, 1991). When asked to match the depth-to-height or depth-to-width ratio of a hemi-cylinder, participants had to compare the horizontal or vertical dimension (height or width) with the depth information, and both of these dimensions need estimate of the viewing distance to be properly used (Johnston, 1991). There is experimental evidence supporting the fact that retinal size and disparities can be scaled according to the same viewing distance (van Damme & Brenner, 1997).
The information from the state of extra-ocular muscles can theoretically provide an estimate of the vergence angle to the visual system so as to determine the distance separating the observer from the fixation point. There is some experimental evidence that supported this idea, for example when observers were required to judge distance in impoverished environment (Tresilian, Mon-Williams & Kelly, 1999; Rogers & Bradshaw, 1995; Foley, 1980) but, other authors found poor performances when vergence was the unique cue to distance (Brenner & van Damme, 1998; Gogel, 1972). Some authors thus concluded that vergence information, if involved in perceptual estimation, could only play a minor role (Brenner & van Damme, 1998). However, additional investigators have shown that vergence could contribute to distance perception in the absence of other cues for rather small fixation distances (Tresilian, Mon-Williams & Kelly, 1999; Mon-Williams & Tresilian, 1998). The study by Tresilian et al. (1999) also showed a strong contraction bias that had already been observed earlier (e.g., Gogel & Tietz, 1973). This specific distance tendency corresponded to distance overestimation for near target and distance underestimation for far target in reduced-cue environment (Foley, 1980; Gogel & Tietz, 1973), i.e., in the dark (Gogel, 1969). The specific distance tendency could be related to the resting tonic state of vergence (Owens & Leibowitz, 1976) and could have influenced distance estimates in the previous experiments.
The horizontal gradient of vertical disparity could also help observers to establish an estimate of viewing distance (Mayhew & Longuet
disparity with eccentricity. Vertical disparity exists because points that are not lying in the median plane (or sagittal plane
vertical retinal projections in both eyes (Howard & Rogers, 1995). The horizontal size ratio (HSR) and the vertical size ratio (VSR) are represented for a surface patch in Figure 1.5. The HSR changes with the tilt of the surface but is ambiguous when
the horizontal alignment of the eyes. Considering the VSR, from Figure 1.5 it can be seen that the vertical angular extent projected in the closer eye is larger than that projected in the farther eye. There is empirical evidence
vertical disparity is the consequence of perspective viewing
disparities (e.g., Bradshaw, Glennerster & Rogers, 1996; Rogers & Bradshaw, 1995).
disparity varies approximately linearly with eccentricity and its horizontal gradient decreases with observation distance, thereby explaining how such information may disambiguate the estimate of viewing distance (Gillam & Lawergren, 1983).
becomes significant in situations using large field of view and, therefore requires sufficiently large display (Bradshaw, Glennerster & Rogers, 1996).
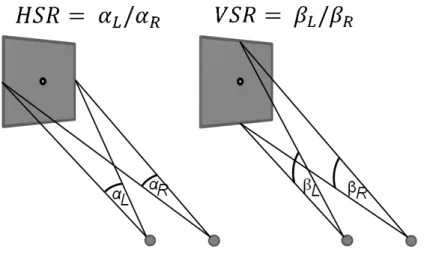
Figure 1.5: This figure represents the horizontal size ratio (HSR) and vertical size ratio (VSR). Angles αL and αR are the horizontal angles subtended by the patch for the left and right
eyes. The horizontal size ratio (HSR) is defined as
angles subtended by the surface patch. The vertical size ratio (VSR) is defined as left eye is closer to the surface than the right eye, then
The ability to estimate the viewing distance would thus be dependent on the
and on the size ratios of horizontal and vertical disparities but, other factors such as some The horizontal gradient of vertical disparity could also help observers to establish an estimate Mayhew & Longuet-Higgins, 1982); this is the variation of vertical . Vertical disparity exists because points that are not lying in the or sagittal plane) will be closer to one eye than the other, resulting in diffe vertical retinal projections in both eyes (Howard & Rogers, 1995). The horizontal size ratio (HSR) and the vertical size ratio (VSR) are represented for a surface patch in Figure 1.5. The HSR changes with the tilt of the surface but is ambiguous when considered alone because of the horizontal alignment of the eyes. Considering the VSR, from Figure 1.5 it can be seen that the vertical angular extent projected in the closer eye is larger than that projected in the farther eye. There is empirical evidence that showed that differential perspective
is the consequence of perspective viewing) could be used to scale binocular disparities (e.g., Bradshaw, Glennerster & Rogers, 1996; Rogers & Bradshaw, 1995).
rity varies approximately linearly with eccentricity and its horizontal gradient decreases with observation distance, thereby explaining how such information may disambiguate the estimate of viewing distance (Gillam & Lawergren, 1983). However, this inform becomes significant in situations using large field of view and, therefore requires sufficiently large display (Bradshaw, Glennerster & Rogers, 1996).
Figure 1.5: This figure represents the horizontal size ratio (HSR) and vertical size ratio are the horizontal angles subtended by the patch for the left and right eyes. The horizontal size ratio (HSR) is defined as αL/αR. Angles βL and β
angles subtended by the surface patch. The vertical size ratio (VSR) is defined as left eye is closer to the surface than the right eye, then βL>β
The ability to estimate the viewing distance would thus be dependent on the
and on the size ratios of horizontal and vertical disparities but, other factors such as some The horizontal gradient of vertical disparity could also help observers to establish an estimate ; this is the variation of vertical . Vertical disparity exists because points that are not lying in the will be closer to one eye than the other, resulting in different vertical retinal projections in both eyes (Howard & Rogers, 1995). The horizontal size ratio (HSR) and the vertical size ratio (VSR) are represented for a surface patch in Figure 1.5. The considered alone because of the horizontal alignment of the eyes. Considering the VSR, from Figure 1.5 it can be seen that the vertical angular extent projected in the closer eye is larger than that projected in the farther that showed that differential perspective (i.e. the pattern of could be used to scale binocular disparities (e.g., Bradshaw, Glennerster & Rogers, 1996; Rogers & Bradshaw, 1995). Vertical rity varies approximately linearly with eccentricity and its horizontal gradient decreases with observation distance, thereby explaining how such information may disambiguate the However, this information becomes significant in situations using large field of view and, therefore requires sufficiently
Figure 1.5: This figure represents the horizontal size ratio (HSR) and vertical size ratio are the horizontal angles subtended by the patch for the left and right
βR are the vertical
angles subtended by the surface patch. The vertical size ratio (VSR) is defined as βL/βR. If the
βR.
The ability to estimate the viewing distance would thus be dependent on the actual vergence and on the size ratios of horizontal and vertical disparities but, other factors such as some
Vienne Cyril – Thèse de doctorat - 2013
cognitive pictorial cues (familiar size or perspective, O'Leary & Wallach, 1980) and the actual state of accommodation (Watt et al., 2005) could play a role. It is also possible that horizontal disparities become disambiguated by the presence of other cues, i.e., by combining disparities with other depth cues such as texture or motion parallax that scale differently with the viewing distance (Frisby, Buckley, Wishart, Porrill, Garding, & Mayhew, 1995; Johnston, Cumming, & Landy, 1994; Johnston, Cumming, & Parker, 1993; Richards, 1985).
1.1.6 Interactions between depth cues: brief overview
As we have seen in the preceding paragraphs, the visual world includes multiple sources of information and, therefore one question that was raised was: how do perceptual systems deal with this multiplicity? Generally, studies investigating how the visual system combines two or more sources of information present the studied cues both in isolation and in combination. For example, Künnapas (1968) showed that distance judgments were more consistent and accurate when several sources were present as compared to reduced cues situations. There have been several proposed schemes of integration and selection to account for the use of multiple cues in perceiving depth (Howard & Rogers, 1995; Massaro & Friedman, 1990; Bülthoff and Mallot, 1988). For instance, in Howard & Rogers (1995), five types of interaction are described: cue averaging and summation, cue dominance, cue dissociation, cue reinterpretation and cue disambiguation. Cue summation refers to the combination that provides an improvement in depth sensitivity; the more cues are present the better observers are able to perceive depth. Cue averaging reflects the propensity to cancel one depth effect (e.g., binocular disparity) by another opposite depth effect (e.g., motion parallax). Cue dominance is present when two cues are opposed (in conflict) and when one effect of the two is suppressed. Cue dissociation is an interaction where two cues are interpreted as coming from different objects. Cue reinterpretation may arise to resolve contradictory cues by reinterpreting the stimulus context. Finally, cue disambiguation is the case of interaction where one cue comes to disambiguate another. It is worth noting that most empirical studies approached depth cue combination on the basis of cue averaging and summation.
The model described hereunder is a cue combination example, perhaps the most general model of weighted combination (Landy, Maloney, Johnston & Young, 1995). The combination process is also called fusion, and can be modeled as “weak” or “strong” fusion (Clark & Yuille, 1990). Weak fusion is defined as a modular combination based on the computation of separate estimates of depth for each depth cue in isolation, and then averaging
the separate depth estimates so as to obtain an overall depth percept. The first major problem with weak fusion is that each depth cue is qualitatively distinct in nature and that all depth cues do not share the same unit. The second is that each depth cue does not confer the same reliability across the visual scene; the weak fusion should change the weights assigned to different cues to reflect their own reliability. Strong fusion refers to combination models in which depth cues estimates are not modular; there can be multiple non-linear interaction between depth cues and these interactions may not obey any rule. Strong fusion models become thus difficult to test because the essential distinction between cues necessary for experimental testing is rather tricky.
Considering the problems of both classes of fusion model, Landy et al. (1995) proposed the modified weak fusion model. In this model, the weak fusion is more flexible in the sense that additional interactions are now possible, such as the use of ancillary cues and the interaction type of “promotion” and “calibration”. Cue promotion is the way by which the conversion to common units is possible; this is the reaction to a second cue used to support the first cue. Cue calibration is described slightly differently in the way that the visual system would “learn” before providing the estimate. The linear combination is now performed on the basis of the weights of each involved cue, based on their reliability (Landy, Maloney, Johnston & Young 1995). This model of weighted average is based on the assumption that each single-cue estimate is unbiased but subject to independent Gaussian noise. The reliability of one single-cue is equal to the inverse of its estimated variance and the sum of the weights of each involved cue is equal to one (Landy, Maloney, Johnston & Young 1995). The reliability of a cue is thus lower with large variance and therefore such cue contributes less to the final estimate (Hillis, Watt, Landy & Banks, 2004, Landy, Maloney, Johnston & Young 1995). Cue weight depends on stimulus conditions and varies across observers. This model also integrates assumptions about prior knowledge to derive the rules applied to the weighted average (i.e., the depth maps) and cue promotion. Indeed, most sources of information cannot yield alone an accurate measure about depth information because they are either uncertain or ambiguous and, even though they may be disambiguated when considered together, experience that forms a priori knowledge can help explain how in some conditions (i.e., cue conflict) the percept can converge in a specific direction. In this model, Bayesian approaches thus permit the integration of prior knowledge into the estimation process (Mamassian, 2006). The Bayesian approach makes somewhat general predictions about the pattern of cue interaction encountered in case of novelty and, these predictions sometimes account for stimulus conditions (discrepant or contradictory sources of information) that may never occur in
Vienne Cyril – Thèse de doctorat - 2013
natural viewing conditions (Howard & Rogers, 1995). The Bayesian framework is however recognized by the scientific community as being an “elegant method” for explaining cue combination in intra- and extra-modality interaction.
1.1.7 Summary: from multiple cues to one percept
The visual perception of depth is the result of a complex process that can find its input among a vast flow of information called cues. Hence, numerous visual cues can contribute to depth perception. They can participate as independent sources of information or rather just to promote another cue. An example of promotion can be found in the combination of binocular disparity and motion information (Richards, 1985). Depth from disparity and depth from motion information scale differently with distance but can be combined together in order to recover correct 3D structure of the visual object. As a matter of fact, stereo cues are insufficient to provide an estimate of depth as the retinal projections can refer to various angular disparities that can be appreciated only once a fixation distance is estimated. In addition, structure-from-motion information cannot provide enough information for shape perception since each pattern of motion contains at least two possible interpretations due to stimulus reversibility. However, disparity can provide the sign to suppress reversibility and motion can yield the relation between the points to break the scaling distance dependency. Such theoretical considerations are supported by experimental evidence (i.e., Johnston, Cumming & Landy, 1994). Thus it seems that knowing what information is available for depth perception is not sufficient to explain how we can retrieve depth information but, knowing how these sources of information are combined to yield the final percept seems at least as important. It is possible that some of these important sources of information for depth perception can also be non-retinotopic, that is, they stem from the activity of the extra-ocular muscles. In line with this assertion, it is thus mandatory to understand how the physiological systems act in order to efficiently apprehend these significant sources of depth information. As a consequence, the next sub-section is devoted to the understanding of the oculomotor system and its implication in depth perception.
1.2 Physiology of depth perception
Depth perception is not just the outcome of information reaching retina’s receptors; it requires the response of each part of the oculomotor system. For any given visual stimulus, there is a potential response of the near oculomotor triad (Schor, 1986; Semmlow & Hung, 1983; Burian & VonNoorden, 1974): accommodation, vergence and pupil responses work together in order to provide the best possible sampling of the information from the world around us. The following part of this chapter is devoted to the understanding of the oculomotor dynamics; components of the oculomotor system, their typical responses, models and limits of those systems will be presented. It is important to note that vergence and accommodation systems both present the same classes of response: reflex, cross-link, proximal and tonic. The reflex component is a way by which the oculomotor system can provide a quick and sustrained response, the cross-links ensure that both accommodation and vergence react in the same way, the proximal enables the observer to implement cognitive aspects in the response (i.e., proximity) and, the tonic component is the minimal muscle innervation ensuring the minimal system tonus under conditions without stimulation. It is Maddox (1893) who proposed this breakdown in order to describe how the oculo-motor responses attain unity in spite of the multiple influences it undergoes.
1.2.1 The oculomotor system: elements and responses
1.2.1.1 The vergence system
Vergence eye movements belong to a particular category of binocular eye movements. These disjunctive eye movements consist in simultaneous inward rotation of both eyes around the vertical axis; both eyes performing rotation in order to bring the visual axes on the object of interest. More specifically, this is foveation, the focusing of the optical information onto the retina. The term vergence can be used either for the angular state taken by the gaze of the eyes as well as for describing binocular eye movements. These opposed eye movements aim at providing a clear and single vision when fixating an object. Horizontal vergence is involved when the observer’s eyes fixate a different distance – this is sometimes called convergent or divergent step as function of the sign of the change. Vergence is generally measured while visually stimulating with target vergence of disparity-steps, ramps or pursuit.
Vienne Cyril – Thèse de doctorat - 2013
Vergence eye movements stem from the activity of six extraocular muscles receiving innervations from three cranial nerves (the abducens nerve, the trochlear nerve and the oculomotor nerve). These muscles are fastened to the eye’s sclera on one side and are attached to the bony orbit of the eye on the other side. Through the control of the cranial lower motor neurons, contraction of the muscles produces movement of the eyes within the orbit. Horizontal vergence mainly commands the medial and lateral rectus that, when contracting either pulls the eye towards the nasal side or the temporal side as the result of the antagonistic muscular activity – the first muscle ought to relax whereas the antagonist contracts to perform horizontal eye movements.
Vergence response can be broken down into several components, such as the tonic component, the disparity component, the accommodative component and the proximal component. Different stimuli influence the overall response of the vergence system, namely: retinal disparity, accommodation change and target proximity.
The disparity component of vergence (reflex component) occurs when an observer changes fixation from object A to object B (i.e., fixation points P1 and P4 on Figure 1.3, respectively), i.e., two objects located on two different horopters that do not intersect in Panum’s fusional zone. For a long time, disparity vergence was called “fusional component” because of Maddox’ theory stating that diplopia was the vergence stimulus and that this mechanism aimed at restoring fusion (Maddox, 1893). Experimental evidences now strongly suggest that this component is driven by retinal disparity and, this is the reason why the name changed to “disparity vergence”. This disparity vergence component is also considered to be the outcome of two neural components: the fast preprogrammed transient component and the slow feedback-control sustained component (Semmlow, Yuan & Alvarez, 2002). This dual-mode behavior is supported by an experiment showing that ramp velocities less than 2 deg.s-1 provided smooth vergence response, ramp velocities greater than 9 deg.s-1 entailed step responses and, intermediate ramp velocities yielded step-ramp and multiple-step responses (Semmlow, Hung & Ciuffreda, 1986). These results suggest that the transient component aims at initiating vergence response and seems to be preprogrammed (inaccurate) and is a response of an open-loop system. This initial response is rather stable, certainly because no feedback intervenes. On the contrary, the sustained component is involved at the end of the movement and is responsible for maintaining fusion within Panum’s zone. These two components contribute to performing vergence response precisely whereas it remains a small constant fixation error called fixation disparity (Ogle, 1954).
Disparity vergence usually provides latency of about 100 to 200 ms. Several factors however exist that are involved and can change the temporal dynamics of this component, i.e., direction, initial starting position, age and predictability (Alvarez, Semmlow & Pedronoo, 2005; Heron, Charman, & Schor, 2001; Hung, Zhu, & Ciuffreda, 1997; Semmlow & Wetzel, 1979). For instance, convergence and divergence exhibit different temporal dynamics presumably because they use two different neural pathways (Hung, Zhu, & Ciuffreda, 1997). In laboratory, disparity vergence is measured through the use of pinholes or with stimuli that do not contain large spatial frequencies (e.g., difference of Gaussian), (Kotulak & Schor, 1987; Tsuetaki & Schor, 1987). Indeed, even though the disparity component of vergence seems to dominate the vergence response, the accommodative component (i.e. the crosslink component) is the potent secondary information for the vergence system (Semmlow & Wetzel, 1979). Accommodative vergence is specifically driven by the blur in the stimulus producing also accommodative responses. As a matter of fact, vergence movements can be observed consecutively to a change in blur stimulation whereas only one eye is stimulated (Hung, Semmlow & Ciuffreda, 1983). Accommodative vergence was however shown to be relatively slower than disparity vergence (Heron et al., 2001; Semmlow & Wetzel, 1979). Contrary to the reflex component and the crosslink component, proximal vergence is rather “cognitive”. This component is driven by stimuli that can be perceived as nearer or farther in absence of disparity or blur cues (Howard & Rogers, 1995). More specifically, proximal vergence reflects the influence of the perceived distance of the object of interest that is derived from various stimuli related to depth such as, relative size, linear perspective, occlusion, shading and texture gradient, as well as motion parallax, looming and motion in depth (Schor et al., 1992). However, it is important to note that the sensitivity of vergence to these categories of stimuli (also called “spatiotopic”) is generally lower compared to retinotopic stimuli (disparity and blur).
Tonic vergence reflects the minimal innervation of the extra-ocular muscles; this is the state of vergence in the dark or its propensity to return back to this state – also called dark vergence (Howard & Rogers, 1995). This is roughly the mechanism by which the transition from anatomical resting (relaxed muscle state) to physiological resting states (innervated muscle state) is possible. The distance for dark vergence is between 0.62 and 5 m with a mean value of about 1.2 m (Owens & Leibowitz, 1980).
Other authors dissociated voluntary vergence from proximal vergence and, also added the component of “vergence adaptation” to the list of vergence components (i.e., Daum &