This is an author-deposited version published in :
http://oatao.univ-toulouse.fr/
Eprints ID : 9101
To link to this article : DOI:10.1021/am3019405
URL :
http://dx.doi.org/10.1021/am3019405
O
pen
A
rchive
T
OULOUSE
A
rchive
O
uverte (
OATAO
)
OATAO is an open access repository that collects the work of Toulouse researchers and
makes it freely available over the web where possible.
To cite this version :
Kwon, Jinhee and Ducéré, Jean Marie and Alphonse, Pierre and
Bahrami, Mehdi and Petrantoni, Marine and Veyan, Jean-Francois
and Tenailleau, Christophe and Estève, Alain and Rossi, Carole
and Chabal, Yves J.
Interfacial Chemistry in Al/CuO Reactive
Nanomaterial and Its Role in Exothermic Reaction.
(2013) ACS
Applied Materials & Interfaces, vol. 5 (n° 3). pp. 605-613. ISSN
1944-8244
Any correspondence concerning this service should be sent to the repository
administrator:
[email protected]
Interfacial Chemistry in Al/CuO Reactive Nanomaterial and Its Role in
Exothermic Reaction
Jinhee Kwon,
†Jean Marie Ducéré,
‡,§Pierre Alphonse,
∥Mehdi Bahrami,
‡,§Marine Petrantoni,
‡,§Jean-Francois Veyan,
†Christophe Tenailleau,
∥Alain Estève,
‡,§Carole Rossi,*
,‡,§and Yves J. Chabal
† †Department of Materials Science and Engineering, the University of Texas at Dallas, Richardson, Texas 75080, United States
‡
CNRS, LAAS 7 Avenue du colonel Roche, F-31077 Toulouse, France
§
Université de Toulouse, UPS, INSA, INP, ISAE, LAAS ; F-31062 Toulouse, France
∥
CIRIMAT, 118 route de Narbonne, F-31077 Toulouse, France
ABSTRACT: Interface layers between reactive and energetic materials in nanolaminates or nanoenergetic materials are believed to play a crucial role in the properties of nanoenergetic systems. Typically, in the case of Metastable Interstitial Composite nanolaminates, the interface layer between the metal and oxide controls the onset reaction temperature, reaction kinetics, and stability at low temperature. So far, the formation of these interfacial layers is not well understood for lack of in situ characterization, leading to a poor control of important properties. We have combined in situ infrared spectroscopy and ex situ X-ray photoelectron
spectroscopy, differential scanning calorimetry, and high resolution transmission electron microscopy, in conjunction with first-principles calculations to identify the stable configurations that can occur at the interface and determine the kinetic barriers for their formation. We find that (i) an interface layer formed during physical deposition of aluminum is composed of a mixture of Cu, O, and Al through Al penetration into CuO and constitutes a poor diffusion barrier (i.e., with spurious exothermic reactions at lower temperature), and in contrast, (ii) atomic layer deposition (ALD) of alumina layers using trimethylaluminum (TMA) produces a conformal coating that effectively prevents Al diffusion even for ultrathin layer thicknesses (∼0.5 nm), resulting in better stability at low temperature and reduced reactivity. Importantly, the initial reaction of TMA with CuO leads to the extraction of oxygen from CuO to form an amorphous interfacial layer that is an important component for superior protection properties of the interface and is responsible for the high system stability. Thus, while Al e-beam evaporation and ALD growth of an alumina layer on CuO both lead to CuO reduction, the mechanism for oxygen removal is different, directly affecting the resistance to Al diffusion. This work reveals that it is the nature of the monolayer interface between CuO and alumina/Al rather than the thickness of the alumina layer that controls the kinetics of Al diffusion, underscoring the importance of the chemical bonding at the interface in these energetic materials.
KEYWORDS: reactive nanostructured materials, reactive nanolaminates, nanocomposite, nanoenergetic materials, nanothermite, Al/CuO, atomic layer deposition, ultrathin conformal diffusion layer
1. INTRODUCTION
Reactive nanostructured materials including nanocomposite, based on exothermic thermite reactions, have attracted great interest in the last two decades. Different types of reactive nanocomposites have been synthesized, such as mixed nanopowders,1−4 nanostructured composites,5−12 multilayer nanolaminates,13−16 and dense nanocomposite powders produced by arrested milling.17−21 Whatever the synthesis method and reactive materials types (bimetallics, metal/oxide composites), the main research focus has been to increase the interface area where the exothermic reaction between reactants occurs. For reactant size below 100 nm, the ratio between the bulk reactive reservoir and the interfacial layers is such that the interface zone becomes dominant, thus governing the proper-ties of the overall reactive materials.22Today, the fundamental
issue that limits the control of all reactive nanomaterials and nanocomposites is the lack of understanding of the interface chemistry and associated reaction mechanisms.
Among several types of reactive nanocomposites, Al/CuO bilayer nanofoils represent a good model system to study reactive interfaces: they are composed of a nanolayer of Al (fuel) and a nanolayer of CuO (oxidizer) deposited by physical deposition methods providing a good control over thickness and purity. The Al + CuO reaction is among the most exothermic thermite reactions with a maximum theoretical heat of reaction of 3.9 kJ/g that can be released within a fraction of a
second. Al/CuOx multilayer nanofoils have been already synthesized and characterized.13,16,23−26 During material deposition, chemical intermixing naturally occurs at the interface between the two reactive layers, resulting in a relatively thick interfacial layer (∼nm). An understanding of the chemistry that controls the interface formation between the two reactive materials, which is still missing, would represent a step forward to control the response of reactive nano-composites. This includes the characterization of the formation of the interface as a function of deposition conditions, associated atomic arrangements, and subsequent effects on the material properties.
In this paper, we address the interface formation in Al/CuO nanocomposites and concentrate our effort on the interface generated upon Al deposition onto CuO. We assess how the chemical nature of the interface impacts the exothermic response, by varying the deposition techniques, thus authoriz-ing downscalauthoriz-ing of the interface thickness, and exhibitauthoriz-ing different deposition chemistry. Specifically, we aim at engineer-ing alumina-based interfaces through atomic layer deposition (ALD) and e-beam evaporation; sputtering deposition is used to deposit CuO and pure Al, forming both reactive layers: CuO and Al. For the first time, we propose the combination of spectroscopy (in situ infrared absorption spectroscopy, ex situ X-ray photoelectron spectroscopy) and imaging (high reso-lution transmission electron microscopy) with first-principles density functional theory (DFT) calculations in order to probe atomic scale mechanisms taking place during interface formation.
In the first part of the work, we investigate the interface formation during Al evaporation on CuO layer as a method to elucidate basic chemical processes arising in usual physical vapor deposition (PVD) procedures. We find that the near surface region of CuO is reduced upon the Al atoms deposition. This interface region is inhomogeneous with irregular thickness of about a 5 nm maximum due to an intermixing of elements at the rough CuO surface region. It is composed of a mixture of Al, Cu, and O probably with a high density of defects, providing high reactivity as seen in the thermal response measured by differential scanning calorimetry (DSC).
In the second part of the work, we explore atomic layer deposition (ALD) of ultrathin aluminum oxide prior to Al physical deposition (sputtering) as a means to provide a conformal and stable diffusion barrier between the two reactive layers Al and CuO. Besides being conformal, the resulting ALD-produced interface is expected to be drastically different from the interface obtained by the PVD technique, as the incoming Al species are CH3decorated, thus exhibiting a totally different chemistry on the surface. Thermal characterization shows that the presence of this alumina layer greatly reduces the system reactivity. ALD alumina layers as thin as 0.5 nm appear to offer a barrier layer impacting long range diffusion of Al, Cu, and O atoms enabling material ignition.
Surprisingly, we find that the reactivity properties do not depend on the thickness of Al2O3(in the range of 0.5−2.4 nm). For very thin Al2O3 layer, the stoichiometry can be slightly different but we will use Al2O3 for simplicity. Instead, the composition and conformal coverage of the initial few Al2O3 monolayers on CuO are essential to provide thermal stability to the system.
2. EXPERIMENTAL METHODS
2.1. Sample Preparation. Al/CuO bilayers are magnetron sputter deposited from Al and Cu targets using DC power, on oxidized N type (100) double-side polished silicon. Before deposition, wafers are rinsed in deionized water and dried in a nitrogen gas stream. The temperature of the substrate is chilled to stay at 10°C during sputter deposition. The base pressure of the chamber is less than 10−5Pa.
CuO is deposited by dc reactive magnetron sputtering of a Cu target (purity >99.999%) under argon and oxygen plasma at 400 W. During deposition, the oxygen partial pressure is maintained at 0.13 Pa. Al is deposited by the same method with an Al target (purity >99.999%) under argon plasma at 800 W. The successive deposition of CuO and Al is carried out without venting the chamber. The chamber is fully pumped out after each cycle (Al or CuO deposition) to prevent cross contamination and aluminum oxidation by residue oxygen during Al deposition. Each layer is 100 nm thick and under low stress (stress <30 MPa). The roughness of the sputter deposited CuO measured by optic profilometry is 15 nm, which is substantially higher than that of the original Si surface.
Another set of samples is prepared with ultrathin Al2O3interface
between Al and CuO (Al/Al2O3/CuO). Al2O3is deposited by atomic
layer deposition (ALD) on CuO at 120°C with alternating pulses of trimethylaluminum (TMA) (2 seconds) and deuterated water (D2O)
(0.5 second) separated by 10 min N2 purge.27 After each precursor
exposure, in situ infrared absorbance spectroscopy is carried out to probe the surface chemical reactions.
2.2. Characterization Methods. During ALD of Al2O3, surface
chemical reactions between the precursors and CuO are analyzed by in situ Fourier transform infrared spectroscopy (FTIR) using a Thermo Nicolet 6700 Interferometer. The morphology of films and interfaces is examined using high resolution transmission electron microscopy (HR-TEM). Cross-sectional (X-TEM) transmission electron micros-copy samples are prepared using standard procedures and are imaged in either (i) a field emission TEM, FEI Tecnai F20 microscope, equipped with a corrector for spherical aberration and operating at 200 kV or (ii) a field emission JEOL JEM 2100 microscope operating at 200 kV. The roughness of sputter-deposited CuO is measured using optical profilometry with a WYKO NT3300 equipment from VEECO. The PSI (phase shifting interferometry) mode is used for the measurements. The crystalline composition is determined by X-ray diffraction (XRD) using a Bruker D5000 diffractometer operating with K-alpha radiation (40 kV, 40 mA) and with 2-Theta varying from 20 to 80° (24 s/0.03°). Spectroscopic ellipsometry measurements are done on a Horiba Jobin Yvon UVISEL ER with a spectral range between 190 and 2100 nm. X-ray photoelectron spectroscopy (XPS) (PHI 5600) with a monochromatized Al Kα line (1486.5 eV) is used to examine chemical states of the interface after deposition of Al or Al2O3. Reactions occurring in the Al/CuO bilayers during slow heating
are characterized by differential scanning calorimetry (DSC) in Mettler-Toledo equipment under a nitrogen flow (99.999%). Samples are placed in a platinum crucible and then heated at constant rate (10 K/min) from 30 °C to 700 °C. The samples are weighted before and after the DSC run. After the initial heating cycle, each sample is cooled down to room temperature and then heated again at the same heating rate to obtain a baseline for the measurement. It is assumed that the bulk heat capacitance of the sample does not change between the first and the second heating cycles.
2.3. Theoretical Methods. The TMA adsorption and decom-position reactions on CuO are calculated using the Turbomole 5.9 package28within the frame of density functional theory (DFT) using the GGA functional of Perdew, Burke, and Ernzerhof,29 the atom-centered def2-TZVP basis set,30 and the corresponding auxiliary basis31for the Resolution of the Identity approximation.32,33Copper oxide is modelled by a Cu18O18cluster cut so that the (11-1) surface is
exposed. The CuO (11-1) orientation is chosen as it has been observed experimentally in earlier work by the authors.41In order to recover long range electrostatic interactions, the cluster is embedded in a set of 1284 point-charges (+1 or −1) located at atomic positions. As pointed by Melle-Franco,34each positive point-charge of the first shell
is augmented by a pseudo-potential to avoid the polarization of peripheral oxygen anions.
The atomic aluminum deposition and migration reactions on copper oxide are calculated using the periodic DFT code VASP in its 5.2 version35,36 using the PBE functional.37 The one-electron wave-functions describing the valence are expanded over a planewave basis set with a cut-off energy of 400 eV, and the core is described using the Projector Augmented Wave method.38,39The Brillouin zone sampling is performed at the Γ point. In order to properly describe the semiconductor and antiferromagnetic behaviors of CuO, the Dudarev’s LDA+U approach40 is used with a U-J value of 7 eV for Cu. The surface was represented by a slab model composed of 6 layers of 16 Cu and 12 layers of 8 O.
3. RESULTS
3.1. Nature of the Sputter-Deposited Copper Oxide Thin Film. After CuO sputter deposition, the resulting copper oxide layer is analyzed by XRD (Figure 1a) and IR absorption
spectroscopy (Figure 1b). Cupric oxide, CuO, diffraction lines can clearly be seen in the XRD pattern. The infrared absorbance spectrum in Figure 1b also confirms copper(II) oxide as evidenced by modes at 507, 517, and 590 cm−1 characteristic of CuO.16 There is notably no evidence for copper(I) oxide (cuprous oxide, Cu2O), characterized by an absorption band at 623 cm−1.42
The thermal stability of CuO is studied by annealing 100 nm CuO samples at 100, 150, 200, and 300 °C for 60 minutes in N2ambient. The objective here is to determine the maximum temperature the CuO film can be subjected to without being reduced especially when depositing the alumina ALD barrier layer.
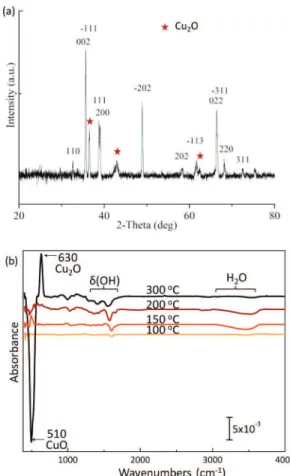
Below 200 °C, there is no reduction of CuO. The XRD pattern in Figure 2a confirms the presence of Cu2O after a
thermal treatment at 300 °C. Figure 2b shows the differential FTIR absorbance spectra of CuO measured after annealing at each temperature. At lower temperature (100, 150, and 200 °C), only desorption of physisorbed water is noticeable, but at 300 °C, the dramatic loss of the mode around 510 cm−1, characteristic of copper II oxide (CuO), and the increase of the mode around 630 cm−1indicate that the cupric oxide (CuO) is reduced into cuprous oxide (Cu2O). Lee et al43have published that CuO starts to form Cu2O at around 200°C under vacuum annealing.
The CuO thickness dispersion is lower than 5 % over the 4 in. wafer surface. The HR-TEM micrograph in Figure 3 shows that CuO is columnar and very rough. According to optical profilometry measurements, the roughness of CuO is 15 nm on
Figure 1. (a) XRD pattern of 100 nm thick CuO after sputter deposition. (b) Infrared absorbance spectrum of 100 nm thick CuO after sputter deposition referenced to the initial Si substrate.
Figure 2.(a) XRD pattern of 100 nm thick CuO after annealing at 300 °C. (b) FTIR differential absorbance spectra of 100 nm thick CuO after annealing at 100, 150, 200, and 300 °C for 60 min referenced to each previous annealing process.
Figure 3. Cross-section HR-TEM image of 100 nm CuO film after sputter deposition (substrate is silicon).
average. The columnar structure of the CuO film is due to the reactive sputtering deposition conditions. The substrate temperature is low relative to the CuO melting point (1320 °C). The structure of vapor deposited films grown under these conditions consists typically of a columnar growth structure, defined by voided open boundaries, which is superimposed on a microstructure which may be polycrystalline.44
3.2. Structure of the Interfacial Layer and Nature of the Initial 1−5 Å Thick Layer above CuO upon Al Deposition. The HR-TEM image in Figure 4 shows that the
interface formed during aluminum sputter deposition on CuO is overall ill-defined, most likely composed of Al, Cu, and O mixtures. This interface is irregular in thickness (see Figure 4 left) with regions of negligible thickness and regions as thick as ∼5 nm (see Figure 4 right). This interfacial region is inhomogeneous because it is difficult to obtain a conformal interface on the highly textured and irregular CuO surface.
In order to further characterize the interface region, a very thin layer of Al (2 monolayers (ML) ∼0.5 nm) is deposited on a CuO surface prior XPS analyses. Aluminum atoms are directly evaporated on sputtered CuO thin film with a gentler method to provide a good control of the thickness. Al is e-beam evaporated under high vacuum (10−9Torr) and at very low rate (0.5A/min) to get only 2 atomic layers of Al (2ML). The temperature of the substrate is not precisely controlled, but a thermocouple placed near the substrate does not exceed 50 °C. After the Al e-beam evaporation, ex-situ XPS analysis of Cu gave the red curve of the Figure 5 diagram. Figure 5 shows the Cu 2p core level of CuO (black) and spectra after ∼2 ML of Al deposition (red). As-deposited, CuO has a characteristic Cu2+ 2p3/2 binding energy at 933.5 eV separated from Cu2+2p1/2 by 19.9 eV with its satellites at higher binding energies. The shift of the Cu 2p toward a lower binding energy after Al deposition indicates that CuO (Cu (II)) is reduced to Cu2O (Cu (I)). The underlying CuO is still visible because the top Al or Al2O3layers (oxidation due to sample transfer from e-beam chamber to XPS equipment) are thin enough for X-ray penetration. The two dotted lines in Figure 5 show that the satellite peaks of the bulk CuO (i.e., not the interface) are not shifted after the deposition of Al. XPS analysis of O is less relevant because being ex-situ, all Al is oxidized.
3.3. Deposition of a Nanocontrolled Alumina Layer by ALD as Interface of Al−CuO Nanolaminates. In order to control the composition, thickness, and conformality of the interface between Al and CuO, a thin Al2O3 barrier layer is deposited on CuO using ALD with TMA and water. For very
thin layer, the stoichiometry can be slightly different but we will use Al2O3for simplicity.
Figure 6a shows the differential infrared absorbance spectra of CuO exposed to alternative TMA and D2O pulses during
Figure 4.HR-TEM images of the interface between sputter-deposited Al and CuO.
Figure 5.XPS Cu 2p spectra of CuO (black), after 2 ALD cycles with TMA and water (blue), and e-beam evaporated 2 monolayer of Al (red). The two dotted lines at 943.7 and 962 eV show the satellite peaks of Cu (II) of the underlying CuO.
Figure 6. (a) Differential infrared absorbance spectra of CuO after alternative TMA and D2O exposures up to 2 ALD cycles at 120 °C;
ALD cycles referenced to each previous treatment. A loss in intensity in the region of 550−610 cm−1after the first TMA exposure is attributed to the disruption of the CuO phonons due to strong chemical reactions between TMA and the surface. The dramatic loss of CuO phonon modes is observed only after the first TMA exposure, suggesting that the surface reaction between CuO and TMA reaches saturation after the very first TMA exposure. There is a significant increase of Al−O stretching mode intensity at 600−1000 cm−1together with the intensity of the modes at 580 and 530 cm−1. It is postulated that the CuO substrate partially contributes to Al oxidation, i.e., acts as an oxygen source by being reduced. The ligand exchange observed in Al−(CH3)2at 1205 cm−1during subsequent D2O exposure suggests that the normal ALD process takes place after this initial reaction, allowing further growth of Al2O3. The mode at 1567 cm−1is assigned to the methoxy CH
3scissoring (Al−O−CH3), indicating that the oxygen from the CuO substrate not only oxidizes Al to form Al−O bonds but also is inserted between Al and C bonds of the TMA molecule on the surface.
The HR-TEM image in Figure 6b shows the conformal deposition of 5 nm of Al2O3after 20 ALD cycles on the porous CuO layer. The thickness is larger than that of Al2O3typically deposited on smooth surfaces after 20 cycles of ALD. This may be partly because of the presence of physisorbed water in high-aspect ratio pores reacting with TMA, but the main contribution to this higher thickness is due to the strong surface reaction of the very first TMA pulse with the CuO substrate, which causes the reduction of Cu(II) to Cu(I) oxides, as discussed later.
In Figure 5, the blue curve shows the Cu 2p core level of 2 ALD cycles with TMA and water in comparison with CuO (black) after sputtering. The shift of Cu 2p toward a lower binding energy at 932 6 eV after Al2O3deposition indicates that CuO (Cu (II)) is reduced to Cu2O (Cu (I)). As already mentioned, the reduction of CuO is also observed after Al deposition via e-beam evaporation as shown in Figure 5 (red). The Cu1+ 2p3/2 peak after Al evaporation is even at lower energy (932 eV) than that for Al2O3, signifying that the detailed atomic environment of Cu is different due to different reduction mechanisms during e-beam evaporation of Al and ALD of Al2O3.
3.4. Thermal Characterization and Influence of the Interface Layer on the Al/CuO Nanolaminate Reactivity. To evaluate the effect of the interface layer in the Al/CuO reactive bilayer, DSC measurements are performed. The comparative results of thermal decomposition of bilayers with and without Al2O3diffusion barriers are presented in Figure 7. The DSC spectra of three different thicknesses of Al2O3layers (estimated at 0.5 nm (2 ALD cycles), 2.4 nm +/− 0.5 nm (10 ALD cycles) are compared with sputter-deposited CuO/Al with a native intermixed interface layer. All the data are baseline-corrected by subtracting the DSC signal recorded for the second heating of the sample. Each type of samples has been characterized 5 times with a good reproducibility of the exothermic features, onset temperature, and trace slope and shape. All materials release heat upon thermal actuation, but the DSC traces reveal that the exothermic behavior of the sample with intermixed Al−Cu−O interfaces is different from the samples with ALD Al2O3interfaces.
For the sputter-deposited Al/CuO samples with an intermixed Al−Cu−O interface, the main exothermic peaks are observed at 530 °C (onset is at 515 °C) and 400 °C (onset
is at 375 °C); minor exothermic peaks are also observed at 150 and 315 °C. These low temperature weakly exothermic peaks are not expected to play a major role in the ignition process. They may be due to recrystallization of the native Al−Cu−O interface or low temperature oxido-reduction reaction. Umbrajkar et al.45 and Ermoline et al.46 have proposed that
Cabrera-Mott kinetics describes the low temperature redox reaction (from ambient to 327 °C) in fully dense Al/CuO nanocomposite. The main exothermic peak onset temperature is obtained at 515 °C which is consistent with previous published results. In ref 16, Petrantoni et al. have measured a main exothermic peak onset temperature of 520 °C for Al/ CuO multilayer nanofoils (100 nm/100 nm).
We note that minor low temperature exotherms do not occur for samples with a thin ALD−Al2O3interface layer. For the Al/ Al2O3−2.4 nm/CuO samples, the broad exothermic peak has been shifted around 570 °C but the reaction process seems to start between 350 and 400 °C. The reaction slope of samples, having a thin Al2O3layer as interface, is more gentle than for CuO samples with direct sputter-deposited Al.
The thickness of the alumina layer does not influence so much the reactivity, suggesting that the nature of the layer in the initial few monolayers (estimated at 0.5 nm) is more important for controlling the onset temperature than its thickness. To check this point, let us focus now on bilayers of CuO/Al integrating ultrathin Al2O3ALD layers characterized by DSC under the same conditions. The Al2O3is obtained after 2 ALD cycles with TMA and D2O, and its thickness is estimated at 5 Å. The CuO/Al2O3−0.5 nm/Al sample has the same behavior as those with thicker Al2O3, proving that, as thin as 0.5 nm, Al2O3acts as a barrier layer. The composition and conformal coverage of the initial few Al2O3 monolayers on CuO seems to play a great role for interdiffusion, hence the best thermal stability of the system. The discontinuity at 270 °C for the 2.4 nm alumina layer sample is caused by a mechanical shock during experimentation and can be ignored.
4. DISCUSSION
4.1. Formation, Chemistry, and Structure of Al−CuO Interface Generated upon Al Deposition onto CuO. As preliminarily introduced in a preceding theoretical work,47we
Figure 7.Differential scanning calorimetry curves of Al/CuO bilayers with and without Al2O3 diffusion barriers performed at 10 K/min
identify the stable configurations that can occur at the CuO surface upon Al deposition and determine the kinetic barriers for their formation thanks to DFT calculations. The energetics associated with the adsorption and penetration of isolated Al atoms into CuO are summarized in Figure 8. As pointed out in
ref 47, the surface amorphization of the substrate upon Al exposure makes it difficult to evaluate overall energetics and associated activation barriers and also to give a definitive answer on how the system is organized at higher Al coverages. However, we present here refined values and additional material concerning the subsurface Al penetration path.
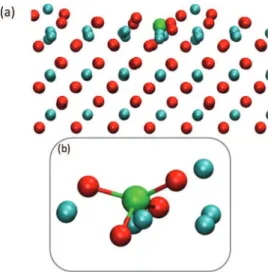
During the initial growth stage, diffusion of Al atoms into the subsurface is favored as evidenced by the large energy gained during adsorption (5.05 eV) compared with the activation barrier required for further Al incorporation underneath the oxygen surface layer, 0.82 eV, as estimated from a “drag method” procedure; i.e., the incoming Al atom is pushed step by step (roughly 0.1 Å step) towards the surface. At each step, the Al coordinate normal to the surface is frozen, while all other degrees of freedom are free to relax. This procedure is applied until the barrier value is reached; then, a global relaxation is performed to obtain another energy minimum. The overall chemical pathway for this subsurface penetration is exothermic (−2.71 eV gain) while further penetration into the bulk is slightly endothermic. Notably, this subsurface incorporation is accompanied by a dramatic long-range surface amorphization process (see Figure 9a) in which oxygen atoms in the vicinity are attracted towards the incoming aluminum atoms according to a typical oxido-reduction process. Interestingly, the oxygen atoms around the inserted Al atom rearrange themselves into a distorted (flattened) tetrahedral structure making the Al atom four-fold coordinated (see Figure 9b). During this initial step, the diffused Al atom occupies a site within the surface copper layer. In turn, upon amorphization, one copper atom is ejected onto the outer surface and partially mixed with the surface oxygen layer (see Figure 9a).
After this first incorporation step, the “drag method” proves to be unable to locate deeper minima, the energy increasing up to prohibitive values (Ebarrier> 6 eV). This is likely due to the complexity of the pathways that requires concerted and collective long-range displacements for copper atom to be ejected to fill the vacancy left in the first copper layer. In order to circumvent this issue, we abandoned the “drag method” and
placed the Al atom “by hand” in the nonamorphized surface, close to some ideal positions: in the middle of the first (to be distinguished from the surface oxygen layer) and second oxygen double layer and in the copper layers. The energies of these structures are displayed on the right side of the dashed line in Figure 8.
We observe that the interstitial position of the Al atom inside the first O double-layer is less energetically favorable than the substitutional position inside the first Cu layer by ∼1.58 eV above. The two substitutional positions in the 2nd and 3rd Cu layers have similar energies (0.73 and 0.70 eV above the substitutional position in the 1st copper layer) and similar structures with a Cu atom ejected toward the surface. Therefore, the limiting step for Al penetration is the crossing of the oxygen double-layers where metastable states can be obtained. Therefore, from this preliminary investigation, there is no evidence of aluminum penetration beyond the first subsurface layer; however, the amorphization process and the effect of multiple aluminum atoms penetrating into the subsurface should dramatically impact the first oxygen double layer structure, thus lowering the presented barrier for further aluminum penetration.
Overall, calculations show that incorporation of Al at the initial deposition stage induces intermixing of Cu and O layers, which leads to amorphization and local Cu reduction by the incoming Al atom at the surface/interface, consistent with experimental findings of both CuO reduction and oxidation and Al. Subsequent incorporation of an Al atom on the amorphized structure, where a first Al atom is already incorporated in the subsurface layer, still needs to be detailed but at the price of severe technical difficulties.
4.2. Formation, Chemistry, and Structure of Interface Generated upon TMA Surface Reactions with CuO during ALD of Al2O3. DFT calculations of the adsorption and reaction mechanism of TMA on CuO are explored theoretically. First, TMA preferably adsorbs on top of a three-coordinated oxygen atom (Figure 10) with an energy gain of 1.38 eV. This results in the formation of Al−O bond (dAl−O= 1.86 Å). This adsorption considerably affects the initial TMA symmetry, giving rise to an umbrella structure attached to the surface via a CH3−Cu bond (dCu−C = 2.19 Å) that, in turn, weakens its attachment to the metallic precursor center (dAl−C
Figure 8.Energetics of Al diffusion into the CuO(11-1) surface. The initial diffusion is determined using a drag method (left of the dashed line). Further Al diffusion is determined by placing the Al atom in substitutional or interstitial positions in second and third Cu/O layers and relaxing the geometry without constraint (right of the dashed line, see ref 47 for an atomistic viewgraph).
Figure 9.(a) Amorphization process upon Al subsurface penetration (Al in green, Cu in blue, and O in red). (b) Zoom around the Al site revealing the tetrahedral AlO4structure.
= 2.22 Å instead of 1.97 Å in free TMA). This process is followed by a quasi-barrierless (∼0.16 eV barrier) dissociation of the complex, leaving a methyl group on the surface (see Figure 10). This allows the overall system to gain an additional 1.04 eV of energy. Furthermore, migration of the methyl group on the surface is expected since its lower energy state is found when C is attached to surface oxygen atoms (0.87 eV of energy gain compared to CH3 attached to Cu), the migration activation energy being as low as 0.46 eV. Therefore, methyl groups can move easily on the surface until they meet each other, leading to the formation of ethane (C2H6), which allows desorption of the surface C contamination and leads to a reduction of the surface as a previously anionic CH3 species leaves as neutral. This reaction is exothermic when both CH3 groups are on copper (ΔE = −1.34 eV), slightly exothermic when one CH3group is on Cu and the other one on O (ΔE = −0.47 eV), but slightly endothermic when both CH3groups are on O (ΔE = 0.4 eV). This is in contrast to what is observed in the conventional ALD processes on Si surfaces where CH3is immobilized once it is attached to Si atoms. Another potential desorption pathway for methyl groups involves surface oxygen atoms, where two methyl groups would recombine to form dimethyl ether (CH3OCH3). This process is slightly endothermic when one CH3 group is on Cu and the other one is on O (ΔE = 0.39 eV) or endothermic when both CH3 groups are on O (ΔE = 1.26 eV). This reaction would lead to a larger reduction of the surface than the previous one as two CH3groups and one O atom are lost. Even though CH3OCH3 formation is unlikely because it is endothermic, the low pressure during the ALD process makes it irreversible once it occurs.
Another source of surface oxygen reduction is also considered and shown to be a crucial step to the initial deposition regime as prefigured in experimental character-ization findings. Further dissociation of the TMA surface complex on CuO is found to be endothermic (by 0.31 and 1.90 eV for the loss of the second and third TMA methyl groups, respectively). The presence of the methyl ligands is essential to determine the interface composition by stabilizing Al atoms onto the CuO surface until the oxidative water ALD pulse arrives. This situation is in contrast with Al sputter deposition described above, where Al penetration into CuO is observed. Importantly, we find that the surface Al(CH3)2complex is able to extract an O atom from CuO (see Figure 11). In this process, the extracted oxygen is inserted into Al−C bond leading to the formation of a methoxy group bridging between Al and Cu. The methoxy formation through O extraction is largely exothermic (0.92 eV), though the energy barrier appears relatively high (1.64 eV). It is kinetically more unfavorable to extract the second O atom from the surface for insertion into the remaining Al−C bond (double barrier, 0.05 and 1.94 eV),
though the overall process is exothermic by 1.39 eV. It is noteworthy that similar reduction processes of substrate oxides are found with ALD of high-k oxides on III−V surfaces.48−50
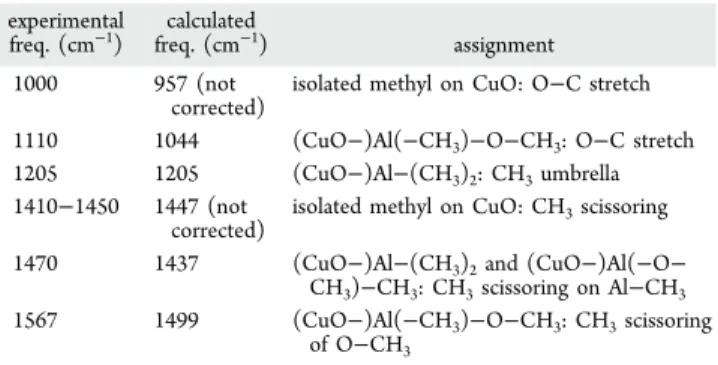
The infrared absorption spectra observed in Figure 6a are assigned using DFT calculations, highlighting the consistency between the surface chemistry described by DFT and the experimental data. The umbrella mode of CH3of Al−(CH3)2at 1205 cm−1, the most prominent surface ligand showing the ALD process (Figure 6a), is taken as the reference for correcting calculated frequencies through simple linear scaling factors for other surface TMA-based structures such as decomposed TMA (CuO−)Al(CH3)2 and partially oxidized surface complex (CuO−)Al−[(−CH3)(−O−CH3)]. This allows further assignment of other peaks, as summarized in Table 1.
The CH3rocking combined with the O−C stretching modes of M−O−CH3(M = Al or Cu) is observed at (i) 1000 cm−1for methyl directly adsorbed on the CuO substrate (i.e., top of an O atom bonded to Cu) (DFT value at 957 cm−1 without correction) and (ii) 1110 cm‑1 for O−CH
3 attached to Al (DFT value at 1044 cm−1). The reduction of CuO through oxidation of chemisorbed TMA is also observed in the region of 1400−1600 cm−1(see Table 1). According to calculations, the band around 1410−1450 cm−1is attributed to the CH
3scissor modes of isolated methyl groups (DFT value at 1447 cm−1). The experimental mode at 1470 cm−1should be assigned to decomposed TMA (CuO−Al−CH3, DFT value at 1437 cm−1). Especially, the band at 1567 cm−1(DFT value at 1499 cm−1) corresponds to a CH3 scissor mode. It is shifted toward the higher frequency due to O insertion between Al−C atoms (Al− O−CH3), confirming the further reduction of CuO through the TMA surface reaction.
Figure 10.Dissociative chemisorption process of TMA reacting with CuO(11-1) surface.
Figure 11. CuO reduction mechanism induced by the decomposed TMA surface complex. An oxygen atom from the CuO substrate is extracted and inserted into the Al−C bond.
Table 1. Experimental Infrared Absorbance Peaks and Their Assignation through DFT Calculationsa
experimental
freq. (cm−1) freq. (cmcalculated−1) assignment
1000 957 (not
corrected) isolated methyl on CuO: O−C stretch 1110 1044 (CuO−)Al(−CH3)−O−CH3: O−C stretch
1205 1205 (CuO−)Al−(CH3)2: CH3umbrella
1410−1450 1447 (not
corrected) isolated methyl on CuO: CH3scissoring 1470 1437 (CuO−)Al−(CH3)2and (CuO−)Al(−O−
CH3)−CH3: CH3scissoring on Al−CH3
1567 1499 (CuO−)Al(−CH3)−O−CH3: CH3scissoring
of O−CH3
aThe calculated values are scaled according to the CH
3umbrella mode
The mechanisms of interface formation are further derived through complementary theoretical and experimental data that are consistent with each other. The deposition of isolated Al atoms on CuO surfaces leads to an amorphization of the surface/interface via the insertion of Al atoms into substitu-tional Cu sites, resulting in a mixed interface composed of Al, Cu, and O. The massive rearrangement of oxygen atoms around aluminum atoms confirms the CuO reduction observed experimentally. In contrast, the first TMA semicycle surface reaction during ALD forms a smooth and conformal partially oxidized Al monolayer. First, the incomplete decomposition of TMA hinders further penetration of Al atoms into CuO, preventing intermixing as observed in the case of atomic Al deposition on CuO. Additionally, the CuO substrate acts as an oxygen donor, thus oxidizing the TMA surface complex. This is contrary to the typical ALD process of classical systems such as TMA surface reactions with silicon dioxide where aluminum oxide grows without perturbing the initial substrate, but there is indeed much similarity with ALD of high-k oxide on III−V substrates, where reduction of the substrate oxide is observed.51,52
The oxygen reduction processes of CuO are different between Al sputter-deposition and ALD of alumina-based interface on CuO. Therefore, the resulting interfaces are different in composition, leading to different thermal behavior in the DSC experiments. Besides the different atomic arrangement at the interface, the ALD process gives rise to a conformal as well as homogeneous alumina-based diffusion barrier on the initial CuO layer.51 In contrast, the interface formation during PVD (physical vapor deposition) of Al on CuO is characterized by the complex alloy formation accompanied by an amorphization of the interface, resulting in an irreproducible and defective barrier layer. This lack of control over the interface formation during PVD process is also aggravated by the fact that the CuO surface is extremely rough and porous.
5. CONCLUSION
The dramatic differences in the thermal reactivity of a reactive nanolaminate are explained by different interface formation mechanisms between direct Al PVD and ALD processing of the diffusion barrier (Al2O3) on CuO. The interface formed upon Al deposition induces a deep penetration of Al atoms into the CuO layer, leading to Cu reduction and formation of a Cu− Al−O mixture with an irregular thickness at most ∼5 nm thick. It is also accompanied by amorphization of the CuO layer. The interface formed by TMA exposure leads to the extraction of oxygen from CuO and thus Cu reduction. In this case, however, oxygen is scavenged from the CuO surface region by the Al atoms and inserted into the Al−C bonds of the ligands. An ALD-deposited alumina layer as thin as 0.5 nm constitutes an effective barrier layer against long range mass diffusion, lowering the material reactivity. It is noteworthy that the thickness of the ALD-deposited alumina layers does not change the reaction properties. It is the nature of the initial few monolayers (0.5 nm) of alumina on CuO that provides the barrier capacity against interdiffusion of elements. This study highlights the importance of the chemical nature of the diffusion barrier on the properties of nanoenergetic materials. It also shows that trimethylaluminum surface reactions with CuO lead to the extraction of oxygen atoms from CuO and thus to CuO reduction. In this case, however, the presence of the surface methyl ligands prevents Al diffusion into CuO. The
reduction of substrate oxides by metal precursors during ALD has been observed on III−V substrates45,52,53 and recently examined theoretically in great detail,48−50suggesting that such a mechanism may be general and applicable to other systems.
■
AUTHOR INFORMATIONCorresponding Author
*E-mail: [email protected].
Notes
The authors declare no competing financial interest.
■
(1) Pantoya, M. L.; Granier, J. J. J. Therm. Anal. Calorim. 2006, 85,REFERENCES 37.(2) Weismiller, M. R.; Malchi, J. Y.; Lee, J. G.; Yetter, R. A.; Foley, T. J. Proc. Combust. Inst. 2011, 33, 1989.
(3) Moore, D. S.; Son, S. E.; Asay, B. W. Propellants, Explos., Pyrotech. 2004, 29, 106.
(4) Puszynski, J. A.; Bulian, C. J.; Swiatkiewicz, J. J. MRS Proc., Multifunctional Energ. Mater. 2006, 896, 147.
(5) Rai, A.; Zhou, L.; Prakash, A.; McCormick, A.; Zachariah, M. R. MRS Proc., Multifunctional Energ. Mater. 2006, 896, 99.
(6) Zhang, K.; Rossi, C.; Alphonse, P.; Tenailleau, C.; Cayez, S.; Chane-Ching, J. Y. Appl. Phys. A-Mater. 2009, 94, 957.
(7) Zhang, K.; Rossi, C.; Rodriguez, G. A. A.; Tenailleau, C.; Alphonse, P. Appl. Phys. Lett. 2007, 91, DOI: 10.1063/1.2785132.
(8) Petrantoni, M.; Rossi, C.; Conedera, V.; Bourrier, D.; Alphonse, P.; Tenailleau, C. J. Phys. Chem. Solids 2010, 71, 80.
(9) Tillotson, T. M.; Gash, A. E.; Simpson, R. L.; Hrubesh, L. W.; Satcher, J. H.; Poco, J. F. J. Non-Cryst. Solids 2001, 285, 338.
(10) Gash, A. E.; Tillotson, T. M.; Satcher, J. H.; Poco, J. F.; Hrubesh, L. W.; Simpson, R. L. Chem. Mater. 2001, 13, 999.
(11) Malchi, J. Y.; Foley, T. J.; Yetter, R. A. ACS Appl. Mater. Interfaces 2009, 1, 2420.
(12) Zamkov, M. A.; Conner, R. W.; Dlott, D. D. J. Phys. Chem. C 2007, 111, 10278.
(13) Blobaum, K. J.; Van Heerden, D.; Gavens, A. J.; Weihs, T. P. Acta Mater. 2003, 51, 3871.
(14) Blobaum, K. J.; Reiss, M. E.; Lawrence, J. M. P.; Weihs, T. P. J. Appl. Phys. 2003, 94, 2915.
(15) Weihs, T. P. In Handbook of Thin Film Process Technology; Glocker, D.A., Shah, S.I., Eds.; IOP Publishing: Philadelphia, 1998.
(16) Petrantoni, M.; Rossi, C.; Salvagnac, L.; Conedera, V.; Esteve, A.; Tenailleau, C.; Alphonse, P.; Chabal, Y. J. J. Appl. Phys. 2010, 108, DOI: 10.1063/1.3498821.
(17) Umbrajkar, S. M.; Schoenitz, M.; Dreizin, E. L. Multifunctional Energ. Mater. 2006, 896, 57.
(18) Schoenitz, M.; Ward, T.; Dreizin, E. L. Synth., Charact. Prop. Energ./React. Nanomater. 2004, 800, 85.
(19) Stamatis, D.; Jiang, Z.; Hoffmann, V.; Schoenitz, M.; Dreizin, E. Combust. Sci. Technol. 2009, 181, 97.
(20) Badiola, C.; Schoenitz, M.; Zhu, X. Y.; Dreizin, E. L. J. Alloys Compd. 2009, 488, 386.
(21) Dreizin, E. L. Prog. Energy Combust. 2009, 35, 141. (22) Dlott, D. D. Mater. Sci. Technol.-London 2006, 22, 463. (23) Blobaum, K. J.; Wagner, A. J.; Plitzko, J. M.; Van Heerden, D.; Fairbrother, D. H.; Weihs, T. P. J. Appl. Phys. 2003, 94, 2923.
(24) Gavens, A. J.; Van Heerden, D.; Mann, A. B.; Reiss, M. E.; Weihs, T. P. J. Appl. Phys. 2000, 87, 1255.
(25) Trenkle, J. C.; Wang, J.; Weihs, T. P.; Hufnagel, T. C. Appl. Phys. Lett. 2005, 87, DOI: 10.1063/1.2099544.
(26) Manesh, N. A.; Basu, S.; Kumar, R. Combust. Flame 2010, 157, 476.
(27) Frank, M. M.; Chabal, Y. J.; Wilk, G. D. Appl. Phys. Lett. 2003, 82, 4758.
(28) Ahlrichs, R.; Bar, M.; Haser, M.; Horn, H.; Kolmel, C. Chem. Phys. Lett. 1989, 162, 165.
(29) Perdew, J. P.; Burke, K.; Ernzerhof, M. Phys. Rev. Lett. 1996, 77, 3865.
(30) Weigend, F.; Ahlrichs, R. Phys. Chem. Chem. Phys. 2005, 7, 3297. (31) Weigend, F. Phys. Chem. Chem. Phys. 2006, 8, 1057.
(32) Eichkorn, K.; Treutler, O.; Ohm, H.; Haser, M.; Ahlrichs, R. Chem. Phys. Lett. 1995, 242, 652.
(33) Sierka, M.; Hogekamp, A.; Ahlrichs, R. J. Chem. Phys. 2003, 118, 9136.
(34) Melle-Franco, M.; Pacchioni, G. Surf. Sci. 2000, 461, 54. (35) Kresse, G.; Hafner, J. Phys. Rev. B 1993, 47, 558. (36) Kresse, G.; Hafner, J. Phys. Rev. B 1994, 49, 14251.
(37) Perdew, J. P.; Burke, K.; Wang, Y. Phys. Rev. B 1996, 54, 16533. (38) Blöchl, P. E. Phys. Rev. B 1994, 50, 17953.
(39) Kresse, G.; Joubert, D. Phys. Rev. B 1999, 59, 1758.
(40) Dudarev, S. L.; Botton, G. A.; Savrasov, S. Y.; Humphreys, C. J.; Sutton, A. P. Phys. Rev. B 1998, 57, 1505.
(41) Petrantoni, M.; Hemeryck, A.; Ducere, J. M.; Esteve, A.; Rossi, C.; Rouhani, M. D.; Esteve, D.; Landa, G. J. Vac. Sci. Technol., A 2010, 28, L15.
(42) Jagminas, A.; Kuzmarskyte, J.; Niaura, G. Appl. Surf. Sci. 2002, 201, 129.
(43) Lee, S. Y.; Mettlach, N.; Nguyen, N.; Sun, Y. M.; White, J. M. Appl. Surf. Sci. 2003, 206, 102.
(44) Thornton, J. A. J. Vac. Sci. Technol., A: Vac. Surf. Films 1986, 4, 3059.
(45) Umbrajkar, S. M.; Schoenitz, M.; Dreizin, E. L. Thermochim Acta 2006, 451, 34.
(46) Ermoline, A.; Stamatis, D.; Dreizin, E. L. Thermochim Acta 2012, 527, 52.
(47) Lanthony, C.; Ducere, J. M.; Esteve, A.; Rossi, C.; Djafari-Rouhani, M. Thin Solid Films 2012, 520, 4768.
(48) Lamagna, L.; Wiemer, C.; Perego, M.; Spiga, S.; Rodríguez, J.; Santiago Coll, D.; Grillo, M. E.; Klejna, S.; Elliott, S. D. Chem. Mater. 2012, 24, 1080−1090.
(49) Tallarida, M.; Kukli, K.; Michling, M.; Ritala, M.; Leskelä, M.; Schmeisser, D. Chem. Mater. 2011, 23, 3159.
(50) Klejna, S.; Elliot, S. D. J. Phys. Chem C 2012, 116, 643. (51) Hinkle, C. L.; Sonnet, A. M.; Vogel, E. M.; McDonnell, S.; Hughes, G. J.; Milojevic, M.; Lee, B.; Aguirre-Tostado, F. S.; Choi, K. J.; Kim, H. C.; Kim, J.; Wallace, R. M. Appl. Phys. Lett. 2008, 92, DOI: 10.1063/1.2883956.
(52) Huang, M. L.; Chang, Y. C.; Chang, C. H.; Lee, Y. J.; Chang, P.; Kwo, J.; Wu, T. B.; Hong, M. Appl. Phys. Lett. 2005, 87, DOI: 10.1063/1.2146060.
(53) Hinkle, C. L.; Sonnet, A. M.; Milojevic, M.; Aguirre-Tostado, F. S.; Kim, H. C.; Kim, J.; Wallace, R. M.; Vogel, E. M. Appl. Phys. Lett. 2008, 93, DOI: 10.1063/1.2987428.