A MICROFLUIDIC SYSTEM FOR LOCALISED
GROWTH OF BIOFILMS AND STUDIES OF
REA-LATED BIOCHEMICAL KINETICS
Mémoire
Nahid Babaei Aznaveh
Maîtrise en chimie
Maître ès sciences (M.Sc.)
Québec, Canada
III
Résumé
Nous avons développé une biopuce de microfluidique qui est capable de surveiller continuelle-ment la population de cellules dans les biofilms en conditions d'écoulecontinuelle-ment laminaire bien con-trôlées. Ce dispositif microfluidique est capable de modeler la formation des biofilms linéaires en utilisant une approche de flux basé sur un modèle. Les considérations de conception et méthodo-logie de fabrication d'un micro-bioréacteur à deux niveaux, inclus le flux basé sur un modèle (FT-μBR) qui génère un flux de croissance du biofilm entouré par les 3 côtés par un flux de confine-ment et inhibiteur de croissance.
Grâce à une combinaison d'expériences et de simulations, nous avons évalué et exploité exhausti-vement les paramètres de contrôle pour manipuler les dimensions du modèle de flux de crois-sance du biofilm. Ce dispositif est ensuite utilisé pour développer des modèles linéaires du bio-film avec des dimensions contrôlables. Une étude de validation de principe utilisant le dispositif démontre son utilité dans la réalisation des mesures de taux de croissance du biofilms dans diffé-rents environnements de force de cisaillement. Cela ouvre la voie à des études quantitatives sur les effets de l'environnement des cisaillements locaux sur les propriétés des biofilms et pour la synthèse d'une nouvelle génération de biomatériaux fonctionnels ayant des propriétés contrô-lables.
V
Abstract
We have developed a microfluidic biochip that is capable of continuously monitoring cell popula-tion in biofilms under well-controlled laminar flow condipopula-tions. This microfluidic device capable of patterning linear biofilm formations using a flow-templating approach. The design considera-tions and fabrication methodology of a two level flow-templating micro-bioreactor (FT-μBR) generates a biofilm growth stream surrounded on 3 sides by a growth inhibiting confinement stream. Through a combination of experiments and simulations we comprehensively evaluate and exploit control parameters to manipulate the biofilm growth template stream dimensions. The FT-μBR is then used to grow biofilm patterns with controllable dimensions. A proof-of-principle study using the device demonstrates its utility in conducting biofilm growth rate measurements under different shear stress environments. This opens the way for quantitative studies into the effects of the local shear environment on biofilm properties and for the synthesis of a new gen-eration of functional biomaterials with controllable properties.
VII
Table of Contents:
RÉSUMÉ ... III
ABSTRACT ... V
TABLE OF CONTENTS: ... VII
LIST OF FIGURES: ... XI
LIST OF TABLES: ... XIII
LIST OF EQUATIONS: ... XV
ABBREVIATIONS: ... XVII
ACKNOWLEDGMENTS: ... XIX
FOREWORD AND STATEMENT OF AUTHORSHIP ... XXI
1. CHAPTER1: INTRODUCTION ... 1
1.1. Motivation: Biocatalysts for waste water treatment and energy production ... 1
1.2. From planktonic to sessile bacterial life and finally biofilm formation ... 3
Structure and composition of biofilms and EPS ... 4
1.2.1. The biofilm life cycle ... 5
1.2.2. Microbial digestion and metabolism ... 5
1.2.3. 1.2.3.1. Microbial digestion of biocatalysts for waste water treatment and energy production ... 7
1.2.3.2. Microbial fuel cell ... 7
1.3. Benefits of microfluidics in bacterial biofilm studies ... 8
Low volumes ... 9
1.3.1. Well defined micro size ... 9
1.3.2. Precise hydrodynamic conditions ... 9 1.3.3.
VIII
1.3.3.1. Laminar flow: ... 10
1.3.3.2. BF response to shear forces ... 11
Previous studies using microfluidics for biofilm growth in microfluidic devices ... 12
1.3.4. 2. CHAPTER 2: MATERIALS AND METHODS ... 15
2.1. Materials and equipment ... 15
Bacterial strains, culture conditions and characterisation ... 15
2.1.1. Device fabrication materials and equipment ... 15
2.1.2. Fluidic accessories... 16
2.1.3. 2.2. Experimental procedures ... 16
Microfluidic devices design and fabrication ... 16
2.2.1. Electroless metal deposition on microchannel walls ... 19
2.2.2. Biofilm cultivation ... 21
2.2.3. Image analysis of flow patterns, sessile bacteria and adhered biofilms ... 23
2.2.4. Colony and cell counting ... 25
2.2.5. 2.3. In situ characterisation and visualisation techniques of fluidic flow streams in addition to biofilms ... 25
Computer simulations of flow patterns ... 26
2.3.1. Analytical instrumentation ... 26
2.3.2. 2.3.2.1. Optical microscopy ... 26
2.3.2.2. Confocal laser scanning microscopy (CLSM) ... 27
3. CHAPTER 3: RESULTS AND DISCUSSION ... 29
3.1. Control of flow template and generation of linear template flow patterns ... 29
Generating linear template flow patterns ... 29
3.1.1. Optimisation of flow configuration ... 29
3.1.2. 3.1.2.1. Reducing the effect of diffusion on template streams ... 29
3.1.2.2. Simulation of flow patterns ... 31
3.1.2.3. Template profiles determined by flow rate ratio, independent of total flow rate ... 33
3.1.2.4. Microjunction fabrication parameters and their effect on the template stream ... 33
Quantitative measurement and control of flow templates ... 34
3.1.3. 3.2. Control over BF growth dimensions and quantification biofilm growth using advanced optical image analysis ... 36
Templated growth of BFs ... 36
Time dependant growth studies ... 39
3.2.1. 3.2.1.1. Growth rate with varied applied shear stress ... 41
IX
3.2.1.3. Relation between the number of biofilm colonies and biomass density ... 43
3.2.1.4. Cell counting of early stage biofilm development by high resolution microscopy ... 43
3.2.1.5. Cell counting of early stage biofilm development by high resolution CLSM... 45
3.3. Microfluidic studies of shear induced cell proliferation from biofilms... 47
Biofilm-Associated Planktonic Cell Production ... 47
3.3.1. Biofilm Morphology ... 49
3.3.2. 3.4. Biofilm Growth on Silver and Gold Layers ... 52
CONCLUSION ... 53
FUTURE WORKS ... 55
XI
List of Figures:
Figure 1: An illustration of the development of the biofilm. ... 5
Figure 2 : Glucose metabolism and the electron transport chain of bacteria and mitochondria. ... 6
Figure 3 : Respiration reaction ... 6
Figure 4 : Microbial fuel cells (MFCs) ... 8
Figure 5 : Size characteristics of microfluidic devices. ... 9
Figure 6 : Optical micrographs of laminar flow in michrochannel ... 10
Figure 7 : Optical bright field image showing biofilm growth affected by corner effects and simulated shear rate distribution in the microfluidic channel. ... 11
Figure 8: Cross-sectional view of a micro-scale microbial fuel cell (MFC) ... 13
Figure 9 : Photolithography technique ... 17
Figure 10 : Schematic for MF fabrication. ... 17
Figure 11 : Schematic of the two-level device. ... 19
Figure 12 : Experimental procedure for electroless metal plating on PDMS ... 21
Figure 13: Microscopic images of metal deposition surface on the microchannel. ... 21
Figure 14 : Flow setup. ... 22
Figure 15 : Bacterial inoculation. ... 23
Figure 16 : Colony counting. ... 25
XII
Figure 18 :Simulisation of flow patterns. ... 32
Figure 19 : Template profiles determined by flow rate ratio, independent of total flow rate... ... 33
Figure 20 : Microjunction fabrication parameters and their effect on the template stream ... 34
Figure 21 :Quantitative measurement and control of flow templates.. ... 36
Figure 22 :Optical images of templated biofilms ... 37
Figure 23 : Stitched image showing the complete measurement channel containing a biofilm and normalised optical density measurements ... 38
Figure 24 :Analysis of time lapes Images of the growing biofilm ... 41
Figure 25 : Relation between change in the optical density and the applied wall shear stress. ... 42
Figure 26 : Relation between the length in time of the lag phase and the wall shear stress ... 42
Figure 27 : Relation between the number of biofilm colonies and biomass density ... 43
Figure 28 : Development of pre-biofilm phase sessile bacteria ... 44
Figure 29 : Cell counting during the pre-biofilm phase. ... 45
Figure 30 : High resolution CLSM images of the sessile bacteria ... 46
Figure 31: Cell counting during the pre-biofilm phase ... 46
Figure 32 :The viable cell numbers.. ... 48
Figure 33 : The average thickness of microfluidic channel biofilms.... 50
Figure 34: CLSM orthogonal projections of stacks of images taken of the various biofilms at 0.6 μm depth intervals. ... 51
Figure 35 : Fluorescence microscope images of biofilms containing GFP bacteria in microchannels containing a silver layer ... 52
XIII
List of Tables:
Table 1 : Range of composition of biofilm matrices... 4
Table 2 : Experimental techniques available to study multiphase flow in microsystems with their spatial and temporal resolution. ... 26
XV
List of Equations:
Equation 1 : (Reynolds number equation) ... 10
Equation 2 : (Diffusion equation)... 11
Equation 3 : (Shear stress equation) ... 12
XVII
Abbreviations:
ADP Adenosine diphosphate ADP ATP Adenosine triphosphate arb. units Arbitrary unit
NAD+ Nicotinamide adenine dinucleatide BF Biofilms
CFU Colony forming units QC Confinement flow rate QT Template flow rate
CLSM Confocal laser scanning microscopy diameter D Diffusion coefficient
DH Hydraulic diameter of the microchannel DOC Dissolved organic carbon
EPS Extracellular polymeric matrix GFP Green fluorescent protein in situ In the place
Ix Local pixel intensity
Imax, min Maximum and minimum pixel intensities LM Length of microfluidic
wM Width of microfluidic hM Height of microfluidic MF Microfluidic
XVIII
FT-μBR Flow-templated micro bioreactor MFCS Microbial fuel cells
Pe Péclet number PFA Perfluoroalkoxy PDMS Polydimethylsiloxane QTot Flowrate total
rpm Revolutions per minute τ Shear stress
wT Biofilm templating stream width hT Biofilm templating stream height
tlp Time duration of the lag phase
COMSTAT Community Statistics software programs MEMS Biomedical microelectromechanical systems AB Mix of the two solutions A and B
XIX
Acknowledgments:
This dissertation would not be accomplished without the advices and supports of people whom I am greatly indebted.
First and foremost, I wish to express my profound gratitude to Prof. Jesse Greener, my supervi-sor, for giving me this opportunity to work with his group and introducing me to the challenges of modern Microfluidic sciences and for his invaluable guidance and assistance. I am incredibly grateful and appreciative of his incessant kindness, patience and understanding.
I would also like to thank Doctor Gideon Wolfaardt from the department of chemistry and biolo-gy at Ryerson University who gave me the opportunity to have collaboration in his lab, and also, a very big thank you to dear Dr. Elanna Bester, who helped me tremendously and kindly during these 2 years.
I am grateful to all the members of the thesis jury committee: Prof. Dominic Larivière and Prof. Freddy Kleitz for reviewing a thesis, and provide positive and beneficial feedback on the thesis.
I would like to sincerely thank to Profs: Michèle Auger, Michel Pézolet and Steve Charette for allowing access to their labs.
I would like to express my sincere appreciation to my family who have been the source of en-couragement and inspiration to me throughout my life.
I would like also to thank all my colleagues (Muhammad Safdar, Jean-Nicola Verin, Eya Mejri, Mkaouar Mahdi), who helped me in this project and for their amity and supports which made great memories throughout my M.Sc. program.
Finally, I acknowledge the financial and technical support of the Centre de recherche sur les ma-tériaux avancés (CERMA) and Centre Québécois sur les Mama-tériaux Fonctionnels (CQMF) and Hydro-Québec for technical and financial help.
XXI
Foreword and Statement of Authorship
This thesis is written in a manuscript-based format and consists of 3 chapters. The first chapter is a reference to the biocatalytic activity of biofilm, as a valuable resource for alternative energy and water treatment plant to contamination concerns, and an overview of existing methods and their problems, and presented a new method for controlling and planning the biofilm to improve higher efficiency. In the rest of this chapter microfluidic integration benefits with biofilm are mentioned as the best lab-on-chip, to create accurate and stable hydrodynamic properties.
In the second chapter the materials and equipment used in this project, design, fabrication and modification techniques and preparing biological samples are presented, and at the end, tech-niques and methods for the characterisation and analysis of the results are described.
Chapters three presents experimental results of this project and the other common project with Ryerson University's microbiology department, in the form of submitted articles.
My contribution in first manuscripts (1) was to perform all the experimental work, data collec-tion and analysis, and all the simulacollec-tion parts in Figures 9, 16, 17, 18 and 19 designed by my dear colleague Mohammad Safdar.
1. N. B. Aznaveh, M. Safdar, G. Wolfaardt, J. Greener, "Micropatterned biofilm formations by laminar flow-templating", Lab Chip, 2014, DOI: 10.1039/C4LC00084F.
In the second following manuscript I helped for some experimental part. The information from this paper are presented in chapters 2, Materials and Methods, Sections 2.2.4; 2.3.2.2; and chapter 3: Results, Section 3.3.1, 3.3.2.
2. Elanna Bester, Gideon M. Wolfaardt, Nahid B. Aznaveh and Jesse Greener, "Biofilms’ Role in Planktonic Cell Proliferation", Int. J. Mol. Sci. 2013, 14, 21965-21982.
XXII
Nevertheless, this research work includes more results from my works that presented in other manuscripts such as verification biofilm growth on metal surface deposition in order to SERS imaging (3), (4), (5) as follows:
3. François Paquet-Mercier, Nahid Babaei Aznaveh, Muhammad Safdar and Jesse Green-er, "A Microfluidic Bioreactor with in Situ SERS Imaging for the Study of Controlled Flow Patterns of Biofilm Precursor Materials", Sensors, 2013, 13, 14714-14727;
4. F.Paquet-Mercier, N. Babaei Aznaveh, M. Safdar, J.Greener "Next generation micro-fluidic reactors for spectroscopic imaging of biomaterials", Eur Cell Mater, 2013, 26, 81.
5. F. Paquet-Mercier, A. Kara, M. Safdar, N.B. Aznaveh, M. Zarabadi, J. Greener,
"De-velopment and calibration of a microfluidic biofilm growth cell with flow-templating and multi-modal characterization", IEEE-EMBC, 2014.
The last part includes a general conclusion on the work performed and recommendations for fu-ture works.
1
1.
Chapter1: Introduction
1.1. Motivation: Biocatalysts for waste water treatment and energy
produc-tion
Bacterial biofilms in each ecosystem contains adequate nutrients prevail and metabolize easily. This formation and accumulation of bacteria can cause serious problems in industrial and medical water systems and processes. In addition to the costs imposed for removal and cleaning, biofilms can cause loss of energy and obstruction industrial water systems. Biofilms can also cause the spread of pathogens in water distribution systems.
Biofilms are compact, microbial communities which aggregate and attach to surfaces, usually in an aqueous environment. In the vicinity of a surface due to adhesion complex process, they create significant changes in their phenotype, and exhibit different properties such as increased chemical resistance against antimicrobial agents up to 500 times more compared to free floating cells. Today, instead of spending large sums to remove biofilms, researchers are trying to isolate them and establish efficient removal properties in order to eliminate increased organic contaminants available in the water and wastewater systems.
The bacteria in a biofilm can consume organic molecules (carbon-based nutrients) from the wastewater, providing energy for their metabolism, while at the same time cleaning it. Bacterial-based cleaning is the most economical way of treatment, rather complex process configurations have resulted. On the other hand, due to excessive use of energy and global warming, the need for stable and green energy is stronger than ever. The large amount of organic waste substances in wastewater also represents an important alternative energy source, in the recent years using of microbial fuel cells represent a new approach to wastewater treatment and generate renewable electricity from a vast array of carbon sources of water containing glucose, acetate or lactate. Our group intends to focus on the use of biofilms, as a class of materials that has the potential for wide ranging applications in areas including energy, catalysis, bio-MEMS, environmental reme-diation, and industries such as health, food and naval shipping. We aim to control biofilms func-tionality for specific applications. In particular, our long-term goal is the optimisation of
biofilm-2
based materials for use in microbial fuel cells. This novel approach to synthesise biofilms has the potential to produce electrical energy from the breakdown of organic materials found in wastewater, without the need for additional catalytic materials.
While great advances have been made in the understanding of biofilms from the perspective of molecular biology in the last 5-10 years, further advances require quantitative characterisation under well-defined physical conditions. This has prompted new creative approaches to character-isation, such as combined use of confocal laser scanning microscopy and fluorescence correlation spectroscopy for the study of growth and diffusion within the biofilm matrix0F
1 and flexible flow cells for the estimation of biofilm mechanical properties1F
2. Nevertheless, there is a need for a ver-satile platform that enables both simple and quantitative in situ measurements of biofilms using standard laboratory equipment, while achieving strict control over the hydrodynamic environ-ment. Optically transparent microfluidic (MF) channels are ideal environments to manipulate and study biofilms because they can achieve excellent control over hydrodynamic, chemical and thermal conditions and are readily examined by regular optical microscopes. In addition, a major practical advantage includes strongly reduced requirements on growth medium volumes. This opens the way for studies that require high fluid velocities and long-duration experiments, with-out compromise of growth media sterility when filling or replacing reservoirs. The current ap-proach to growing biofilms in MF channels is to inoculate the entire microchannel, thereby ex-posing bacteria to the all wall surfaces. However, corner effects in rectangular microchannels result in variations in biofilm properties due to large differences between the values of wall shear stresses at the channel corners versus those at straight wall segments. In addition, recent work shows that biofilm overgrowth can strongly affect the free volume in MF channels, resulting in unpredictable changes to the hydrodynamic environment, thereby undermining the major ad-vantage of MFs2F
3,
3F
4.Factors such as a nutrient source and concentration have only limited impact on biofilm thickness and density, therefore a new approach to localise and limit biofilm growth in the microchannel is required4F
5.
This work describes the development and demonstrates the functionality of a micro bioreactor that can overcome the problems above by confining biofilm growth to a region of the MF channel that experiences uniform wall shear stress. This could accomplish by generating co-flowing streams with controllable dimensions that geometrically localise biofilm growth on one micro-channel wall and prevent growth in micromicro-channel corners. Resulting biofilms are predicted to
3 have more uniform dimensions, density, and bioactivity compared to those growing in heteroge-neous hydrodynamic environments6. The flow-templated micro bioreactor (FT-μBR), presented here, brings specific design and operational enhancements over a co-flow device that we recently used for surface enhanced Raman studies of liquid streams7. To the best of our knowledge, the FT-µBR enables, for the first time, patterning of biofilms with controllable dimensions on a sin-gle microchannel wall. The biofilms were grown on the wall opposite a coverslip sealing layer to enable unobstructed inspection of the entire channel volume, including the cultured biofilms. Quantitative analysis was conducted using a normal bright-field microscope with validation be-ing provided by numerical simulation. In this work, we analysed the flow-template stream width and height to define and comprehensively explore reactor design features and operational control parameters. We used the FT-μBR for a proof-of-principle study of the biofilm growth rate under different shear stress environments. This work demonstrates the utility of liquid-phase biofilm growth templating to enable accurate studies related to growth in different hydrodynamic envi-ronments. It also opens the way for optimising biofilm properties for new uses as functional ma-terials.
1.2. From planktonic to sessile bacterial life and finally biofilm formation
Formation of a biofilm begins with the attachment of suspended bacteria (planktonic) to a sur-face. These first colonizing bacteria adhere to the surface initially through weak and reversible van der Waals forces. If these colonies have the ability of anchoring themselves on the surface, there is a chance for creating the sessile form using cell adhesion structures such as pili8. General definition for biofilms is accumulation of cells connected together and encapsulated and embed-ded in an extracellular polymeric matrix (EPS) on a solid substratum or interface that can be es-tablished on all aquatic and industrial surfaces9, 10, 11. The EPS, which is comprises approximate-ly 90 percent of the dry mass of biofilm, versus 10 percent of microorganisms, is responsible for providing the conditions to help bacteria adhere to the surface. The biofilm bacteria are non-motile and undergo cell-cell communication via quorum sensing signals and chemical interac-tions.In addition to providing energy and nutrients, EPS helps aids in biofilm survival in harsh environments due to its protective properties. The EPS has viscoelastic properties that provide mechanical stability via against detachment, drying, antibiotics, ultraviolet radiation and oxida-tion10, 11,12.For example, biofilm bacteria are 500 times more resistant against antimicrobialsub-4
stances, enabling cell proliferation under harsh chemical and hydrodynamic conditions compared to their planktonic counterparts12F
13.Physiological changes created in bacterial biofilms are respon-sible for the increased resistance. This mechanism is due to alterations in gene expression lead-ing to a phenotype shift between the planktonic and sessile forms. The sessile forms are more resistant as they produce exopolysaccharide, have different growth characteristics and take up nutrients and drugs differently from their planktonic counterparts13F
14,
14F
15 thus, biofilms are able to survive in many different environments where free floating bacteria would be eliminated, where-fore bacteria preferentially reside in biofilms.
Structure and composition of biofilms and EPS 1.2.1.
Biofilms are complex communities of microorganisms attach on a surface and typically embedded within a self-produced matrix of EPS. The major matrix components are mi-crobial cells, polysaccharides and water up to 97%. (Table 1)15 F
16. The other constituents of EPS are proteins, nucleic acids, peptidoglycan, and lipids16F
17. In the area of contact between bacteria and surface, the flagella, pili and fimbriae as extracellular structures of bacteria can facilitate cell adhesion with the surface and also stabilise the matrix through the production of several different proteins and polysaccharides. The amount of cellular material within a biofilm and structure of the biofilm EPS can vary depending on environmental conditions, which include surrounding biological materials and organisms, hydrodynamic conditions, temperature, and type and quantity of nutrients available to the cell 11, 12.
Component % of matrix
Water Up to 97%
Microbial cells 2-5% (Many species)
Polysaccharids 1-2%(Neutral and polyanionic)
Proteins <1-2%(Many, including enzymes)
DNA and RNA <1-2%(From lysed cells)
Ions ?(Bound and free)
5 The biofilm life cycle
1.2.2.
Microscopic analysis has shown that biofilm formation involves five sequential stages (Figure 1)9,18 Steps 1 and 2 include the initial adhesion when some bacterial cells in an aqueous environ-ment reversibly attach to a surface. Adhesion at this stage is usually nonspecific, via Van der Waals forces, electrostatic or hydrophobic interactions. Steps three and four involve the irreversi-ble adhesion and biofilm development through the cellular accumulation and subsequent growth and leads to maturation of cells and formation of micro-colonies. The fifth and final step includes separation and detachment of cells by diffusion or due to biofilm erosion. These cells are then able to return to the biofilm life cycle 8, 9, 18.
Figure 1: An illustration of the development of the biofilm.18F
19 Microbial digestion and metabolism
1.2.3.
Bacteria are very small organisms (ca. 1 µm) which can breakdown a huge variety of organic compounds such as glucose and acetate in waste water, into CO2, protons and electrons19F
20. Oxi-dative phosphorylation is the metabolic pathway in which the mitochondria in cells use their structure, enzymes, and energy released by the oxidation of nutrients to reform adenosine tri-phosphate (ATP), and the micro-organisms use the produced energy to grow and to maintain their metabolism. During oxidative phosphorylation (Figure 2), microorganisms can release elec-trons from an electron-rich substrate, using a coenzyme known as nicotinamide adenine dinucle-atide or NAD+ in the low redox potential and transfer these electrons through the electron transport complex by the cell membrane where the final acceptor is reduced. These redox reac-tions release energy, which is used to form ATP. In eukaryotes, the enzymes in this electron
1 2
4 3
6
transport system use the energy released from the oxidation of NADH to pump towards protons across the inner membrane of the mitochondrion. This causes protons to build up in the inter-membrane space, and generate an electrochemical gradient across the inter-membrane which leads to the liberation of energy. Using this energy from a proton gradient, ATP synthase catalyzes the formation of ATP from the phosphorylation of adenosine diphosphate (ADP) with inorganic phosphate, in order to reproduce the energy carrier molecules such as adenosine triphosphate trough the membrane complex21, 22.
Figure 2 : Glucose metabolism and the electron transport chain of bacteria and mitochondria23.
Bacteria, for survive and grow in addition to appropriate nutrients, need the presence of a suitable electron acceptor. Depending on the final acceptor, there are two processes for microbial metabo-lism: Respiration and fermentation.
During respiration, the bacteria grow by using the energy generated by electron transfer to the external electron acceptor. During respiration, microorganisms can release electrons from oxida-tion (Figure 3) of substrate and transfer these electrons through the electron transport complex by the cell membrane as explained before where the final acceptor that is reduced.
Organic waste+ O
2 CO Seed of biofilm 2+ H2O
NADH
NAD+
7
1.2.3.1. Microbial digestion of biocatalysts for waste water treatment and energy production
Metabolism of microorganisms in biofilms via oxidation leading to decomposition of organic matter and naturally remove pollutants from the water, are very beneficial. Biofilms have been suggested for industrial application as robust, self-immobilised and self-regenerating catalysts in productive catalysis. They can be an effective and environmentally friendly tool for the industrial production of chemicals. In addition they can catalyze reactions with high specificity under mild condition thereby reducing waste and energy requirement in comparison the chemical process-es23F
24.
1.2.3.2. Microbial fuel cell
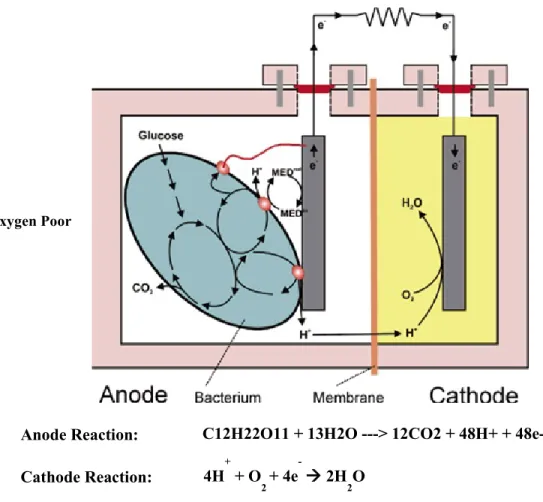
Using biocatalytic agency like the biofilm lead to creating microbial fuel cells as an emerging technology. Microbial fuel cells (MFCs) may become an alternative “green” energy technology of the future as they generate sustainable electricity from biodegradable organic compounds through microbial metabolism. They have the potential to replace traditional fuel cell catalysts, such as Pt, because they are low-maintenance and can operate for long times due their regenera-tive properties. In contrast, Pt is expensive, requires fuel pre-processing to limit poisoning by impurities, and in any case, requires periodic cleaning.
The idea of forming a fuel cell formed based on the similarities of microorganism respiration processes with electrochemical processes that take place in the cell. In the reactor, when bacteria are placed in the anode chamber of a fuel cell that is free of oxygen, they attach to an electrode. Due to lake of oxygen, they must transfer the electrons that they obtain from oxidation of organic substrates (electron donors) somewhere else than to oxygen. They transfer them by microbial extracellular electron transfer in the anode, generating electrons and protons. Then electrons are transferred to the cathode through an external circuit and protons through the internal membrane. At the cathode the electrons, oxygen and protons combine to form only water as (Figure 4)24F
25,
25F
8
Figure 4 : Microbial fuel cells (MFCs) to turn waste into energy and potable water: under anaerobic
conditions, electrons produced by substrate oxidation via bacteria are transferred to anode (negative ter-minal) and flow to the cathode (positive terter-minal) linked by a conductive material. For complete the cir-cuit, protons move to cathode compartment through Proton Exchange Membrane27.
1.3. Benefits of microfluidics in bacterial biofilm studies
Microfluidics is the area of science and technology that is focused on controlling and manipulat-ing simple or complex, mono or multiphase flows in natural or artificial micro systems. At least, one dimension of a microfluidic channel (height or width) should be below 1000 μm (Figure 5)28, 29.
C12H22O11 + 13H2O ---> 12CO2 + 48H+ + 48e- Anode Reaction: Cathode Reaction: 4H+ + O 2 + 4e 2H 2O
9 Figure 5 : Size characteristics of microfluidic devices29F
30. Low volumes
1.3.1.
Microfluidic technology permits the processing, manipulation and miniaturisation of biological experimentation of micro volumes. This technology also allows more accurate, faster and cheap-er analysis30F
31. In addition, a major practical advantage includes strongly reduced requirements on growth medium volumes during biofilm formation. This opens the way for studies that require high fluid velocities and long-duration experiments, without compromise of growth media sterili-ty when filling or replacing reservoirs31 F
32.
Well defined micro size 1.3.2.
Bacterial biofilm growth process usually starts with sticking the bacteria on the surface at the nanometer scale via extracellular mediators such as pili and flagella. The individual cells form microcolonies and then biofilm form with heights in the range between tens and thousands of microns. The micro channels, which are on a compatible size scale, are well-suited for the fun-damental studies of growth and biofilm formation17,
32F
33.
Precise hydrodynamic conditions 1.3.3.
The formation, metabolism and immobilised colonies on the surfaces are related very closely with hydrodynamic condition33F
34. Due to the surface area to cell volume ratios, we are able to make accurate hydrodynamic conditions and establish a stable temperature profile in the
long-10
term, thereby giving the ability to control the local microenvironment of microbial cells and bio-films35. In this section, two important characteristics of the flow in microchannel, “laminar flow and shear stress”, will be explained.
1.3.3.1. Laminar flow:
Laminar flow of liquids that naturally occurs in microchannel is the most important characteristic of microfluidic device which allows parallel flow of two or more different fluids without signifi-cant mixing (Figure 6)36.
The dimensionless Reynolds number (Re) describes whether flow conditions are laminar or tur-bulent. In microchannels, Re < 2300, indicating laminar flow.
Equation 1 : Re =𝜌𝜈DH /µ
Where 𝜌 is the kinematic density of fluid, 𝜈 is the mean velocity of fluid, DH is the hydraulic diameter of the microchannel, and µ is the dynamic viscosity of fluid36F
37.
We will demonstrate how we use the laminar flow conditions to eliminate so-called corner ef-fects (Figure 7) in rectangular microchannels, which can result in variances in biofilm properties.
(b)
Figure 6 : Optical micrographs of michrochannel include: (a) 2 co-flowing food dye-laden streams (b) 3 co-flowing dyed streams flowing in parallel without mixing.
11 Figure 7 : (a) Optical bright field image of developed biofilm area, showing biofilm growth affected by
corner effects via the shear stress near to zero therefore accumulation biofilm in this area. (b) Simulated shear rate distributionin the microfluidic channel that can help for choosing the area with more uniform wall shear stress in order to localised biofilm and eliminate corner effect.
Since in multi- stream laminar flow in the microchannel no convective mixing between the fluids occur, the only remaining mechanism of mixing is diffusion across the mutual liquid–liquid inter-face between the two streams that acts perpendicular to the flow direction, thus, laminar flow is ideal for carrying controlled substance and confinement of reactants38. Diffusion is driven by Brownian motion in which molecules, ions or other small particles spontaneously move over time, from areas of higher to low concentration39. The degree of diffusional mixing depends on the diffusivities (D) of the species and the diffusion time according to Equation 2,40
Equation 2 : D2 =2dt or D=√2dt,
Where d is the distance a particle that moves in a time (t). Diffusion coefficients are approximate-ly inverseapproximate-ly related to molecular size. Generalapproximate-ly small molecules have larger D than large mole-cules37.
1.3.3.2. BF response to shear forces
The formation, final structure, morphology, density and metabolism of biofilms have a close rela-tionship with hydrodynamic conditions imposed on it. Specifically, shear force applied to the interface of the biofilm is critical in determining these properties34 During the initial stages of biofilm growth, the shear stress affects bacterial cell residence time8. Shear force can also cause
12
the detachment of biofilm, which is an important stage of the life cycle41 that influences the growth, structure, and stability of biofilm34.
Equation 3 : (Shear stress equation) τw =6µ× Ǫ/h2w
Where Ǫ is the flowrate, τw,is the shear stress at the walls,µ the fluid viscosity, w is the chan-nel’s width, and h the channel height. Adhesion and detachment of cells depend on the threshold shear stress. Because of the flexibility of matrix, its shape can be changed in response to applied forces. Biofilms grown under higher shear have the thinner and denser structure42 and stronger adherence and EPS than those grown under low shear12.
Previous studies using microfluidics for biofilm growth in microfluidic devices 1.3.4.
Recently, several manuscripts have been published on the use of microfluidics to control hydro-dynamics in low Reynolds number environments while studying its effect on biofilm morpholo-gy, mechanical properties, adsorption/detachment, and efficacy of anti-fouling surfaces, streamer formation and planktonic cell proliferation.
Jeongyun Kim and all to investigat the events leading to bacterial attachment to surfaces that in-fluence the biofilm formation and inhibition, preferred to use microfluidic device rather than the conventional methods, such as macro-scale flow cells, because they are low-throughput, require large volumes, and do not allow spatial and temporal control of biofilm community formation42F
43.
Lukas Richter and all used microfabricated biochips to continuously monitor dynamic responses of cell population to increased shear stress and antimicrobial agent concentration, in a non-invasive manner. Using various bacterial and yeast strains confirmed the high sensitivity of this developed platform for direct identification of microbial strains based on morphological differ-ences and biological composition43F
44.
Junghyun Kim and all expressed that physical, chemical and biological factors are the most influ-ential factors on the growth, adhesion, proliferation and detachment of biofilms. Microfluidics have been used for analyzing and specifying the effects of factors such as shear stress, surface topography, quorum sensing, signals, temperature, nutrient concentration in a quantitative way,
13 but characterizing and quantifying the effects the major influencing factors (e.g., shear stress) on bacterial biofilms have not been well studied and underdeveloped.
They investigated the effects of hydrodynamic conditions on biofilm formation by Pseudomonas aeruginosa in microfluidic's channels, and found that in addition to the impact of these conditions on the biofilm, biofilm growth on the edge of the channel, causing narrowing of the width of the stream and thus changing the flow velocity. They found that at low Reynolds, increased flow rates increased biofilm growth, the While at higher flow rates with high Reynolds is biofilm In-hibit the growth of the biofilm. These results as a fundamental model can be expanded under-standing the relative roles of factors such as shear stress, nutrient requirements, interactions with cells and cell-matrix erosion, and etc. on biofilm formation in microfluidic channels45.
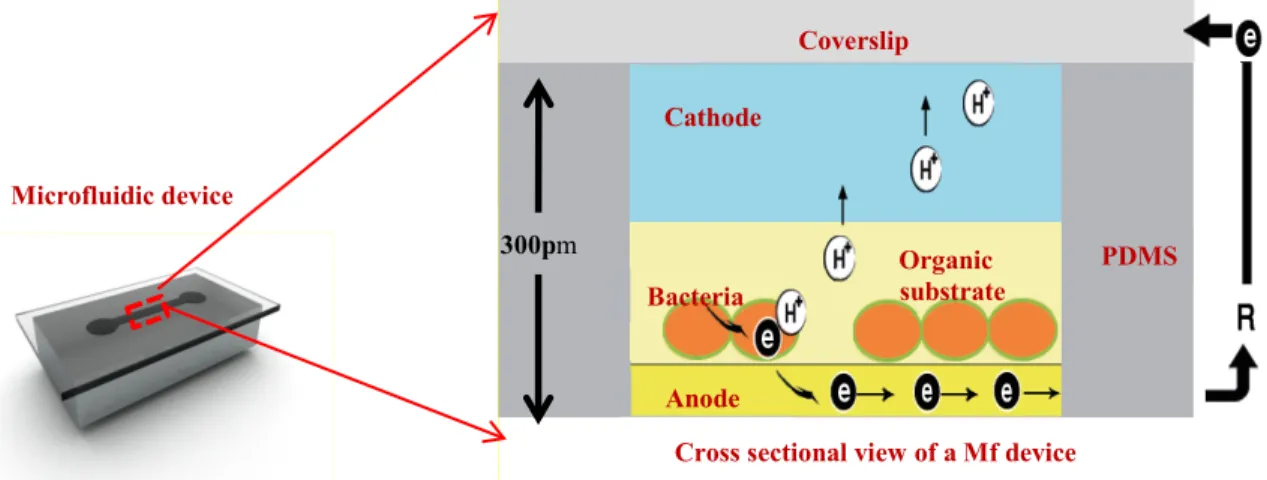
Microbial fuel cells (MFCs) as explained in Section 1.2.3.2 could be an alternative “green” ener-gy for generating electricity from renewable biodegradable organic compounds through microbial metabolism.Recently miniaturized microbial fuel cell (Figure 8) production has grown, because they have the potential to power small portable electronics with low-cost renewable energy tech-nology. The problem of micro-sized microbial fuel cells is very little ability to generate energy that could be problematic for practical use, so Seokheun Choi attempted to optimise production of biofilm in microfluidic to produce high power density.The progress of this research involves the use of microfluidic device lead to produce, the fewer population of microorganisms and thus allows precise control in microenvironment and hydrodynamic conditions surrounding of the microorganisms. This contributes to a more precise understanding of the mechanisms of extracel-lular electron transfer in the microorganisms46.
Figure 8: Cross-sectional view of a micro-scale microbial fuel cell (MFC) Coverslip 300pm Anode Cathode Organic substrate PDMS Bacteria
Cross sectional view of a Mf device Microfluidic device
15
2.
Chapter 2: Materials and Methods
2.1. Materials and equipment
This chapter describes the materials and methods used in the present research.
Bacterial strains, culture conditions and characterisation 2.1.1.
The gram negative, rod-shaped motile bacterium Pseudomonas sp. strain CT07 from (Wolfaardt Lab, Ryerson University) was selected based on its biofilm forming capability for BF formation in the MF platform. We choose Pseudomonades because they are benign, have the ability to me-tabolise a variety of nutrients and form robust biofilms. For example, the strain CT07, which we used in this study, was a benign strain cultured from a cooling tower, while, other strains can cause cystic fibrosis46F
47.We used a variant that expressed green fluorescent protein (GFP) as a fluo-rescent protein tag and a non-invasive fluofluo-rescent marker. All strains were maintained as glycerol stocks at –80°C. A pre-culture of planktonic Pseudomonas sp. was used as inoculum for BF for-mation. The suspended culture inoculum was obtained by shaking the cultures of planktonic Pseudomonas sp. in 3 mL of 5 mM growth media at 300 rpm for 18 h at 30°C.
Routine cultivation of the Pseudomonads was carried out in modified AB defined medium47F
48 (fi-nal concentration of 1.51 mM (NH4)2SO4, 3.37 mM Na2HPO4, 2.20 mM KH2PO4, 179 mM NaCl, 0.1 mM MgCl2·6H2O, 0.01 mM CaCl2·2H2O, and 0.001 mM FeCl3with 10 mM Na-citrate·2H2O as the carbon source. Culture ingredients were acquired from Sigma Aldrich and ultrapure water with resistivity of 18.1 MΩ∙cm-1 was used in the preparation of all solutions.
Device fabrication materials and equipment 2.1.2.
Microfluidic device fabrication materials included polydimethylsiloxane (PDMS) (sylgard184, Dow corning, Canada) and glass cover slips (VWR, Mississauga, Canada). We used PDMS elas-tomer because it is suitable for various miniaturised bioassays and is easy to work with. It is im-permeable to water, nontoxic to cells and im-permeable to gas, as opposed to silicon and glass48F
49. PDMS has the ability to irreversibly bond with glass, silicon, and itself after exposure to oxygen plasma due to the addition of reactive oxygen groups at the surface. Oxygen plasma exposure
16
causes temporary change to the surface to hydrophilic, which reverts back to hydrophobic due to the mobility of the elastomeric chains.Transparency of this material allows optical imaging with the high penetration depth, due to the short time exposed to oxygen plasma could be converted to a hydrophilic surface49F
50.
The MF channel features were fabricated by curing the uncrosslinked PDMS polymer against a silicon master mould (FlowJEM Inc., Toronto, Canada). Each level was fabricated separately before they were aligned and bonded. Bonding was achieved by exposing bonding surfaces to air plasma (PCD-001 Harrick Plasma, Ithaca, USA).
Fluidic accessories 2.1.3.
The connection of inlets and outlets were achieved using metal elbow capillaries that fit tightly into the punched inlets without the need for epoxy. Syringe pumps (PHD 2000, Harvard Ap-paratus, and Holliston, MA, USA) were used to inject liquids into the MF inlets. Con-nective tubing was made of perfluoroalkoxy (PFA) with outer diameter 1.6 mm (U-1148, IDEX, WA, USA), which was connected to 60mL syringes (BD Scientific, NJ, USA) via connector assembly (P-200x, P-658, IDEX, WA, USA). Liquids were vacuum degassed before injection to minimise bubble formation on-chip. Liquid delivery tubing was con-nected to the device inlets and outlets via metal elbow capillaries. The entire device was placed in a custom polycarbonate holder which positioned the device with the glass side up for inspec-tion by the upright confocal imaging system. The device was placed cover slip down on an in-verted microscope for imaging in transmission and fluorescence modes.
2.2. Experimental procedures
Microfluidic devices design and fabrication 2.2.1.
a) Photolithography
A silicon template containing microfeatures from a thin layer photoresist (photocurable epoxy SU-8 50, Microchem Inc., MA, USA) was prepared externally based on a computer aided design prepared by our group (Figure 9). The heights of all features on the silicon mould template were 305μm, the width (w) was 2 mm and the main channel length was 32 mm, whereas the small channels had a length of 10 mm.
17
(ii)Soft bake
Figure 9 : Photolithography technique :(i) Deposition of photoresist on a silicon substrate. (ii) Exposure
to UV light through the photomask. (iii) Post development, the UV-cured photoresist layer remains, whereas rest of the layer is washed away. (iv) Processing (etching, deposition etc.).(vi) The remaining resist is stripped51.
b) Reactor design and fabrication
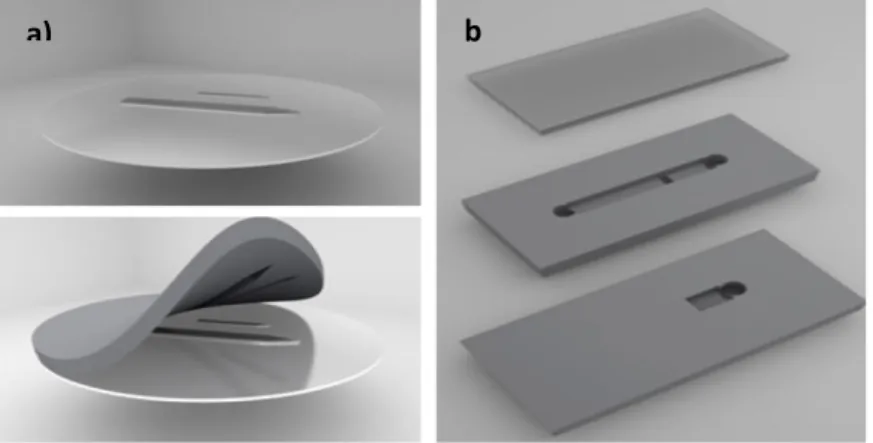
The microfluidic devices were prepared by casting uncured PDMS mixed with a cross-linker in 10:1 proportion (by weight), and poured on the silicon template and heating to 70 oC overnight. After thermal curing PDMS was demolded from the silicon template, the micro fabrication con-tained the features of the microfluidic channel. Each level was fabricated separately before they were aligned and bonded. (Figure10).
Figure 10 : Schematic for (a) a silicon master filled with PDMS and demoulded after, (b) then cutting to
the desire forms used in this study and creation the holes and junction.
18
The MF is shown schematically in Figure 11a. Level 1 included a long measurement channel with length of LM = 32 mm, width of wM = 2000 μm, and a height of hM = 305 μm. An inlet was punched at the upstream end of the measurement channel to introduce the confinement flow phase. Level 2 was aligned above Level 1 and included Inlet 2 for the introduction of the biofilm nutrient solution phase, such as bacteria-laden inoculant, growth media, or coloured liquid for visualisation experiments. The two levels were connected by a cylindrical junction hole that in-jected the biofilm nutrient solution phase into the measurement channel, where it encountered a flow of the confinement liquid, thereby templating biofilm growth. The biofilm templating stream width (wT) and height (hT) were tuned by changing the confinement flow rate and the template flow rate, QC and QT, respectively (Figure.11b, c). In this project we specify the flow rate ratio as QC/QT. The junction was fabricated by punching through the PDMS at known angle (θ) with a punch that yielded a known diameter (d=500 μm) to better specify hydrodynamic flow conditions within the measurement channel. In the results section, we used simulations to exten-sively explore the effect of the angle, θ, on flow template dimensions for different flow rate rati-os (Figure 20). A competing effect between the wT|θ and hT|θ in the range 35 > θ > 90 was noted. However, for θ < 45o we noted a rapid increase in w
T. Since our goal was to maximise the con-finement of the template stream in the vertical and horizontal dimensions, we chose the interme-diate value of θ = 45o. The measurement channel was sealed by a glass coverslip, which enabled observation of the template surface at the opposite microchannel wall using objectives that had working distances of at least 475 μm, the sum of the coverslip thickness and hM. The device was placed cover slip down on an inverted microscope for imaging in transmission and fluorescence modes. The PDMS material is known to support gas diffusion, thereby eliminating concerns that O2 depletion or CO2 accumulation will impact biofilm respiration. Experiments were conducted in a temperature controlled room at 22o +/- 2oC.
19
Figure 11 : (a) Schematic of the two-level device. The small channel in Level 2 (blue) brings the biofilm
nutrient solution template stream to the measurement channel with flow rate QT. The inlet connected to the large (measurement) channel in Level 1 (red) brings the confinement solution with a flow rate of QC. Observation of the measurement channel occurs from the bottom side using an inverted microscope. (b) Schematic view of the cross-section in the y-x plane of the measurement channel with width wM = 2000 μm. Junction diameter, d, was 450 μm, unless stated otherwise. Lateral confinement of biofilm template stream (blue) by the confinement stream (red) results in templated flow with width wT. (c) Schematic view of the z-y cross-section of the measurement channel with height hM = 305 μm and angle θ. Vertical confinement of biofilm template stream results in templated flow with height hT. The biofilm nutrient solution template stream enters the measurement channel from the junction on the PDMS side of the channel. The bottom of the channel is sealed by a glass coverslip (dashed box) with thickness 170 μm. Biofilm cultivation occurs at the template surface (*).
Electroless metal deposition on microchannel walls 2.2.2.
In order to conduct spectral imaging assay the biofilm in MFs (other project in our group), we fabricated a MF bioreactor with strong signal enhancement via electroless deposition of metal (silver and gold) in the bottom of the channel. Surface Enhanced Raman Spectroscopy (SERS) is a useful approach that takes advantage of plasmonic properties of metal nanostructures to
in-QC Inlet QT Inlet
20
crease Raman scattering intensity by orders of magnitude due to strong increases in local electric fields between metal nanostructures.
A) Silver
The bottom and side walls of the of the Level 1 channel were covered with a metallic layer via electroless deposition52. Unlike electrodeposition, this approach enabled deposition against non-conducting PDMS microchannel surface. Electroless deposition of a silver layer was achieved by combining an aqueous solution of glucose, tartaric acid and ethanol with a Tollens reagent. Due to short shelf life, Tollens reagents were made fresh by adding ammonium hydroxide to Ag2O precipitate prepared by mixing silver nitrate solution with sodium hydroxide solution until disso-lution. The bioreactor was masked using an adhesive film (HD Clear, Henkel Corp., Düsseldorf, Germany) such that only the channel section was exposed. Before deposition, the microchannels were treated by air plasma at 600 mTorr at 29.6 W for 90 s in order to increase their hydro-philicity which allowed a better wetting by the aqueous solution. After the reaction was com-plete, the excess solution was removed and the channel was washed with ultrapure water and dried with filtered nitrogen. After deposition, the bottom and side walls of the channel were coated by a matt grey silver film. The mask, which protected the bonding surfaces, was then re-moved leaving silver in the channel only.
B) Gold
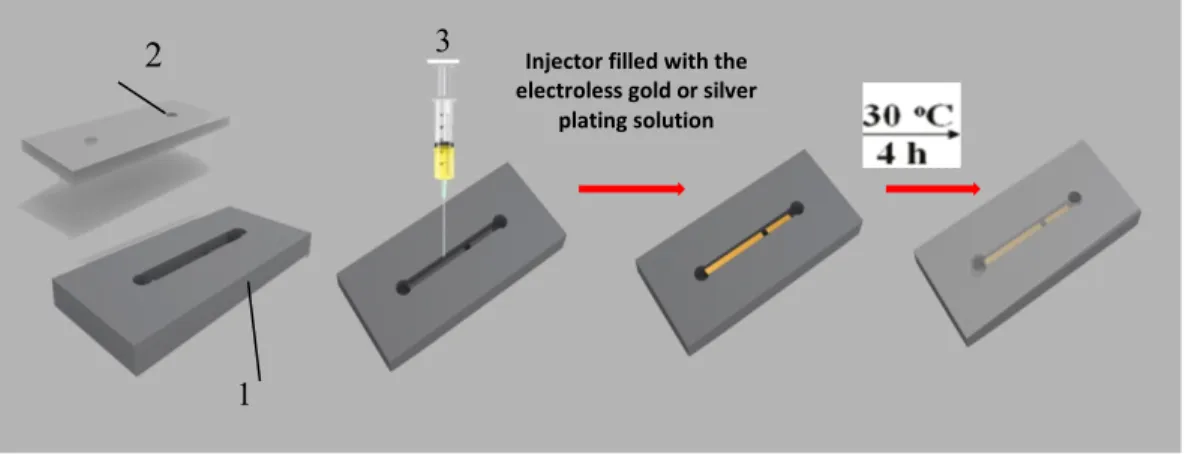
For fabrication of gold film on PDMS we used a plating solution containing 12 mM HAuCl 4H2O, 0.5 M KHCO3, and 25 mM glucose (pH 9.3) that was injected into the square aperture PDMS mold, which jointed with a base PDMS slice, and was kept at 30oC for 4 h to form a gold film on the base PDMS slice as shown in Figure12. Final device after electroless deposition of metal has shown in Figure 13.
21
Figure 12 : Experimental procedure for electroless metal plating on PDMS. (1) PDMS framework; (2)
PDMS base chip; (3) Injector filled with the electroless gold plating solution.
Figure 13:Microscopic images of metal deposition surface on the microchannel (a) Silver metal layer
(b) gold layer deposition in the microchannel. The image was taken in dark field mode. Biofilm cultivation
2.2.3.
The pre-culture of planktonic Pseudomonas sp. was used as inoculum for biofilm formation. The suspended culture inoculum was obtained by shaking the cultures of planktonic Pseudomo-nas sp. in 3 mL of 5 mM growth media at 300 rpm for 18 h at 30 °C. The confinement phase consisted of the same ingredients as the growth media, but the Na-citrate concentration was 0
Silver
Gold
(a)
(b)
1
2 Injector filled with the
electroless gold or silver plating solution
22
mM, which, therefore, did not support biofilm growth. Prior to inoculation, the MF system was disinfected with 70% ethanol for 2 h and then rinsing with sterile distilled water for 1 hour. Dis-tilled water was displaced by flushing with sterile growth medium. Templated inoculation was conducted for 2 h. (Figure 14)
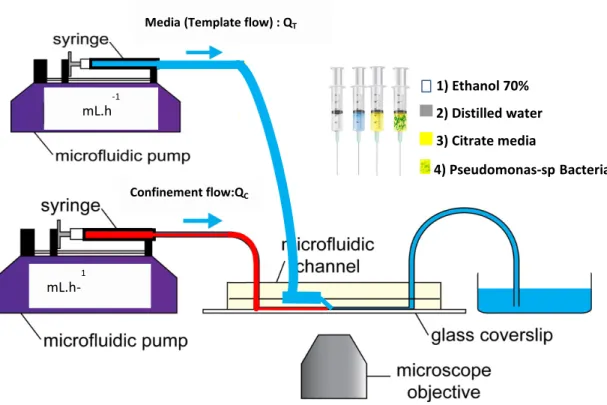
Figure 14 : A schematic of PDMS-glass microchannel and flow equipment, the channels are connected
to the Teflon tubing inserted into the PDMS cast serve as the inlet and outlet connector for liquid deliv-ery and filled with a blue dye for visualisation the template flow (QT) and red dye for visualisation of confinement flow(QC). Pumps used for micro/nanoliter flows injected. Prior to inoculation, the MF sys-tem was disinfected with 70% ethanol for 2 h and then rinsing with sterile distilled water for 1 hour. Dis-tilled water was displaced by flushing with sterile growth medium. Templated inoculation was conduct-ed for 2 h.
Due to the high surface area to volume ratio and due to the fact that the liquid residence time (30 s) was significantly shorter than the maximum specific planktonic growth time of Pseudo-monas sp. CT07 GFP, it was concluded that biofilm formation was strongly favoured over bac-teria growth in the planktonic state53,54. Following inoculation, growth media was templated
1) Ethanol 70% 2) Distilled water 3) Citrate media 4) Pseudomonas-spBacteria mL.h-1 mL.h-1
Media (Template flow) : QT
23 along the same path as the inoculum. Visible biofilm formations were formed after approxi-mately 20-40 h.
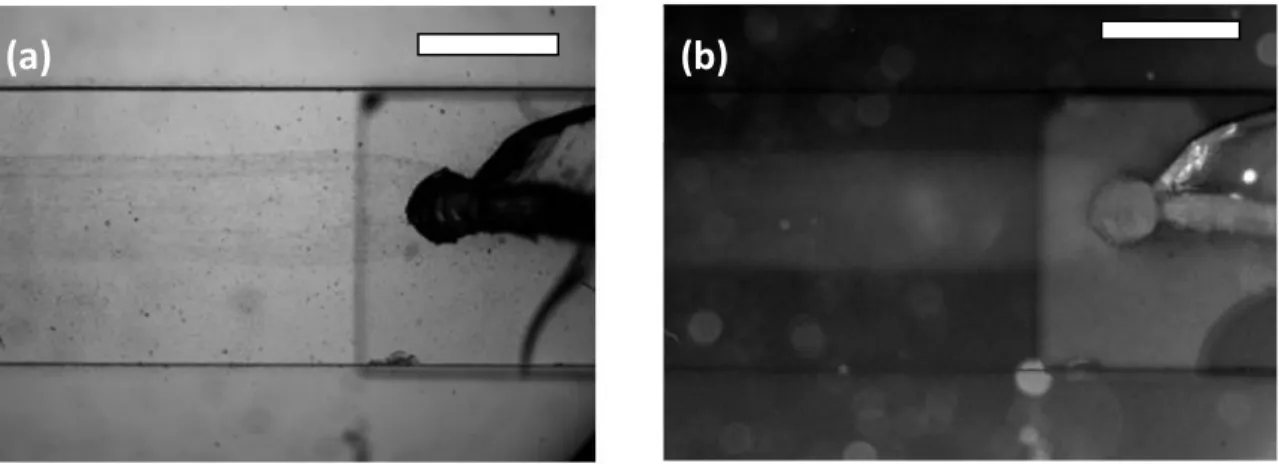
Figure 15 (a) shows a transmission microscope image taken during this process. From the junc-tion output, at the right of the image, a visible stream of planktonic-phase CT07 bacteria co-flowed downstream in a linear pattern, confined by a transparent confinement stream. Flow rates for the confinement and template flow were QC = 0.3 mL·h-1 and QT = 1.75 mL·h-1, re-spectively. This stream was fed by the small channel from Level 2. Figure 15(b) shows the same field of view under the same flow conditions taken in fluorescent mode, demonstrating that live bacteria were contained within the template phase. Here both the stream and Level 2 channel were bright due to the presence of fluorescent CT07-GFP.
Figure 15 : Transmission image of the measurement channel in the vicinity of the junction during
inocula-tion. Bacterial laden inoculant can be seen exiting the junction travelling downstream with flow rate QC = 1.75 mL·h-1, QT = 0.3 mL·h-1 (b) Fluorescent mode image of the same region in (a), under the same flow conditions. The CT07-GFP bacteria are visible in the template flow stream and the Level 2 channel. Scale bar is 1000 μm. Flow is from right to left in both images.
Image analysis of flow patterns, sessile bacteria and adhered biofilms 2.2.4.
Optical densities and physical dimensions of template streams and the micropatterned biofilms were made using open access image analysis software (ImageJ V1.47). In all cases, background corrected images were first analysed along channel cross-sections for their pixel intensities. Of-ten, an average cross-section profile was determined by averaging many profiles in the same vi-cinity. In order to avoid aberrations due to changes to ambient light levels, or low frequency os-cillations in lamp brightness, background images were acquired regularly. For visualisation
24
periments of the template solution, calibration measurements were made with the channel com-pletely filled with the dye solution (McCormick, London, Canada) and then the transparent con-finement phase. The dye concentration was determined by adding 2 drops (measured gravimetri-cally to be approximately 50 μL per drop) per mL of nutrient solution and the limit of detection by in situ transmission microscopy was determined to be equivalent to 0.1 drops per mL. Estima-tion of the template stream vertical path length was made using Beer-Lambert law as discussed in the results section. The maximum and minimum pixel intensities within the channel filled with only clear confinement phase liquid and dye-containing liquid, respectively, were determined in advance to be I max = 2.88 x 10⁴ (arb. units) and Imin = 9.9 x 10⁻³ (arb. units) using background corrected microscope images. In the case that regular background images were not attainable, for example during long-term biofilm growth experiments, normalisation was achieved using a seg-ment of the image outside of the channel. The reduction in transmitted light as a result of biofilm development is expressed as optical density, which is defined here as the absorbance, analogous to the Beer-Lambert law. This definition of optical density has been shown previously to be pro-portional to biofilm mass55.
A selected number of the COMSTAT functions and also the Bioformat macro of the ImageJ were used for the analysis of 3D reconstruction of the biofilm of the z-stack images as obtained from scanning confocal measurements in microchannel: the biovolume of each image stack (μm3 μm−2), the mean thickness of the biofilm (μm) and the biofilm surface area-to-volume ratio (μm2 μm−3). The biofilm surface area (um2) (i.e., the area of the biofilm exposed to the bulk-liquid) was calculated using the results of COMSTAT analysis, by multiplying the biofilm biovolume (μm2 μm−3) by the xy attachment area (101,761 μm2), and the surface area-to-biovolume ratio (μm2 μm−3) for each Z-stack of images. The corresponding values obtained cor-related well with the degree of biofilm development, as seen in the extent of substratum coverage and average biofilm thickness. The values were primarily utilised for qualitative purposes to identify potential relationships between the planktonic cell yield from biofilms and the different shear forces that they are subjected to, and the other hand opening a way to study growth kinetics of biofilm with different hydrodynamic conditions.
25 Colony and cell counting
2.2.5.
Individual biofilm colonies that appeared in microscope images were counted using ImageJ anal-ysis software. A macro was written that analysed each image in a time-series data set, which con-verted 16-bit grey scale images to monochromatic images that identify and count individual bio-film colonies. The macro consisted of steps for background flattening and contrast enhancement with an automatic threshold adjustment. In some cases where devices were reused and remnants of former (non-living) biofilms were present, a background subtraction was applied. An example of the original image and the contrast enhanced image showing detected colonies is shown in Figure 16a and 16b, respectively. The number of colonies was automatically registered for each image in the time-series so that the number of colonies with respect to time could be tracked. The technique is limited to the visible colonies, which in this study were relatively large due to the low power objective used (2x).
Figure 16 : (a) Greyscale microscope image of the biofilm grown under flow rates QC = 0.5 mL·h
-1, QT = 0.3 mL·h-1. (b) High contrast image showing isolated colonies as detected by the image analysis macro. Flow was from right to left.
2.3. In situ characterisation and visualisation techniques of fluidic flow
streams in addition to biofilms
Biofilms are inherently complex and heterogeneous living materials, with properties that change in space and time. In this sense, biofilms are among the most interesting and challeng-ing materials to study analytically56, 57. In this section we describe the approach to characterisa-tion.
26
Computer simulations of flow patterns 2.3.1.
All flow simulations were conducted in three-dimensions (COMSOL Multiphysics) with a fine mesh and physics for laminar flow and transport of dilute species in an incompressible fluidic phase. Molecular diffusion of citrate molecules was simulated using diffusion co-efficient Dcitrate = 6.9 × 10⁻¹⁰ m2·s-1 and we used Ddye = 2.0 × 10⁻¹⁰ m2·s-1 for the diffusion of water solu-ble dye molecules.39
Analytical instrumentation 2.3.2.
The dynamic nature of multiphase microfluidic systems imposes unique requirements on the time resolution of the flow characterization techniques. Table 2 summarises different experi-mental techniques for characterizing microscale multiphase flow as well as the spatial and tem-poral measurement resolutions. Intrusive measurement probes are generally not an option for micro- and nanofluidic systems. Microscopy, the most often used imaging technique, requires direct optical access to the microfluidic network.57F
58
Table 2 : Experimental techniques available to study multiphase flow in microsystems with their spatial
and temporal resolution.58
2.3.2.1. Optical microscopy
a) Bright-field
In this project optical micrographs of the biofilms were acquired using an inverted light micro-scope (Bruker, IX73, MA, USA) with bright-field illumination. Biofilms were recorded at 2x magnification (numerical aperture 0.06) whereas high resolution images of bacteria were
rec-27 orded at 100x magnification (numerical aperture 0.9). Images were collected using an uncooled, monochrome CCD camera (Lumenera Infinity 3-1, Ottawa, Canada).
b) Fluorescence microscopy
If at least one of the liquid phases is fluorescently labeled with an organic dye or other tracer materials, fluorescent microscopy reveals the phase distribution, the shape of the fluid inter-phase, or the local species concentration inside one phase in a multiphase microfluidic network. Here, imaging of green fluorescent protein (GFP) expressing bacteria was conducted on the same instrument using appropriate fluorescent excitation and filter cube.
2.3.2.2. Confocal laser scanning microscopy (CLSM)
Confocal microscopy excludes out-of-plane information in fluorescence measurements and al-lows three-dimensional information to be acquired section by section. The confocal technique used was laser scanning approach, where a laser beam scans the image plane line-by-line and the confocal components determine the height of the plane scanned. The intensity of the generated fluorescence is collected in a photomultiplier tube58.
To study the effect of shear force on biofilms formation in Section 3.2.1.5, we used confocal laser scanning microscopy (CLSM). Time lapse, stack images in the Z-direction of sessile bacteria dur-ing pre-formation of biofilm were captured on an inverted Olympus Confocal microscope (FV1200) over 35 h with 1 h interval time, using a 60x Plan-Fluor oil-immersion objective, with excitation of the green fluorescent protein at 488 nm and detection of emission with a band pass 500-515 filter. All images collected were of dimension (176.13 μm × 176.13 μm) and resolution of 0.60 µm.
The extent of biofilm development in duplicate microfluidic channels in Section 3.3. was exam-ined at 24 hour-intervals with confocal scanning laser microscopy (CLSM, Nikon Eclipse 90i, Mississauga, ON, Canada), using a 40×/0.75 Plan-Fluor objective with excitation of the green fluorescent protein at 488 nm and detection of emission with a band pass 515/30 filter. Ten mi-croscope fields, each with an area of 101,761 μm2 (318 μm × 318 μm), were chosen at random
28
along a central transect starting from the channel inlet, and a stack of images was captured in the z-direction at 0.60 μm intervals and stored for subsequent analysis with COMSTAT.
29
3.
Chapter 3: Results and discussion
3.1. Control of flow template and generation of linear template flow
pat-terns
Generating linear template flow patterns 3.1.1.
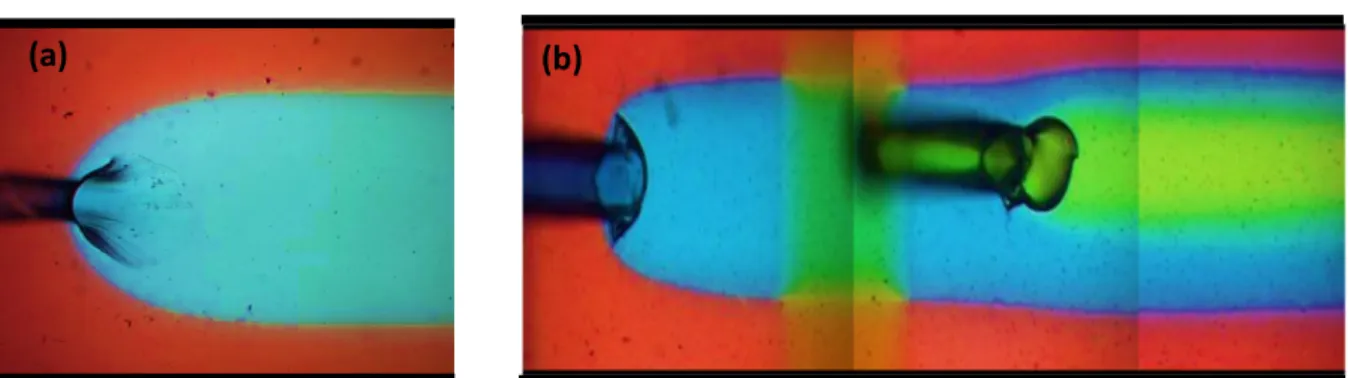
The microchannel environment is well-suited for generating stable co-flowing streams of misci-ble liquids due to suppression of convective mixing59. Upon emerging from the junction channel, the biofilm nutrient solution template stream continued to flow downstream, confined to the cen-tre portion of the PDMS template surface in the measurement channel by the confinement stream. However, preliminary experiments attempting to generate stable template flow patterns demonstrated poor confinement of biofilm nutrient solution due to the interaction between highly diffusive small ions leaving the template solution and other template stream molecules, such as the carbon source (citrate; Figure 17a).We solved this problem by minimising the diffusion-driven flux of small molecules out of the biofilm nutrient solution template phase by eliminating their concentration gradients at the interface between the two streams, as mention in the Section 3.1.2.1. The effect was the strong reduction of mass-transfer between confinement and template streams, resulting in a linear template solution with constant wT (Figure 17b).
Optimisation of flow configuration 3.1.2.
3.1.2.1. Reducing the effect of diffusion on template streams
In order to optimise the stability of the template pattern over long distances, we sought to mini-mise the diffusive mixing, which, according to Fick’s law is proportional to solute diffusivity, D, and the local concentration gradient. Diffusivity of small molecules and ions such as Na+ (DNa+ = 1.3 x10⁻⁹ m2·s-1) or Cl- (DCl- = 2.0 x10⁻⁹ m2·s-1) used in high concentrations in growth solutions, can be significant in comparison to citrate diffusivity of 6.9x10⁻¹⁰ m2·s-1. Furthermore, concentra-tion gradients between the confinement stream and the biofilm precursor template streams can be
30
high due to excellent flow separation in microchannels due to low Reynold’s numbers. Together, these two factors could result in a large flux of molecules out of the biofilm precursor template stream into the confinement stream since the confinement stream did not contain the same highly diffusive species. Moreover, a large flux of highly diffusive molecules can result in the mass-transfer of other, less diffusive, co-dissolved molecules and suspended bacteria. This effect caused the width of the template solution (wT) to expand as it moved down the measurement channel. Preliminary experiments using pure water as the confinement stream always resulted in large mass transfer from the biofilm precursor stream (Figure 17a). One approach to minimise variations in wT was to increase the total flow rate without altering the flow rate ratio QC/QT. This had the effect of limiting the time for diffusion while in the measurement channel because at high velocity carried the liquid flowed through the channel too quickly before diffusion could carry many particles out of the template stream. However, this approach would prevent the utilisation of low flow velocities, which are necessary in order to probe the effect of a wide variety of flow conditions on biofilm growth rates and their properties. A second approach was to reduce the concentration gradients between confinement and template streams. This was accomplished by adding the same solutes with the same concentration to the confinement stream, which were pre-sent in the template stream, with the exception of the carbon source (citrate), which is required to support biofilm growth. As a result, diffusion was visibly reduced, which resulted in the persis-tence of linear template streams down the entire measurement channel even at slow flow rates (Figure 17b). We use the familiar calculation of the Péclet (Pe) number to estimate the channel distance required for complete mixing in the z and x directions for the slowest flow rate (v = 0.36 mm·s-1) used in this study60. Calculated for citrate (D = 6.9 x 10⁻¹⁰ m2·s-1) in the z-direction, us-ing Pez = v·s hM/D and x-direction using Pex=v·s wM/D, with hM = 0.35mm and wM = 2mm, we determined diffusion lengths needed for complete mixing in these two directions should be 0.35 m and 1 m long, respectively. Since the measurement channel length is only 10 mm long, we conclude that the citrate molecules are strongly localized in the template stream throughout the entire length of the measurement channel.