This is an author-deposited version published in :
http://oatao.univ-toulouse.fr/
Eprints ID : 8798
To link to this article : DOI:10.1021/ef300479d
URL :
http://dx.doi.org/10.1021/ef300479d
O
pen
A
rchive
T
OULOUSE
A
rchive
O
uverte (
OATAO
)
OATAO is an open access repository that collects the work of Toulouse researchers and
makes it freely available over the web where possible.
To cite this version :
Sennoune, Mohamed and Salvador, Sylvain and Quintard, Michel
Toward the Control of the Smoldering Front in the
Reaction-Trailing Mode in Oil Shale Semicoke Porous Media
.
(2012)
Energy & Fuels, vol. 26 (n° 6). pp. 3357-3367. ISSN 0887-0624
Any correspondence concerning this service should be sent to the repository
administrator:
[email protected]
Toward the Control of the Smoldering Front in the Reaction-Trailing
Mode in Oil Shale Semicoke Porous Media
M. Sennoune,*
,†S. Salvador,
†and M. Quintard
‡†Université de Toulouse, Mines Albi, CNRS, Centre de RAPSODEE, Campus Jarlard, F-81013 Albi CT cedex 09, France
‡Université de Toulouse, CNRS, IMFT, Allée Camille Soula F-31400, Toulouse, France
ABSTRACT: Results of an experimental investigation on the feasibility of propagating a smoldering front in reaction-trailing mode throughout an oil shale semicoke porous medium are reported. For oil recovery applications, this mode is particularly interesting to avoid low-temperature oxidation reactions, which appear simultaneously with organic matter devolatilization in the reaction-leading mode and are responsible for oxidation of part of the heavy oil. The particularity of this mode is that, contrary to the reaction-leading mode largely studied in the literature, the heat-transfer layer precedes the combustion layer. This leads to two separated high-temperature zones: (i) a devolatilization zone (free of oxygen), where the organic matter is thermally
decomposed to incondensable gases, heavy oil, andfixed carbon, also called coke in the literature, without any oxidation, followed
by (ii) an oxidation zone, where the fixed carbon left by devolatilization is oxidized. The transition from reaction-leading to
reaction-trailing mode was obtained using low oxygen contents in the fed air. It is shown that two distinct layers, the heat-transfer layer and the combustion layer, propagate in a stable and repeatable way. The decrease of the oxygen fraction leads to a decrease
of the smoldering temperature and to strongly limit the decarbonation of the mineral matrix. The CO2emissions are limited.
Regardless of the front temperature, all of the fed oxygen is consumed and all of thefixed carbon is oxidized at the passage of the
smoldering front.
1. INTRODUCTION
Smoldering combustion is a process of importance to a variety of applications, ranging from the recovery of oil from oil reservoirs (in situ combustion) to the processing of materials, such as coal, coke, wood, tar sand, oil shale, and waste products of industrial and agricultural operations. It is a combustion
mode distinctly different from flaming. Indeed, it is
characterized by a dominance of heterogeneous oxidation reactions occurring on the solid surface of the fuel or porous matrix.1In its most simplified form, it involves the combustion of a solid fuel, through the injection of an oxidizer agent.
When ignition occurs at the gas inlet, the smoldering front propagates in the direction of the injected gas, and the process is referred to as forward smoldering combustion. When ignition occurs at the opposite side, the reaction front propagates in the
direction opposite of the gasflow and a process of a backward
smoldering combustion develops. This paper is concerned by forward smoldering combustion.
During the forward smoldering combustion process, there are in reality two combustion layers propagating with constant, although not the same, velocities and separated by a region of constant high temperature called plateau. In the combustion
layer, also called chemical front, fixed carbon (FC) oxidation
occurs, while in the heat-transfer layer, also called thermal front, temperature changes are due to heat transfer between solid and gas. Two structures are possible, depending upon which layer has the greatest speed and, therefore, which layer precedes the other. The classical structure generally encountered in natural and industrial applications involving air and media with small carbon content is called reaction-leading (RL) mode. The velocity of the combustion layer is the greatest of the two velocities; therefore, the combustion layer precedes the
heat-transfer layer. The second structure, which is referred to as an
inverted structure in the combustion literature,2 is called the
reaction-trailing (RT) mode. The velocity of the combustion layer is the smaller of the two layers, so that the heat-transfer layer precedes the combustion layer. The two situations are illustrated in Figure 1. The RT mode is not encountered in classical applications. Only theoretical description was given in the literature.2,3Its feasibility under controlled conditions was not demonstrated, and this was the main motivation for this work.
The transition from the RL mode (classical mode) to the RT mode is theoretically possible and solely depends upon the
value of a parameter δ,3 which can be expressed as follows
according to4 δ = − − C C c c c c pg ps FC in FC out Oin Oout (1)
where Cpgand Cps are the specific heats of the gas and solid, respectively, cFCin and cFCoutare the initial andfinal fractions of the
solid fuel (FC), and cOinand cOinare the initial andfinal fractions
of the gaseous oxidizer (O2).
The RL mode occurs ifδ < 1, and the RT mode occurs if δ >
1. The caseδ =1 separates the two structures and corresponds
to a combustion temperature that is infinite in the approximate
model used to derive eq 1.
The RT mode can be reached via two approaches: the increase of the amount of FC in the porous medium (which is
not a controllable parameter in the case of in situ applications) or the decrease of the fraction of oxygen in the fed gas. The last approach will be adopted in the experimental work presented in this paper.
Before proceeding to the description of the experimental results, we present a brief description, on the basis of a literature review, of the RL and RT modes and discuss the potential advantages and drawbacks of the RT mode in oil shale applications, which represent a very industrial challenge for the next few decades.
1.1. RL Mode. As mentioned briefly in the previous
paragraph, the most encountered structure of smoldering propagation is the RL mode. Many authors have examined this
mode of propagation in different disciplines and for several
materials.5−12Smoldering in oil shale has also interested several authors. Oil shale is a sedimentary rock that contains a solid
organic material embedded in a matrix of fine inorganic
minerals and must be decomposed thermally in classical recovery processes. More recently, with regard to our study,
Martins et al.13 established into details the structure of a
smoldering front propagating in oil shale porous media. Later,
Sennoune et al.14proposed a new approach to reduce the CO2
emissions resulting from the decarbonation of the mineral matrix at the passage of a smoldering front. It consists of varying the composition of the medium in FC and carbonates. 1.2. RT Mode. Only very few works are available in which the RT mode has been studied.
With regard to the experimental side, to our knowledge, the
only carried out works are those presented by Voice and Wild15
for material sintering of applications, where the transition from the RL to the RT mode was obtained by varying the ambient oxygen. They reported that, with 35% of oxygen in the sintering atmosphere, the combustion layer becomes ahead of the heat-transfer layer (RT), so that a relatively low bed temperature is reached. As the proportion of oxygen is decreased, the two layers come closer until, at 9% of oxygen, the highest temperature is obtained. With only 4% of oxygen in the atmosphere, the heat-transfer layer becomes ahead of the
combustion layer and the RL mode is reached, giving a very slow rise in bed temperature and a low peak value.
With regard to the theoretical side, there has been only very limited investigations on the properties of this mode. Schult et al.2reported in their pioneering work that the structure of the RT wave consists of a high-temperature region with a leading heat-transfer layer and a trailing combustion layer, in which the oxygen is consumed and heat is released. The peak temperature
of the smoldering front is affected by the oxygen fraction and
not the gasflux.
According to Lempert et al.,16 the heat released by
combustion is removed by the gasflow in the case of the RT
mode, while in the case of the RL mode, it is removed through
transport in the solid material. These two heatflows determine
the type of the profile of the smoldering wave. In the RT mode,
the gaseous combustion products move through the high-temperature area with a large amount of hot carbon. It leads to complete oxygen depletion as well as forming the zone of endothermic reactions, where carbon dioxide is reduced to monoxide.
On the other hand, Schult et al.2and Lempert et al.16added
that the RT mode can lead to quenching of combustion if the
gas mass influx is large enough; incomplete conversion of
carbon can occur because of cooling of the reaction by the fed gas at the inlet side of the reaction zone.
1.3. Potential Advantages and Drawbacks of the RT Mode in Oil Shale Applications. The RL mode for the combustion of oil shale has been studied extensively by Martins.17In this mode and as illustrated in the top of Figure 1, most of the heat generated during smoldering combustion is left behind the combustion layer and is not used for oil displacement. Five reaction zones successively propagate in the combustion layer: drying zone, a zone of devolatilization, some time called distillation or cracking zone, the zone of low-temperature oxidation (LTO), the zone of FC oxidation also
called high-temperature oxidation (HTO), andfinally, the zone
of CaCO3decarbonation following:
→ +
CaCO3 CaO CO2 (2)
The zone of LTO is superposed with the zone of devolatilization. LTO corresponds to the partial direct oxidation of some oxygenated hydrocarbon. The oxygenated hydrocarbon compounds are formed when the oil molecules
produced during devolatilization fix some unreacted oxygen
coming from the FC zone.18 Generally, oxygen-consuming
reactions that occur at temperatures lower than 350 °C are
considered as LTO reactions. It has been shown that the LTO reactions increase the amount of fuel available as FC for combustion and cause a substantial decline in recoverable oil from the distillation and cracking zones.19Thus, conditions that avoid LTO reactions must be maximized during the in situ combustion of heavy oils.19
In the RT mode (Figure 1b), the heat generated is blown downstream of the combustion layer. The high temperature of the heat-transfer layer is likely to cause a thermal cracking (devolatilization) of the fresh oil shale and to produce oil that will move ahead of the combustion layer, leaving a deposit of FC as fuel for the advancing combustion layer. Because all of the injected oxygen (in fed air) is likely to be consumed in the HTO zone in the combustion layer, it does not have the opportunity to react in LTO reactions with hydrocarbons elsewhere in the medium, especially in the heat-transfer layer. This is the main advantage of this mode.
Considering in situ oil recovery applications, the RT mode presents another advantage. Because the recovery process is essentially associated with the thermal front (cracking, eventual formation of an oil bank, etc.), as soon as the thermal front has crossed all of the zone to be exploited, the process can be stopped. The reaction front is far behind, and the FC will remain non-oxidized in a large zone. This would decrease the
CO2emissions resulting from FC oxidation.
Another potential advantage of the RT propagation mode is its aptitude to cross large bands of inert material that the front
mayfind during propagation. Indeed, the critical time for the
extinction of a smoldering front is when the combustion layer enters inside an inert band. In the RL mode, the front will
definitely extinguish if the inert band is thicker than the FC
layer, which has been shown to be only several millimeters or
centimeters thick.13On the other hand, in the RT mode, when
the combustion layer enters in the inert band, it stops consuming the fed oxygen, which will cross the hot zone downstream, and reignites the reactive layer just downstream of the inert band, if its temperature remains high enough.
Following this, a RT mode theoretically enables the front to cross inert layers as large as the high-temperature plateau, typically several meters thick. This mode of propagation is therefore promising for underground processing of media with heterogeneity between organic and inorganic material.
Theoretically speaking, the RT mode presents the advantage
to offer a temperature control via the oxygen content in the fed
air; this will be demonstrated in the Discussion about an Energy Balance Approach section at the end of the paper. This is one objective of this work to check experimentally this determining question. Indeed, if such a control is possible, on can expect to
propagate“cold fronts” that do not decarbonate all CaCO3in
the medium, which would result in lesser CO2emissions.
Nevertheless, the RT mode may present a drawback in terms
of the required gasflow rate and the resulting pressure drop. In
the RL mode, the front that pushes oil is the combustion layer, while it is the heat-transfer layer that pushes oil in the RT mode
(cf. Figure 1). The heat-transfer layer progresses at a quite small velocity, unless high gasflow rate is injected. As an example, to fix ideas, the velocity of the RL reaction front was about 4 mm min−1in a previous work, where air was fed at 0.021 m s−1in a
medium containing 3.47% FC.14In the RT mode, in the same
medium and injection of a gas at 6.5% oxygen, the present work will show that it would be necessary to increase the gas velocity up to 0.056 m s−1for the heat-transfer layer to progress at the same velocity. Shifting from the RL mode to the RT mode would involve an increase of the pressure drop in the same ratio. This would imply an increase of the required pumping energy to feed the gas, which might be unacceptable.
This paper investigates the feasibility of the RT mode of smoldering combustion. The oil shales were originally chosen as the porous medium because of their energetic interest in oil recovery, as explained before. Experiments were carried out using oil shale semicoke for simplifying purposes, as detailed later. The impact of the oxygen content in the fed gas on smoldering characteristics, such as front temperature,
prop-agation velocities of the different layers, and product gas
release, is investigated.
Particular attention is paid to the fraction of CaCO3that is
decarbonated at the front passage and the fraction of carbon
that is oxidized to CO and not to CO2.
2. EXPERIMENTAL SECTION
The same porous medium and sophisticated experimental device as described in refs 13 and 14 were used to operate smoldering.
2.1. Porous Medium. An oil shale porous medium, originating from the deposit of Timahdit in Morocco, is used in this work. The oil shale isfirst crushed and sieved to obtain sample sizes between 0.5 and 2 mm. Then, the oil shale is retorted at a temperature of 550°C in a stainless-steel reactor externally heated by an electric rig furnace, under N2atmosphere and using a heating rate of 5°C min−1. The obtained
oil shale semicoke was used for all experiments in this work. As explained into details in ref 14, the reasons for using semicoke (SC) instead of oil shale (OS) are that the SC does not lead to oil formation and transport, which is the case with OS. This makes it easy to establish a mass balance.
A horizontal tube furnace was used to characterize the initial OS, the prepared SC, and the solid residue after combustion. Details about the procedures can be found in ref 14.
The SC used in this work contains 6.95% FC; only 0.7% volatile matter remains instead of 14.7% in the initial OS.
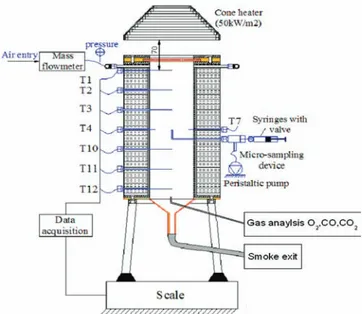
2.2. Combustion Cell. Figure 2 presents the schematic diagram of thefixed-bed reactor used for our combustion tests.
Downward smoldering combustion tests were conducted in a vertical cylindrical combustion chamber of 91 mm inner diameter and a height of 300 mm, containing a mix of 50/50 mass % crushed oil shale semicoke and inert sand. This mix was indeed used as a reference porous medium in ref 14. The smoldering front is started at the top of the sample by a radiative heatflux of 50 kW m−2during 300 s, and the propagation is aided by a forced flow of air. A 1 cm layer of pure semicoke was put at the top of the bed to guarantee a good ignition. The temperature inside the reactor was measured by six thermocouples (T1, T2, T3, T10, T11, and T12) aligned along the axis of the reactor at different heights. The bed mass loss and pressure drop evolutions are recorded. Gas was sampled at the axis of the reactor near the bottom to quantify every 4 min CO and CO2by gas
chromatography and O2using a paramagnetic analyzer in continuous
mode.
After an experiment, the mass evolution of the system and gas composition values are interpreted on the basis of a mass balance for the smoldering front. Two values are derived from these data: the fraction of FC oxidized to CO, frCO, and the CaCO3decarbonated
fraction, frdecarb. Details about the procedure for the RL mode are given
2.3. Present Investigation. The transition from RL to RT mode was obtained by decreasing the oxygen content in the fed air. This was obtained by mixing air with nitrogen. Experiments were conducted with a forced airflow of 0.085 m s−1 at standard temperature and pressure (STP). This flow rate is 4 times as high as previous experiments in the RL mode.14This was adopted to increase the front velocity and to limit the duration of an experiment to around 1.5 h. This leads to classical front propagation velocities. Four molar fractions of oxygen were tested: 3.5, 4.5, 5.3, and 6.5%.
3. RESULTS AND DISCUSSION
Experiments with 6.5, 5.3, and 4.5% oxygen lead to a stable propagation of the combustion front. The experiment with 3.5% oxygen leads to front extinction. This was checked by repeating each experiment twice.
3.1. Temperature Profile. Figure 3 describes the evolution
of the temperature within the column for an oxygen fraction of
5.3%, taken later as a representative example for all
experi-ments. Each profile represents the temperature history at a
specific location along the porous medium, as recorded by a
thermocouple. Only thermocouples T2−T3−T10−T11 were
selected. The temperature profile of thermocouples T1 and
T12 were removed because they correspond to the ignition region and the bottom of the reactor (where heat losses toward the environment are important), respectively.
For each temperature profile, two clear zones of increase and
decrease of the temperature were observed. The zone of temperature increase corresponds to the passage of the heat-transfer layer, of which the velocity is faster than that of the combustion layer in the RT mode. The zone of the temperature decrease corresponds to the region where the fed air cools the medium after the reaction of FC oxidation has occurred. The heat-transfer layer and the zone of temperature decrease are separated by a zone of high but not constant temperature called semi-plateau. This zone is observed spreading out more and more during the smoldering propagation. This structure is characteristic of the RT mode, where a semi-plateau temper-ature appears between two regions corresponding to abrupt changes of the temperature. In previous work involving the RL
mode,14 the semi-plateau was not clearly observed as in the
present.
In RT mode experiments, a temperature peak was recorded. The reason for this is that the fed airflow rate is 4 times higher
here than in previous experiments. Therefore,flattening of the
plateau, which is due to heat losses, is attenuated here compared to the previous RL experiments, because of the higher airflow rate, leading to a higher advective heat flow rate.
The shape of a temperature profile inside the medium, at a
given time, can be obtained qualitatively by inverting left and right the temperature history of a given thermocouple. Doing this with thermocouple T10 leads to Figure 4.
It can be seen in thisfigure that the temperature is higher in
the heat-transfer layer (right) than in the following so-called chemical front (left). This is a surprising observation, if we refer to the theoretical discussion of ref 16, from which the higher temperature zone was expected to be located close to the combustion zone. The only explanation for this is that a
significant part of an exothermic reaction is occurring in the
heat-transfer layer. Because the only exothermic reaction known in the process is FC oxidation, this means that the FC oxidation zone is spread from the upstream of the temperature plateau, where it stops, to the heat-transfer layer downstream of the plateau. The explanation proposed is the following: it is thought that such an organization of the combustion layer and heat-transer layer results from the fact that the oxygen content in the fed air is low and induces
Figure 2.Cell combustion, with continuous gas sampling at the axis.
Figure 3. Typical time evolution of the temperature at several locations at the cell axis (T2, T3, T10, and T11). Experiment with O2
= 5.3 vol %, and air superficial velocity = 0.085 m s−1at STP.
Figure 4. Possible localization of both zones of combustion and decarbonation in the temperature profile.
globally low FC oxidation reaction rates and spreading of the FC oxidation zone. In the heat-transfer layer, the mass fraction of FC is higher than upstream and, despite the presence of the
endothermic decarbonation of CaCO3, results in a high−
medium temperature. Consequently, considering the result of
TG tests of ref 20, indicating that FC oxidation is efficient
starting from a temperature of 400°C, FC oxidation is thought
to expand in all of the zone at a temperature larger than
approximately 400°C. The FC oxidation (combustion zone) is
also thought to stop around the temperature peak. This is a new vision of such fronts. It is illustrated in Figure 4 and will be discussed again later in the paper.
In the samefigure, the location of the decarbonation reaction
is indicated. It will be shown later that not all CaCO3 is
decarbonated at the passage of the front; therefore, this zone is thought to spread all over the medium at a temperature above
550 °C, for which decarbonation is efficient, as suggested by
TG tests.14
The peak temperature obtained for all experiments is plotted in Figure 5 versus the oxygen content in the fed air. The
obtained temperatures are globally lower than the temperatures expected from an energy balance, as discussed in section 3.6.
The heat losses throughout the walls are significant.
A clear increase of the temperature is observed as oxygen
increases, to reach about 820 °C at 6.5% oxygen. It is
demonstrated here that, in the RT mode, the front temperature can be controlled by the amount of oxygen in the fed air. Globally, an increase of 1% oxygen leads to an increase of
approximately 60 °C in the peak temperature. An important
result, for oil recovery applications, is that propagating in situ “cold fronts” is therefore possible in this mode. The RL mode
does not offer this possibility because cold fronts are obtained
by feeding gas with oxygen content larger than 21%, which is more expensive.
Extrapolating the temperature curve to the observed oxygen content leading to extinction, i.e., 3.5%, would lead to a value of
about 600°C. This value is similar to that of the coldest front
that could be propagated in the RL mode by decreasing the content of FC in the medium, i.e., 580°C.14In all experiments, post-combustion analysis of the porous medium indicated that very few FCs were left after the passage of the front (0.25% in the residue). We show here that even cold fronts (a priori
interesting to avoid CaCO3 decarbonation) do not leave FC
behind them. This indicates that quenching of the combustion
front never occurred in all experiments. It was observed in all carried out experiments that the propagation of the smoldering
front consumes all supplied O2. The fact that all oxygen is
consumed even at the temperature of 660°C (the coldest front
in our experiments) is different from what was observed in the
RL mode. From the results of ref 14, a front propagating at this temperature in the RL mode only uses approximately 30% of
the fed oxygen and proportionally slows to the not used O2
fraction. We believe that the reason why the cold front in the RT mode consumes more oxygen (rather than in the RL mode) is that oxygen crosses the large hot zone of the semi-plateau before leaving the front, resulting in a longer contact time with hot FC. This is not the case in the RL mode (cf. Figure 1).
3.2. Front Velocity. In the sequel of the paper, the heat-transfer layer, associated with the temperature increase, and the
temperature decrease layer are by definition located where the
temperature is equal to half of the temperature peak. With this definition, their position versus time is plotted in Figure 6 for
the experiment with the oxygen fraction of 5.3%. If one excludes the points at the beginning of the column, where phenomena are established, and at the very end of the smoldering front propagation, a clear linear relation appears between the position of each layer and time.
The propagation velocities of the two layers, i.e., the curve
slope, are constant but different. To our knowledge, observing
clearly these two layers propagating regularly is a new and original result.
Figure 7 plots the velocities of the heat-transfer and temperature decrease layers obtained during all experiments
with different oxygen fractions. The oxygen fraction for which
extinction was observed is also indicated. The velocity of the
temperature increase layer shows a clear increase with the O2
fraction, while the heat-transfer layer velocity only increases slightly.
3.3. Produced Gases. Figure 8 shows the observed
evolutions of O2, CO, and CO2 mole fractions observed at
the exit of the cell during the stable period of smoldering propagation. Globally, the values are shown to increase with the oxygen fraction in the fed air, which indicates that the
smoldering combustion is in the oxygen-limited regime.21As
already mentioned in the paper, the oxygen is totally consumed
Figure 5.Peak temperature versus oxygen fraction in the fed air. Figure 6. Position of the heat-transfer zone and the temperature decrease zone vesus time.
during all experiments; its fraction is equal to zero, up to measurement accuracy, in the exit gas regardless of the oxygen fraction in the fed air.
As discussed before, all of the FC was also consumed in all experiments carried out in this work. In this situation, the chemical front velocity is theoretically directly linked to three
parameters: the amount of FC in the medium, theflow rate of
oxygen fed to the front, and the frCO parameter that appears in the stoichiometric reaction.
+ − − → + − ⎡ ⎣⎢ ⎤ ⎦⎥ C frCO 2 (1 frCO) O frCO CO (1 frCO)CO 2 2 (3)
This later parameter, frCO, is a consequence of the phenomena taking place in the porous medium.
The fractions of CO and CO2do not increase linearly with
the oxygen fraction. CO was observed to increase in a faster
way, and CO2was observed to increase in a less fast way; this
indicates that the parameter frCO has probably increased in the experiments where oxygen was increased. This point will be discussed again later in this paper.
3.4. Identification of the Fraction of FC Oxidized to
CO and the CaCO3 Decarbonated Fraction. In a previous
work related to experiments in the RL mode,14it was shown
that a parameter identification procedure, on the basis of a mass
balance for the combustion cell, can be used to determine the values of the fraction of carbon oxidized to CO, frCO, and the
decarbonated fraction, frdecarb. This was performed
simulta-neously with the identification of the two front (thermal and
chemical) velocities, which were the same because of the presence of a single temperature peak, where the two fronts were grouped together.
In the present work involving the RT mode, a clear
temperature semi-plateau appears. Thefirst attempt to identify
frCO and frdecarbwas based on the assumption that the thermal
front corresponds to the temperature increase zone and the chemical front is located at the temperature decrease zone. The velocities of the temperature increase and temperature decrease zones were determined as explained before using the thermocouple signals. The thermal front velocity and the chemical front velocity were assimilated to them. Under this assumption, it is not possible tofind a value for frCO and frdecarb leading to a correct mass balance; large quantities of O2(several
percentages) were always left in theflue gas according to the
mass balance, when all O2is consumed in the experiments.
The second attempt was to try and identify both the thermal front velocity and the chemical front velocity together with
frCO and frdecarb. This approach was not successful; there are
not enough data to identify four parameters, and nonphysical solutions were derived.
The third attempt was to consider that the thermal front was located at the temperature increase zone, thus, propagating at the same velocity, but that the velocity of the chemical front
had to be identified. Doing this led to satisfactory mass
balances, as reported below. It is interesting to note that the
identified chemical front velocities were 1 mm min−1 higher
than the temperature decrease zone velocity but always smaller than the temperature increase zone velocity (or thermal front).
This confirms the point previously mentioned: the chemical
front is probably not concentrated at the temperature decrease zone but probably spread toward the thermal front. The
identified values for frCO and frdecarb derived from the
parameter identification procedure are plotted in Figure 9 versus the oxygen fraction in the fed air. The results are commented below. The frCO parameter increases regularly
with oxygen fraction from 0.29 at 4.5% O2, where the front
temperature was about 660°C, to 0.43 at 6.5% O2, where the
front temperature was about 820 °C. This confirms
quantitatively the previous indication (see Figure 8) of the
Figure 7.Velocities of the temperature decrease layer and the heat-transfer layer versus oxygen fraction in the fed air.
Figure 8. O2, CO, and CO2 concentrations in flue gas versus O2
concentration in the fed air.
Figure 9.Identified values for the fraction of carbon oxidized to CO and the fraction of CaCO3decarbonated.
increase of frCO. The same tendency of the frCO increase with the front temperature increase was observed in previous work in the RL mode. The range of values is slightly higher in the RT
mode (0.29−0.43) than in the RL mode (0.19−0.35).
Figure 9 also gives the identified decarbonated fraction of
CaCO3as a function of the oxygen fraction. A decrease of the
decarbonated fraction was observed from 63 to 37% by decreasing the oxygen fraction in the fed air. This result is very important and represents one of the main objectives of this work. Indeed, it is possible to propagate a smoldering front in
the RT mode at 660°C by feeding it with 4.5% oxygen, and
only 37% of the present CaCO3 will be decarbonated at the
passage of the front.
3.5. Localization of the FC Oxidation and the CaCO3
Decarbonation Zones. The question of an eventual spread-ing of the FC oxidation zone has been raised in this paper. The
same question is asked concerning the CaCO3 decarbonation
zone location and its thickness. A new and original gas microsampling system with online gas analysis was set up and experimented.
The idea is to follow the variation of the fractions of O2and
CO2in the gas phase before, during, and after the passage of
the smoldering front. The thickness and localization of the FC
oxidation and the CaCO3 decarbonation zones were
determined consequently.
The gas were sucked at the center of the reactor through a 1.6 mm internal diameter tube. A paramagnetic analyzer was used to analyze the oxygen, and a nondispersive infrared (NDIR) analyzer was used to analyze the carbon dioxide. The
sampled flow rate was fixed at 0.60 L min−1 at STP,
corresponding approximately to 55 times less than the flow
rate fed to the combustion cell (33.2 L min−1 at STP), to
minimize the perturbation of the front. To obtain this, the
analyzers sucked 1.60 L min−1at STP, which consisted of 1 L
min−1at STP of N2fed from a massflow meter/controller and
0.60 L min−1 at STP sampled in the cell. Therefore, the
measured O2and CO2fractions were divided by 2.67 compared
to that in the sampled gas. The CO fraction was not reported here because it saturated the NDIR analyzer.
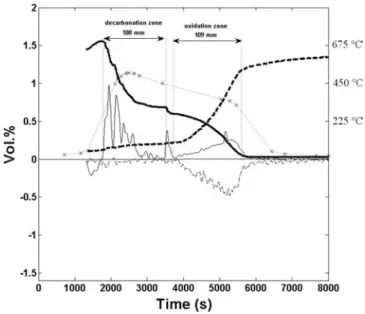
Figure 10 plots the time evolution of the oxygen and carbon
dioxide fractions versus time for the experiment with 5.3% O2.
For better interpretation of the results, the oxygen and carbon dioxide fractions were time-derived and also plotted in Figure 10. Finally, for indication, a reconstituted temperature at the sampling point was added. Because there is no thermocouple at the microsampling point situated at the center of the cell, the plotted temperature is an average between the upstream temperature (T3) and downstream temperature (T10) of the sampling points.
At the beginning of the experiment, the front is upstream of
the sampling point. The oxygen fraction close to zero confirms
that oxygen was used during the smoldering front propagation. An unstable value of the carbon dioxide fraction was observed near 1.5%.
Two zones of CO2decrease were then observed: (i) thefirst
zone, between 1780 and 3515 s, in which a rapid decrease of
the CO2fraction from 1.5 to 0.74% was observed (this decrease
can be attributed to the passage of the CaCO3decarbonation
zone, where CO2 was produced), and (ii) a second zone,
between 3725 and 5600 s, where the CO2fraction decreases
more slowly from 0.74 to 0% (in this zone, the oxygen fraction
increased proportionally to the decrease of CO2, which
indicates that this zone corresponds to the main FC oxidation zone).
Afterward, both decarbonation and FC oxidation zone thicknesses were estimated using the transition time and the considered layer velocity, as determined before. Both the decarbonation zone and the FC oxidation zone have a thickness
of about 110 mm. This confirms the fact that both zones are
displayed in the space.
In the so-called decarbonation zone, a slight evolution of the
O2fraction can be observed. This indicates that some oxidation
of carbon occurs in this zone. This combustion may explain the fact that the peak temperature is located in the endothermic
decarbonation zone, as discussed in the Temperature Profile
section of the paper.
A remarkable thin zone of abrupt CO2decrease was observed
between 3515 and 3725 s. The phenomenon was observed again when repeating the experiment. In this time period, only a slight oxygen fraction increase is observed. Therefore, it is not thought that any oxidation (of FC or gaseous CO) is at the origin of this peak. The proposed explanation is that the decarbonation reaction may abruptly change rate because the
parameters that control the reaction kinetics vary significantly
around this zone. These parameters are the temperature and partial pressure of CO2.
They both have a nonlinear impact on the reaction kinetics referring to the works of refs 21 and 22. The changes in these parameters may also be responsible for the peaks in the time derivative curve for the CO2fraction in the decarbonation zone. No clear conclusion can nevertheless be formulated at this stage.
The obtained O2 fraction evolution can also be used to
discuss the probability for LTO to occur in the case of smoldering in oil shales. In the RT mode, as discussed before and illustrated in Figure 1, LTO reactions may occur near the devolatilization zone, which corresponds here to the temper-ature increase zone located at short times in Figure 10. We show here that, in this zone, the amount of O2is very small, less
than 0.6% (in the nondiluted sample). This is likely to minimize the progress of LTO reactions.
Figure 10. Time evolution of the fractions of oxygen (bold dotted line) and carbon dioxide (bold solid line), derivative curves of oxygen (dotted line) and carbon dioxide (solid line) signals, and temperature profile (cross symbols).
3.6. Discussion about an Energy Balance Approach. In
a previous paper,14we have shown that establishing an energy
balance for the two propagation layers in the RL mode enabled us to calculate a theoretical plateau temperature. Confronting the theoretical values to experimental values obtained for a large range of porous medium composition in terms of FC
content and CaCO3content indicated that this approach was
not accurate but followed the trends observed experimentally.
The difference between a calculated plateau temperature and an
experimental value was typically 250 °C. The energy balance
approach is applied here to the RT mode as detailed below and brings several interesting indications. Details of the equations used to calculate the plateau temperature from an energy balance in the RT mode are reported in the Appendix.
We have plotted in Figure 11a the theoretical evolution of the plateau temperature versus the fraction of oxygen in the fed
air for a medium containing 3.47% FC and 22.4% CaCO3as the
one used in experiments. This graph confirms that oxygen content is theoretically a parameter controlling the front temperature, and this motivated the present work. It is also particularly interesting for in situ applications; the temperature of the front can theoretically be controlled via this parameter, with oxygen contents smaller than that in air. Note that, in the RL mode, this parameter cannot be used practically to lower the front temperature because this would require the use of oxygen-enriched air.
In Figure 11b, we have plotted the plateau temperature versus two parameters that characterize the porous medium in
which the front is propagated: the FC content, whose oxidation supports the chemical front progress, and the amount of
CaCO3that is decarbonated at the passage of the front, which
acts as a heat sink. In the case of the RL mode, the composition of the medium can strongly impact the plateau temperature (Figure 11c); this was checked experimentally in ref 14. In the case of the RT mode, the energy balance indicates that the
plateau temperature is poorly influenced by the composition of
media containing more than 3% FC. This may have important consequences for in situ applications; it tends to demonstrate that a RT smoldering front could be more robust than a RL smoldering front, because the RT front plateau temperature will not change as the composition of the porous medium changes
from one location to another in the field. This nevertheless
remains to be demonstrated experimentally.
Finally, the theoretical plateau temperature corresponding to each case experimented in this work was calculated and compared to experimental values. It was found that the experimental values are much smaller than the calculated
values. Differences were typically 1500 °C, much larger than in
the previous study of the RL mode.14 The explanation
proposed here is that, for experiments in the RT mode, the FC oxidation zone spreads over a large zone and results in very important heat losses and a temperature decrease. In the case of the RL mode, this problem was avoided because the FC oxidation was concentrated at a thin temperature peak and induced much less heat losses. At this stage, further
Figure 11.Theoretical temperature of the front in the RT mode versus (a) the molar fraction of oxygen in the fed air, and (b) the medium composition in FC and CaCO3of the porous medium. (c) Results in RL mode are reminded. The reference conditions for all cases are 3.5% FC,
experimental investigations are required to validate this explanation.
4. CONCLUSION
The main goal of this work was to investigate the feasibility of propagating a smoldering front in the RT mode in oil shale or semicoke porous media. We showed that it is possible to
propagate the smoldering front with different oxygen fractions
in a stable and repeatable way. A low limit value of the oxygen
fraction has been identified at 3.5%, leading to extinction. The
observed temperature profiles and velocities correspond
qualitatively to those theoretically characterizing the RT mode. We showed that the front temperature can be controlled by the oxygen content in the fed gas; an increase of 1% of
oxygen leads to an increase of approximately 60°C in the peak
temperature.
The smoldering velocity is also a consequence of oxygen availability. The combustion layer velocity increases from 2.4 to
4.26 mm min−1by increasing the oxygen fraction from 4.5 to
6.5%.
Thanks to the microsampling and analysis device, the combustion layer is shown not to be concentrated at the upstream of the plateau but to spread over a large zone of 110 mm. This RT mode leads to strongly limit the in situ decarbonation. Decarbonated fractions as low as 80 and 44% are obtained with oxygen fractions from 6.5 to 4.5%, respectively, when, in the RL mode, full decarbonation was observed. The decarbonation zone is also shown to spread over a large zone. Even in the case of the coldest front at 660°C, all of the fed oxygen is consumed, contrary to the case of the RL mode. All of the FC in the medium was found to oxidize. The fraction of FC oxidized into CO was evaluated between 0.29 and 0.43. This percentage increases with the temperature, as in the case of the RL mode.
We also showed that LTO reactions should be minimized in the case of smoldering in oil shales because only very few oxygen compounds are present in the zone where devolatiliza-tion occurs.
■
APPENDIXCalculation of the plateau temperature from an energy balance over a smoldering front, for the case of the RT mode (δ > 1).
A representation of a smoldering front in the RT mode (δ >
1) is given in Figure 12. A general case is considered here, in which the virgin medium called fuel will form smoke during
combustion of FC and CO2because of decarbonation of the
mineral matrix. The decarbonation reaction is assumed to occur at the heat-transfer layer. The combustion layer travels at a velocity lower than the heat-transfer layer velocity. Therefore
δ = v >
v 1
frt
frc (4)
Combustion Layer Velocity,vfrc
The velocity of the combustion layer can be calculated from a
balance on O2species, expressing that the molar flux density
consumed by the reaction equals the molarflux transported by
air.20
The molar flux density of FC oxidized by the combustion
layer is (in mol s−1m−2) ρ v x M fr frc fu FC oxi C (5)
The FC oxidation to CO and CO2is written
+ − − → + − ⎡ ⎣⎢ ⎤ ⎦⎥ C frCO 2 (1 frCO) O frCO CO (1 frCO)CO 2 2 (6)
Therefore, the oxidation of 1 mol of C requires (1− frCO/2)
mol of O2, and the molar flux density of O2required by the
combustion layer can be expressed as (in mol s−1m−2)
ρ − ⎜ ⎟ ⎛ ⎝ ⎞⎠ v x M fr 1 frCO 2 frc fu FC oxi C (7)
The molarflux density of air fed to the combustion layer is
ρ v M
g g
g (8)
and, using the molar fraction of O2in the air yO2, the molarflux
density of O2fed to the combustion layer is
ρ v M y
g g
g O2 (9)
Equating eqs 7 and 9, we have
ρ ρ = −
(
)
v v M y M x fr 1 frc g g g O C fu FC oxi frCO 2 2 (10)Heat-Transfer Layer Velocity,vfrt
A thermal balance over the heat-transfer layer can be written as
̇ − + ̇ − − ̇ − − ̇ − − ̇ − − ̇ Δ = m C T T m C T T m C T T m C T T m C T T m H ( ) ( ) ( ) ( ) ( ) 0
sm p p ref fu p amb ref dec p p ref sm p amb ref CO p amb ref CaCO CaCO
sm fu
dec sm 2
CO2 3 3
(11)
where Trefis a reference temperature. The calorific value for SC
and solid residue wasfixed at 830 J kg−1K−1.
Taking Tambas the reference temperature leads to
̇ − − ̇ − − ̇ Δ = m C T T m C T T m H ( ) ( ) 0
sm p p amb dec p p ref CaCO CaCO sm dec 3 3 (12) where ρ ̇ =
mCaCO vfrt fu CaCO decarbx fr
3 3
ρ ̇ =
mdec vfrt fu decarbfr
= − + + + ⎣ ⎢ ⎢ ⎤ ⎦ ⎥ ⎥ x x M M x x
frdec CaCO(1 frdecarb) CaCOfrdecarb CaO
CaCO FC in 3 3 3 and ρ ̇ = msm g gv = Cp Cp sm g
Then, we may write
ρ ρ = ̇ − − + Δ v m C T T C T T x H ( ) fr ( ) fr frt sm p p amb
fu decarb p p amb fu CaCO decarb CaCO
sm
dec 3 3
(13)
Plateau Temperature
The thermal balance over the combustion layer can be written as ̇ − + ̇ − + ̇ Δ − ̇ − − ̇ − = m C T T m C T T m H m C T T m C T T ( ) ( ) ( ) ( ) 0
g p amb ref dec p p ref FC FC res p amb ref sm p p ref
g dec
res sm
(14)
Taking Tpas the reference temperature leads to
̇ − + ̇ Δ − ̇ − =
m C Tg p( amb Tp) mFC HFC m Cres p (Tp Tref) 0
g res (15) or = ̇ Δ ̇ − ̇ + T m H m C m C T p FC FC g p res p amb g res (16) where ρ ̇ = mFC vfrc fu FCx ρ ̇ = − mg (vg vfrc)g
because we have vfrc≪ vg, then ṁg= vgρg
ρ ̇ = mres vfrc fu resfr = − + + ⎡ ⎣ ⎢ ⎢ ⎤ ⎦ ⎥ ⎥ x x M M x
frres CaCO(1 frdecarb) CaCOfrdecarb CaO
CaCO in
3 3
3
Heat of reactions:
The FC oxidation reaction may be written as
+ − − → + − ⎡ ⎣⎢ ⎤⎦⎥ C frCO 2 (1 frCO) O frCO CO (1 frCO)CO 2 2 (17)
According to Hess’s law, we have (with our sign definition)
ΔHFC=110.5frCO+ 396.5(1−frCO) kJ mol−1
The decarbonation reaction may be written as
→ +
CaCO3 0.56CaO 0.44CO2 (18)
According to Hess’s law, we have (with our sign definition)
Δ = − − + = + − H 635.1 393.5 1207 178.4 kJ mol CaCO CaCO 1 3 3
■
AUTHOR INFORMATION Corresponding Author *E-mail: [email protected]. NotesThe authors declare no competingfinancial interest.
■
ACKNOWLEDGMENTSThe authors are most grateful to Bernard Auduc for his technical support during all experiments.
■
NOMENCLATUREComponents
C = carbon
CaCO3= calcium carbonate
FC =fixed carbon
in = inert
Greek Symbols
δ = ratio between thermal and chemical front velocities
ρ = volumetric mass (kg m−3)
Others
frc = chemical front frt = thermal front
Physical Symbols
ṁ = mass flow rate in the front frame (kg s−1)
ΔH = reaction heat (J mol−1)
Cp= calorific capacity (J kg−1K−1) fr = fraction
frCO = fraction of FC oxidized into CO
M = molar mass (g mol−1)
p = plateau T = temperature (°C) v = velocity (m s−1) y = molar fraction Reactions decarb = decarbonated oxi = oxidized carbon
Subscript Materials
fu = fuel g = gas
res = solid residue sm = smoke
dec = decarbonated fuel
■
REFERENCES(1) Rein, G. Smouldering combustion phenomena in science and technology. Int. Rev. Chem. Eng. 2009, 1 (1), 3−18.
(2) Schult, D.; Matkowsky, B.; Volpert, V.; Fernandez-Pello, A. Forced forward smolder combustion. Combust. Flame 1996, 104 (1− 2), 1−26.
(3) Aldushin, A.; Rumanov, I.; Matkowsky, B. Maximal energy accumulation in a superadiabaticfiltration combustion wave. Combust. Flame 1999, 118 (1−2), 76−90.
(4) Elayeb, M. Modélisation à l’échelle microscopique de transports avec réaction en milieu poreux: Combustion en lit fixe. Ph.D. Thesis, Université de Poitiers, Poitiers, France, 2008.
(5) Egerton, A.; Gugan, K.; Weinberg, F. The mechanism of smouldering in cigarettes. Combust. Flame 1963, 7, 63−78.
(6) Torero, J.; Fernandez-Pello, A. Forward smolder of polyurethane foam in a forced airflow. Combust. Flame 1996, 106 (1−2), 89−109. (7) Carvalho, E. R.; Gurgel Veras, C. A.; Carvalho, J. A., Jr. Experimental investigation of smouldering in biomass. Biomass Bioenergy 2002, 22 (4), 283−294.
(8) Vantelon, J.; Lodeho, B.; Pignoux, S.; Ellzey, J.; Torero, J. Experimental observations on the thermal degradation of a porous bed of tires. Proc. Combust. Inst. 2005, 30 (2), 2239−2246.
(9) Zhou, H.; Jensen, A.; Glarborg, P.; Jensen, P.; Kavaliauskas, A. Numerical modeling of straw combustion in afixed bed. Fuel 2005, 84 (4), 389−403.
(10) Ryu, C.; Phan, A.; Yang, Y.; Sharifi, V.; Swithenbank, J. Ignition and burning rates of segregated waste combustion in packed beds. Waste Manage. 2007, 27 (6), 802−810.
(11) Pironi, P.; Switzer, C.; Rein, G.; Fuentes, A.; Gerhard, J.; Torero, J. Small-scale forward smouldering experiments for remediation of coal tar in inert media. Proc. Combust. Inst. 2009, 32 (2), 1957−1964.
(12) Rein, G.; Cohen, S.; Simeoni, A. Carbon emissions from smouldering peat in shallow and strong fronts. Proc. Combust. Inst. 2009, 32 (2), 2489−2496.
(13) Martins, M.; Salvador, S.; Thovert, J.; Debenest, G. Co-current combustion of oil shalePart 2: Structure of the combustion front. Fuel 2010, 89 (1), 133−143.
(14) Sennoune, M.; Salvador, S.; Quintard, M. Reducing CO2
emissions from oil shale semicoke smoldering combustion by varying the carbonate andfixed carbon contents. Combust. Flame 2011, 158 (11), 2272−2282.
(15) Voice, E.; Wild, R. Importance of heat transfer and combustion in sintering. Iron Coal Trades Rev. 1957, 175, 841−850.
(16) Lempert, D.; Glazov, S.; Manelis, G. Mass transfer infiltration combustion processes. In Mass Transfer in Multiphase Systems and Its Applications; El-Amin, M., Ed.; InTech: Rijeka, Croatia, 2011; Chapter 21, pp 483−498.
(17) Martins, F. The structure of a combustion front propagating in a fixed bed of crushed oil shale: Co-current configuration. Ph.D. Thesis, Université de Toulouse, Toulouse, France, 2008.
(18) Sarathi, P. In-Situ Combustion HandbookPrinciples and Practices, Technical Report; National Petroleum Technology Office: Tulsa, OK, 1999; DOE/PC/91008-0374.
(19) Martins, M.; Salvador, S.; Thovert, J.; Debenest, G. Co-current combustion of oil shalePart 1: Characterization of the solid and gaseous products. Fuel 2010, 89 (1), 144−151.
(20) Ohlemiller, T. Modeling of smoldering combustion propagation. Prog. Energy Combust. Sci. 1985, 11 (4), 277−310.
(21) Rao, T.; Gunn, D.; Bowen, J. Kinetics of calcium carbonate decomposition. Chem. Eng. Res. Des. 1989, 67 (1), 38−47.
(22) Garcia-Labiano, F.; Abad, A.; De Diego, L.; Gayán, P.; Adánez, J. Calcination of calcium-based sorbents at pressure in a broad range of CO2concentrations. Chem. Eng. Sci. 2002, 57 (13), 2381−2393.