Science Arts & Métiers (SAM)
is an open access repository that collects the work of Arts et Métiers Institute of Technology researchers and makes it freely available over the web where possible.
This is an author-deposited version published in: https://sam.ensam.eu Handle ID: .http://hdl.handle.net/10985/12595
To cite this version :
Sébastien JEGOU, Myriam DUMONT, Laurent BARRALLIER - Determination of the volume fraction of precipitates in a nitrided Fe- 0.354 wt% C-2.93 wt% Cr model alloy by anomalous small angle X-ray scattering - Materials Characterization - Vol. 135, p.134-138 - 2018
Any correspondence concerning this service should be sent to the repository Administrator : archiveouverte@ensam.eu
Title: Determination of the volume fraction of precipitates in a nitrided Fe-‐‑0.354wt.%C-‐‑ 1
2.93wt.%Cr model alloy by anomalous small angle X-‐‑ray scattering 2
3
Authors: S. Jégoua, M. Dumontb,*, L. Barralliera
4 5
a Arts et Métiers ParisTech, MSMP laboratory, 2 cours des Arts et Métiers, F-‐‑13617 Aix-‐‑
6
en-‐‑Provence, France 7
b Aix Marseille Univ, Univ Toulon, CNRS, IM2NP, Marseille, France
8 9 10
*corresponding author: Dr. Myriam Dumont 11 Phone: +33 4 91 28 90 09 12 Fax: +33 4 91 28 28 86 13 e-mail: myriam.dumont@univ-amu.fr 14 Postal address: 15 Myriam Dumont 16
IM2NP – UMR CNRS 7334 – Aix-Marseille Université 17
Faculté des Sciences et Techniques de St-Jérôme – Service 251 18 13 397 Marseille Cedex 20 19 France 20 21 22 23
Abstract: 24
Anomalous small angle scattering (ASAXS) is a powerful non-‐‑destructive technique that 25
can provide characteristic features of nanoscale precipitates such as the volume fraction, 26
and chemical composition. In this paper, the technique is used for the first time to explore 27
nanoscale MN nitrides (M = Cr,Fe) after nitriding of a model iron alloy (Fe-‐‑0.354wt.%C-‐‑ 28 2.93wt.%Cr). 29 30 Keywords: 31
Steel; Nitriding; Nitrides; Synchrotron radiation; Anomalous small angle scattering. 32
33
1. Introduction 34
Anomalous small-‐‑angle X-‐‑ray scattering (ASAXS) is a powerful technique that combines 35
the capability of SAXS to characterize the size distribution of nano-‐‑objects embedded in a 36
matrix and the variation in contrast allowed by tunable wavelength of the Synchrotron 37
incident X-‐‑ray beam, giving access to information about the composition of scattering 38
nano-‐‑objects [1-‐‑2] . 39
In this study, ASAXS technique is applied to characterize precipitates in a ternary Fe-‐‑Cr-‐‑C 40
nitrided steel. Nitriding is a surface engineering process applied to enhance surface 41
properties such as corrosion, wear and fatigue resistance [3-‐‑4]. Gaseous nitriding consists 42
in the diffusion of nitrogen atoms through the surface of steels from the dissociation of a 43
nitrogen rich atmosphere (gas or plasma) at the atmosphere/solid interface [5]. It results 44
in the formation of an iron nitride layer (Fe4N and/or Fe2-‐‑3N) and a diffusion zone where
45
nitrogen is found as solid solution in the ferritic matrix and combined as MeN (Me = Cr, V, 46
Al…) nitrides with alloying elements having high affinity with nitrogen such as chromium, 47
aluminium or vanadium [6]. The volume fraction of MN nitrides formed in the diffusion 48
layer is of prime importance for requested surface properties. In fact this affects the 49
resulting hardness; moreover the volume change induced by precipitation takes part to 50
the generation of compressive residual stresses [7]. 51
In the case of binary Fe-‐‑Me (Me=Cr, Al or V) alloy, formed nitrides are close to pure MeN 52
phase having a fcc NaCl-‐‑type structure [5]. In the case of C-‐‑containing ternary Fe-‐‑Cr-‐‑C, 53
pre-‐‑existing carbides (generally M23C6 or M7C3, M=Fe or Cr) are expected to dissolve due
54
to a lower stability as compared to nitrides [8]. Therefore nitrides are formed either by 55
direct formation by reaction with Cr remaining in solid solution or by transformation of 56
carbides [9]. Carbon is then rejected toward grain boundaries where it forms coarse 57
cementite aggregates [10] or towards the diffusion front where it participates to the 58
coarsening of carbides. 59
This paper aims at using small-‐‑angle scattering to characterize MN nitrides in the 60
diffusion layer after gas nitriding of a model ternary Fe-‐‑Cr-‐‑C alloy (Fe-‐‑0.354wt.%C-‐‑ 61
2.93wt.%Cr). The major goal is the determination of the volume fraction of nitrides that 62
is the key parameter for resulting surface properties. However the volume fraction cannot 63
be determined by SAXS independently of the composition of the nano-‐‑precipitates. Using 64
anomalous dispersion effect, ASAXS is an element-‐‑selective technique based on the 65
anomalous variation of the scattering factor near the absorption edge of one chosen 66
element, therefore it allows to overcome this difficulty by giving access to the chemical 67
information, allowing the determination of the volume fraction of scattering precipitates 68
[11]. Results are discussed with respect to the literature and thermodynamics 69
calculations performed using the Thermo-‐‑Calc software [12]. 70
71
2. Materials and experimental methods 72
2.1. Materials and microstructural characterization 73
A Fe-‐‑0.354wt.%C-‐‑2.93wt.%Cr ternary alloy was used in this study. It was oil quenched 74
and annealed at 590 °C. Gas nitriding was performed by Aubert & Duval at 550 °C during 75
100 h for a given nitrogen potential (KN = 2.65 atm-1/2). Composition profiles along the
76
nitride layer were carried out by electron probe microanalysis (EPMA) as well as glow 77
discharge optical emission spectrometry (GDOES) [7]. Observations of the case and core 78
microstructure were carried out by optical microscopy as well as scanning and 79
transmission electron microscopy. 80
81
2.2. Anomalous small angle scattering (ASAXS) 82
Small-‐‑Angle X-‐‑ray Scattering (SAXS) experiments were carried out on the BM02-‐‑D2AM, a 83
French CRG beamline at the European Synchrotron Radiation Facilities (ESRF) in 84
Grenoble. Regarding the composition of the system, the most reliable conditions for 85
anomalous measurements are based on the Cr K-‐‑absorption edge. Four energies slightly 86
below the Cr K-‐‑edge (5.96 keV) as well as one far from the Cr-‐‑edge were used for 87
anomalous SAXS measurements. As SAXS experiments are performed in transmission 88
mode, the relatively low energy of the Cr K-‐‑edge represented a challenge in the sample 89
preparation since it required the preparation of relatively thin samples, around 30 μm in 90
thickness, to ensure a satisfactory transmission through the thickness of the sample. 91
Moreover in order to investigate the precipitation variations with depth (down to 1 mm), 92
samples were cut along a bevel so that all depths can be studied by a profile measurement 93
adapted to the lateral resolution of the beam (~300 µm). A preparation procedure was 94
optimised and consisted in gently polishing 20×10 mm2 surfaces using a bevel of ~3
95
degrees, so that 500 μm steps for profile measurement along samples correspond to 25 96
μm steps within the depth of the nitrided layer. 97
A small-‐‑angle set-‐‑up was chosen to well characterise nano-‐‑precipitates in the 2-‐‑50 nm 98
radius range, i.e. in a q-‐‑range ranging from 0.03 nm-‐‑1 to 0.6 nm-‐‑1, where q is the amplitude
99
of the scattering vector q (𝑞 =#$%&'() where q is the half scattering angle and λ the 100
wavelength). The SAXS patterns were acquired using a two-‐‑dimensional CCD camera. 101
Data files were corrected from electronic noise, spatial distortion, pixel efficiency, the flat 102
field of the detector, and background noise. A circular average was taken around the 103
transmitted beam to obtain the intensity as a function of the scattering vector. The 104
scattered intensity was finally converted into absolute values, I, using measurement of the 105
intensity of the direct beam through calibrated filters. 106
The analysis method of ASAXS data to extract chemical information of nanoparticles is 107
described in details in [11] and is summarised hereafter. The measured quantity used for 108
the ASAXS analysis is the integrated intensity Q0 defined as:
109
equation (1)
110
where l is the wavelength, q is the module of the scattering vector, fv is the volume
111
fraction of scattering objects, is the electronic contrast, defined as the difference in 112
electronic density between the scattering particle (ρppt) and the matrix (ρm) in which it is
113
embedded: .
114
The electronic contrast can be varied by changing the energy in a range close to the 115
absorption edge of one element of the system. In fact, the electronic density of a phase 116
constituted by N elements can be written: 117 equation (2) 118
( )
I( )
qq dq π Δρ( )
fv(
fv)
Q =¥ò 2 =2 2 2 1- 0 0 l l( )
l r D m ppt r r r = - D( )
( )
at N i i i V f Xå
= = 1 l l rwhere in the atomic fraction of element i , is the mean atomic volume 119
of the particle or the matrix, is the atomic scattering factor of element i, which is 120
tabulated as a function of the wavelength of the beam. 121
In the vicinity of the absorption edge of the element k, the electronic contrast can be 122 written: 123 equation (3) 124 with . 125
Using this formalism, is expected to vary linearly with the scattering factor : 126 *𝑄, = 𝜃 + 𝑝𝑓1(𝜆) equation (4) 127 where : 128 129 with . 130
Using the ratio is a straightforward way for extracting chemical information from 131
ASAXS measurements (independently of the volume fraction): 132 equation (5) 133 i X ÷÷ ø ö çç è æ å = = N i 1Xi 1 at V
( )
l i f(
)
[
]
k( )
(
k ppt km)
N k i i m i ppt i i m at m ppt f X X f X X V 1 , , , , , 1 - + - = -å
¹ = a l a r r ppt at m at V V , , =a
0 Q fk( )
l θ = π Vat,m 2 fv(
1− fv)
δ fi i=1 i≠k N∑
(
αXi, ppt − Xi,m)
⎛ ⎝ ⎜ ⎜ ⎞ ⎠ ⎟ ⎟ p= π Vat,m 2 fv(
1− fv)
δ α(
Xk, ppt− Xk,m)
(
)
(
)
0 if 1 0 if 1 < - - = ³ - = m ppt m ppt r r d r r dθ
p θ p = fi i=1 i≠k N∑
(
αXi, ppt− Xi,m)
αXk, ppt− Xk,m(
)
In the following, this approach is used to extract the Cr, Fe or N contribution to nitrides or 134
matrix. In a second part the volume fraction of nitrides can be calculated using equation 135
(1). 136
137
3. Results and discussion 138
3.1. Microstructure of the nitrided layer 139
Figure 1 gives in-‐‑depth composition profiles of carbon and nitrogen from the Fe-‐‑ 140
0.354wt.%C-‐‑2.93wt.%Cr alloy nitrided 100 h at 550 °C [7]. 141
142
Figure 1: Nitrogen and carbon in-‐‑depth profiles of the Fe-‐‑0.354wt.%C-‐‑2.93wt.%Cr 143
ternary alloy nitrided at 550 °C for 100 h (EPMA/GDOES analyses) [7]. “Normal” N 144
content refers to the precipitation of all Cr atoms as binary CrN and the equilibrium 145
solubility of nitrogen in the ferritic matrix ([N]°α = 0,05 wt.%) .
146 147
The diffusion layer stretches from 30 to 900 µm. The nitrogen in-‐‑depth profile is 148
characterized by a smooth decrease from 1.2 (at 30 µm depth) to 0.95 wt.% (at 700 µm 149
depth) and a drop to the core content (0 wt.%) at a 900 µm depth. By defining a nitrogen 150
limit, called “normal N content” in figure 1, which corresponds to the amount obtained by 151
nitrogen fully reacting with chromium as CrN binary nitrides (considering the extremely 152
low solubility of Cr in ferrite) added to the solubility limit of nitrogen in ferrite ([N]°α =
153
0,05 wt.%), a nitrogen enrichment is observed through the diffusion layer. This so-‐‑called 154
excess nitrogen, already observed in various systems, might be attributed to the 155
substitution of alloying element in MN nitrides, or to an increase of the nitrogen solubility 156
in the surrounding of MN nitrides due to local tensile straining accompanying their 157
precipitation or by nitrogen adsorption at the precipitate/matrix interface. The carbon 158
content profile shows a depletion of carbon close to the nitrogen rich region of the 159
diffusion layer (at 50 µm depth) and an enrichment of carbon in front of the nitrogen 160
diffusion front (at 900 µm depth). The diffusion of carbon backward to the surface or 161
toward the core material during nitriding is ascribed to the transformation of initial 162
carbides (M7C3, M = Cr or Fe) into alloying elements nitrides and cementite at grain
163
boundaries [8,13]. 164
165
Figure 2: SEM micrograph (back scattering electron mode) from the case of a Fe-‐‑ 166
0.354wt.%C-‐‑2.93wt.%Cr ternary alloy nitrided at 550 °C for 100 h [14]. 167
168
The microstructure of the first 250 µm of the case is given on Figure 2. It is characterized 169
by a compound layer of nearly 25 µm composed of iron nitrides Fe2-‐‑3N/Fe4N and porosity
170
plus Fe4N iron nitride at grain boundaries between 25 and 80 microns below the treated
171
surface. At subsequent depths, polycrystalline cementite of 100-‐‑200 nm radius grains is 172
found at grain boundaries nearly parallel to the surface (Figure 2). The case is also 173
characterized by nanometer-‐‑scaled nitrides demonstrating the CrN crystallographic 174
structure. No initial carbides (M7C3, M = Cr or Fe) from previous tempering or annealing
175
treatments are observed until the depth corresponding to the nitrogen drop-‐‑off [7]. 176 177 3.2. ASAXS characterization 178 179 (a) 180 0.0 0.1 0.2 0.3 0.4 0 5 10 15 20 25 q [nm-1] Iq 2 [.10 5 nm -5 ] - 5 eV - 10 eV - 30 eV - 70 eV - 200 eV E(Cr-K)
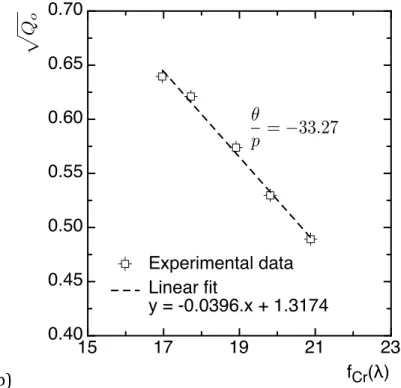
(b) 181
Figure 3: Sample nitrided at 550 °C for 100 h at a depth z = 400 µm. (a) Evolution of the 182
scattering signal for the various energies used for anomalous SAXS. (b) Plot of vs.
183
exhibiting a linear behavior leading to the determination of the value. 184
185
ASAXS measurements were carried out through the nitrided depth, in particular in the 186
diffusion layer. Regarding the size of cementite grains (radius of 100-‐‑200 nm) compared 187
to MN nitrides (less than 50 nm), ASAXS conditions were chosen to characterise 188
precipitates in the 2-‐‑50 nm radius range. As a consequence, no influence of carbides is 189
expected within the diffusion layer. 190
Resulting scattering curves are displayed in Figure 3.a in the Iq² vs. q plot. It is worth 191
noting that only one peak can be observed in this plot, corresponding to only one family 192
of scattering precipitates. This is not surprising since platelets are reported to have 193
comparable diameter (~10-‐‑20nm) than globular precipitates, mainly differing by their 194
thickness (~5nm for globular nitrides, and 2nm for platelets) [9], both sizes being 195
investigated in the used q-‐‑range. As a consequence, different families of nitrides 196 15 17 19 21 23 0.40 0.45 0.50 0.55 0.60 0.65 0.70 fCr(λ) Experimental data Linear fit y = -0.0396.x + 1.3174 p Qo ✓ p = 33.27 0 Q
( )
l Cr f θ p(incoherent globular MN formed by transformation carbides and semi-‐‑coherent platelets 197
homogeneously nucleated in the matrix) cannot be distinguished. In the following, ASAXS 198
data interpretation will then be conducted irrespectively of the type of nitrides. It is 199
however important to notice that literature reports that both have the same crystal 200
structure and are of MN-‐‑type structure [9]. However the composition may vary between 201
both, semi-‐‑coherent are expected to be pure CrN precipitates (as in binary Fe-‐‑Cr system) 202
whereas nitrides originated from transformed carbides may contain Fe and C in 203
substitution of Cr and N respectively, at least as a transition state. Substituted carbon in 204
MN has little effect on ASAXS experiments regarding that C has only one less electron than 205
N, resulting in similar scattering factors (7.05 and 6.04 e.atom-‐‑1 for N and C respectively
206
at 5.96 keV). On the contrary, Fe may alter significantly the electronic contrast between 207
nitrides and the matrix. In the following, stoichiometric MN (M=Cr or Fe) nitrides will then 208
be considered as the composition of scattering precipitates. 209 210 (a) 211 0 200 400 600 800 1000 1200 0.0 0.1 0.2 0.3 0.4 0.5 0.6 0.7 depth [μm] Qo [Å -6 ] - 5 eV - 10 eV - 30 eV - 70 eV - 200 eV E(Cr-K)
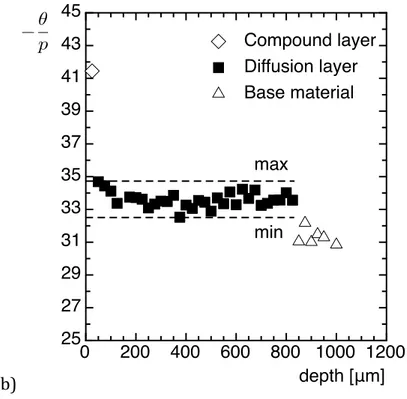
(b) 212
Figure 4: Sample nitrided at 550 °C for 100 h. (a) Evolution of the integrated intensity for 213
the various energies used for anomalous SAXS with depth (z = 0 corresponds to the 214
surface). (b) Evolution of the -‐‑ ratio in the different zones of the nitrided layer. 215
216
Regarding the anomalous behaviour, as expected from the increase in the electronic 217
contrast between the nitride and the matrix by approaching the K-‐‑edge of Cr, the 218
scattering signal and hence the integrated intensity Q0 are monotonically varying with the
219
energy. The data treatment detailed in 2.3. is applied to determine the composition of MN 220
nitrides. The linear behaviour of with is displayed in Figure 3.b. Such 221
measuremnts were performed along the nitrided layer and results are displayed in 222
Figure 4. The various regions of the nitrided layer can be easily distinguished. The depth 223
of the diffusion layer is well reproduced and is in agreement with C/N profiles (Figure 1) 224
and with previous studies on this material [7]. The procedure of preparing the ASAXS 225
sample from a bevel through the nitrided sample in order to perfom in-‐‑depth scanning of 226
the nitrided layer is as a consequence proven. It can be observed on Figure 4 that the 227 0 200 400 600 800 1000 1200 25 27 29 31 33 35 37 39 41 43 45 depth [μm] ✓ p Compound layer Diffusion layer Base material max min θ p
( )
l r D 0 Q fCr( )
lintegrated intensity Q0 as well as the ratio are fairly constant in the diffusion layer,
228
more precisely in the 200-‐‑700 µm range in depth. This means that the composition ( 229
constant) and the volume fraction (Q0 and composition constant) of nitrides are almost
230
homogeneous throughout the nitrided layer (apart from boundaries). In the 0-‐‑200 µm 231
range in depth, larger nitrides were observed leading to a truncated scattering signal in 232
the small q-‐‑range (q < 0,03 nm-‐‑1); as a consequence the integrated intensity Q0 is
233
underestimated in this region, leading to underestimated volume fraction of nitrides in 234
the following. 235
As mentioned previously, data treatment is carried out by considering that scattering 236
precipitates are mainly MN nitrides (M=Cr or Fe). It follows that equation (5) can be 237 written as : 238 equation (8) 239
considering that XN,ppt = 0.5 and that the matrix is defined as pure Fe.
240
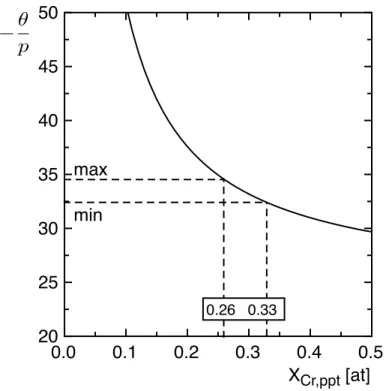
The evolution of the ratio as a function of XCr,ppt is plotted on Figure 5. This leads to
241
the determination of the Cr contribution in the chemical composition of MN nitrides and 242
also to the Fe contribution. By considering the whole range of experimental values, 243
the resulting composition of MN nitrides can be estimated: Cr0,6±10%Fe0,4±10%N. The
244
variation of the composition along the depth of the diffusion layer is displayed on Figure 245
6. The composition is almost constant for depth between 100 µm and 800 µm, 246
corresponding to the diffusion layer. 247
θ
pθ
p θ p= α 0.5 f(
N+ fFe(
0.5− XCr, ppt)
)
− fFe αXCr, pptθ
pθ
p248
Figure 5: Calculation of the -‐‑ ratio evolution as a function of Cr content in the 249
precipitates XCr,ppt (in atomic fraction) in the case of MN (M = Fe or Cr, XN,ppt = 0,5) nitrides.
250
min and max correspond to the experimental minimum and maximum values of the -‐‑ 251
ratio as referred in Figure 4. 252
253
Once composition of the nitrides determined, the measured Q0 values can be used to
254
calculate the volume fraction of nitrides formed in the diffusion layer by using equation 255
(1). The evolution of the volume fraction of nitrides as a function of depth is displayed in 256 Figure 7. 257 XCr,ppt [at] 0.0 0.1 0.2 0.3 0.4 0.5 20 25 30 35 40 45 50 ✓ p max min 0.26 0.33 θ p θ p
258
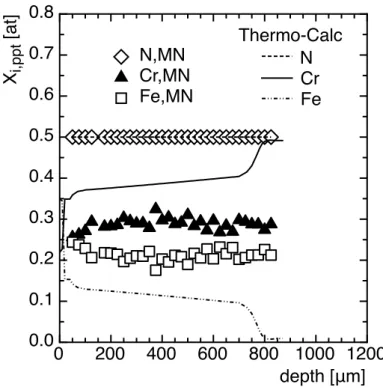
Figure 6: Evolution of the nitride composition as a function of depth (z = 0 corresponds to 259 the surface) 260 261 3.3. Thermo-‐‑Calc calculations 262
The Thermo-‐‑Calc software (version 4.0 [12] and TC-‐‑API version 7.0 [15]) was used to 263
estimate the volume fraction of phases through the case from experimental N/C profiles 264
(Figure 7). It is based on the CALPHAD method and the lattice solubility concept [16]. 265
Calculations were performed at the nitriding temperature and using the Thermo-‐‑ 266
Calc Software TCFE7 Steels/Fe-‐‑alloys database version 7 [17]. According to experimental 267
investigations, some phases were rejected from thermodynamics calculations such as M6C
268
or M5C2 carbides and N2 gas was not taken into account. Thermodynamics calculations
269
were performed by allowing the presence of iron atoms into MN nitrides such as M = Cr 270
and/or Fe. On one hand, when allowing precipitation of iron into MN nitrides, the atomic 271 0 200 400 600 800 1000 1200 0.0 0.1 0.2 0.3 0.4 0.5 0.6 0.7 0.8 depth [μm] Xi,ppt [at] N,MN Cr,MN Fe,MN Thermo-Calc N Cr Fe
fraction of iron in nitrides (Figure 6) and volume fraction of nitrides (figure 7) are found 272
close to 12 at.% and 6 vol.% respectively along the nitrided depth. 273
Figure 7: Evolution of the volume fraction of phases through the case after nitriding 274
during 100 h at 550 °C a Fe-‐‑0.354wt.%C-‐‑2.93wt.%Cr ternary alloy. Comparisons between 275
ASAXS experiments and Thermo-‐‑Calc calculations from experimental N and C depth 276 profiles (Figure 1). 277 278 3.4. Discussion 279
The fraction of iron, up to 20 at.% (Figure 6), estimated from ASAXS measurements, and 280
the volume fraction of nitrides (Figure 7) are consistent with thermodynamics 281
calculations performed with the Thermo-‐‑Calc software (Figure 7) and with experimental 282
data in the literature [18-‐‑20]. Based on matter balance, the fraction of chromium and 283
nitrogen taking part into the precipitation of nitrides was also determined and compared 284
to the overall element contents. Given the low solubilities of chromium and nitrogen have 285
low solubilities in ferrite (~1.10-‐‑4 wt.%Cr and 0,05 wt.%N at 550°C), matter balance
286
(Figure 8) gives composition close to the overall content of these elements, supporting 287
the used assumptions. 288
289
) 290
Figure 8: Amount of N and Cr involved in MN nitrides as a function of depth. For 291
comparison, the mean total amount of N, [N]tot, as measured by GDOES/EPMA is indicated
292
as well as the nominal Cr composition [Cr]nom.
293 294
4. Conclusion 295
ASAXS measurements are used to determine the volume fraction of chromium nitrides on 296
a gas nitrided Fe-‐‑0.354wt.%C-‐‑2.93wt.%Cr ternary alloy. Although complementary 297
investigation is needed to distinguish different kinds of nitrides, the current study has 298
proven the potentiality of ASAXS technique to provide quantitative data concerning 299
precipitates through thickness in the nitrided layer of Fe-‐‑Cr-‐‑C steels. Such data are key 300
parameters for the evaluation of induced volume change and resulting mechanical 301
properties in nitride steels. 302
303
Acknowledgements 304
The authors would like to thank the European Synchrotron Radiation Facilities for giving 305
access to the French CRG beamline BM02-‐‑D2AM (Experiment 02-‐‑01805) as well as Dr. 306
Martiane CABIE for TEM observations at CP2M, Aix-‐‑Marseille University, France. We also 307
thank Aubert & Duval, ERAMET Group, for supplying nitrided steels. 308 309 References 310 311
[1] G. Goerigk, H.G. Haubold, O. Lyon, J.P. Simon, Anomalous small-‐‑angle X-‐‑ray 312
scattering in materials science, J Appl Cryst 36 (2003) pp. 425-‐‑429 313
314
[2] Y. Waseda, Anomalous X-‐‑Ray Scattering for Materials Characterization, STMP 315
179, Springer-‐‑Verlag Berlin Heidelberg (2002) pp.161-‐‑179 316
317
[3] American Society for Metals, Source Book on Nitriding, Metals Park, Ohio : A.S.M. 318
(1977) 319
320
[4] E.J. Mittemeijer, Case-‐‑Hardened Steels : Microstructural and Residual Stress 321
Effects, edited by D.E. Diesburg, Warrendale, Pennsylvania : TMS-‐‑AIME (1984) pp.61 322
323
[5] E.J. Mittemeijer, Fundamentals of Nitriding and Nitrocarburizing, ASM Handbook, 324
Volume 4A, Steel Heat Treating Fundamentals and Processes, J. Dossett and G.E. Totten, 325
editors, 2013 326
327
[6] K.H. Jack, Nitriding, Proc. Heat Treatment ’73, The Metal Society, London, pp. 39-‐‑ 328
50 329
330
[7] S. Jegou, L. Barrallier, R. Kubler, Phase transformations and induced volume 331
changes in a nitrided ternary Fe-‐‑3%Cr-‐‑0.345%C alloy, Acta Materialia 58 (2010) pp.2666-‐‑ 332
2676 333
334
[8] C. Leroy, H. Michel, M. Gantois, Transformation of (Cr,M)7C3-‐‑type carbides during
335
nitriding of chromium alloyed steels, Journal of Materials Science 21 (1986) pp.3467-‐‑ 336
3474 337
338
[9] J-‐‑N. Locquet, R. Soto, L. Barrallier, A. Charaï, Complete investigation of a nitrided 339
layer for Cr alloy steel, Microscopy Microanalysis Microstructures 8 (1997) pp.335-‐‑352 340
341
[10] S. Mridha, D. H. Jack, Characterization of nitrided 3% chromium steel, Metal 342
Science 16.8 (1982) pp. 398-‐‑404 343
344
[11] M. Dumont, L. Commin, I. Morfin, F. De Geuser, F. Legendre, P. Maugis, Chemical 345
composition of nano-‐‑phases studied by anomalous small-‐‑angle X-‐‑ray scattering : 346
Application to oxide nano-‐‑particle in ODS steels, Materials Characterization 87 (2014) 347
pp.138-‐‑142 348
349
[12] J.O. Andersson, T. Helander, L. Höglund, P.F. Shi, and B. Sundman, Thermo-‐‑Calc 350
and DICTRA, Computational tools for materials science, Calphad 26 (2002) pp.273-‐‑312 351
352
[13] P.C. Van Wiggen, H.C.F. Rozendaal, E.J. Mittemeijer, The nitriding behaviour of 353
iron-‐‑chromium-‐‑carbon alloys, Journal of Materials Science 20 (1985) pp.4561-‐‑4582 354
355
[14] S. Jegou, L. Barrallier, R. Kubler, M.A.J. Somers, Evolution of residual stress in the 356
diffusion zone of a model Fe-‐‑Cr-‐‑C alloy during nitriding, HTM J. Heat Treatm. Mat. 66(3) 357
(2011) pp.135-‐‑142 358
359
[15] Thermo-‐‑Calc Software TC-‐‑API User’s Guide version 7.0, (Accessed 19 June 2014) 360
361
[16] L. Kaufman, H. Bernstein, Computer Calculation of Phase Diagrams, Academic
362
Press, New-‐‑York (1970) 363
364
[17] Thermo-‐‑Calc Software TCFE7 Steels/Fe-‐‑alloys database version 7.0, (Accessed 365
23 Aug 2013) 366
367
[18] R. Danoix, L. Legras, B. Hannoyer, J. Dulcy, F . Danoix, Solid to Solid 368
Transformations in Inorganic Materials (PTM) 2005, Edited by J.M. Howe, D.E. Laughlin, 369
J.K. Lee, U. Dahmen and W.A. Soffa, TMS (The Minerals, Metals and Material Society) 2005, 370
Vol. 1 : Diffusional Transformations, pp. 351-‐‑356 371
372
[19] C. Ginter, L. Torchane, J. Dulcy, M. Gantois, A. Malchere, C. Esnouf, T. Turpin, A new 373
approach to hardening mechanisms in the diffusion layer of gas nitrided α-‐‑alloyed steels. 374
Effects of chromium and aluminium : experimental and simulation studies, La Metallurgia 375
Italiana 7-‐‑8 (2006) pp. 29-‐‑35 376
377
[20] P. Jessner, R. Danoix, B. Hannoyer, F. Danoix, Investigations of the nitrided 378
subsurface layers of an Fe-‐‑Cr model alloy, Ultramicroscopy 109 (2009) pp. 530-‐‑534 379
380