Science Arts & Métiers (SAM)
is an open access repository that collects the work of Arts et Métiers Institute of
Technology researchers and makes it freely available over the web where possible.
This is an author-deposited version published in: https://sam.ensam.eu
Handle ID: .http://hdl.handle.net/10985/18783
To cite this version :
Romain ECAULT, Fabienne TOUCHARD, Laurent BERTHE, Michel BOUSTIE - Laser shock
adhesion test numerical optimization for composite bonding assessment Composite Structures
-Vol. 247, p.1-12 - 2020
Any correspondence concerning this service should be sent to the repository
Administrator : archiveouverte@ensam.eu
Laser shock adhesion test numerical optimization for composite bonding
assessment
Romain Ecault
a,⁎, Fabienne Touchard
b, Laurent Berthe
c, Michel Boustie
b aAirbus Operations S.A.S, 316, route de Bayonne, B.P. D4101, 31060 Toulouse Cedex 9, FrancebInstitut Pprime, CNRS-ENSMA-Université de Poitiers, Département Physique et Mécanique des Matériaux– ENSMA, 1, Av. Clément Ader, B.P 40109, 86961 Futuroscope
Cedex, France
cPIMM, CNRS-ENSAM Paristech, 151 Bd de l’Hôpital, 75013 PARIS Cedex, France
A B S T R A C T
The present work presents the latest development of laser shock adhesion test (LASAT) technology, targeting the weak bond detection in bonded aeronautic structures. This problematic is still holding back a wider use of bonding, which could however be a significant breakthrough in the way of assembling parts. By mechanically loading the bondline thanks to laser-induced shock waves, LASAT acts as proof test to reveal the presence of local weaknesses. In the present paper, focus is made on the optimization of the laser shock parameters regarding the assembly to test. Objective is to avoid loading too much the composite, thus avoiding damage, to increase the test performances. Numerical modelling is used, following a specific methodology, to understand the phenomena and identify the key parameters.
The basic laser shock configuration was first investigated. Due to the stress distribution, this setting allows one to test a bond whose strength is equal or below 40% of composite inter-laminar strength. The effects of the laser focal spot on the stress distribution are also quantified. A 4 mm diameter shows good performances for the assembly to test. For thefirst time, three different optimizations are proposed: tunable pulse duration, double pulses on the front face and symmetrical laser shocks. They arefirst theoretically described. Numerical results then support these configurations’ performances. The double pulse solution makes it possible to test a bond strength equal or inferior to 80% of composite inter-laminar strength, when symmetrical pulses enable to reach 100% thanks to a sharp stress distribution. These results are validated by experimental evidence that is also presented. Finally, the present work offers helpful information for the development and deployment of LASAT for aeronautic bonded structures.
1. Introduction
1.1. Need for bonding assessment
Composite materials are now widely used in Industries. In Aeronautics, their mechanical performances combined with their low weight, make them good candidates for aircraft structures. Indeed, composite mechanical behavior can be designed with regards to the expected loadings. In other words, mass is used only where needed, which is quite efficient in terms of structural design. For example, the Airbus A350 contains up to 52% in mass of composite material, mainly Carbon Fiber Reinforced Polymers (CFRP). For this aircraft, the whole fuselage and the wings are concerned. This high amount of lightweight material helped to increase the aircraft eco-efficiency, as did the new engine development, or the aerodynamic design. The next technological breakthrough may come from the way of assemble this material. For that, bonding is quite interesting for several reasons, regardless of the composite material.
First, if bonding is used, there is no need to drill fastener holes. From
a mechanical point of view, it leads to better stress distribution within the structure by avoiding stress concentration. From a manufacturing point of view, bonding reduces the lead time considerably by simply removing the drilling operations. Drilling is a complex process re-quiring specific tools and often leads to delamination[1]. This well-known effect is compensated by over-design, which is not why com-posite are used for. Then, rivets represent also an important weight and a significant cost when considering the whole aircraft structure. Here again, composite case is worst since titanium fasteners have to be used to control oxidation of the rivets[2]. The total mass which can be saved by removing all the fasteners have been estimated about 10%[3,4]. Of course, this is a utopian perspective and mechanical fasteners will be used for the long term at least to prevent disbond initiation at tips, but a mass reduction of 5% is already significant in aeronautics[5]. Finally, bonding can also lead to new design and unlock the associated pro-cesses. All that combined, bonding can lead to a better aircraft eco-efficiency, during its production and its lifetime, at a lower cost.
Unfortunately, there is currently no Non Destructive Testing (NDT) technique able to assess bond mechanical performance. The risk of a
weak bond is still the main barrier to a wider use of bonding. A weak bond is a bond whose mechanical performance is below 80% of nom-inal strength, and which does not present any defect such as disbonds or voids. This weakness can come from a surface contamination prior to bonding, or a curing process deviation, and thus cannot be detected using conventional NDT. For this reason, bonding is today limited to specific areas for which the processes are perfectly mastered, for non-critical parts and with the appropriate mechanical reinforcement if necessary. This is a first step, but not yet fully efficient. To face the weak bond issue, extended NDT techniques are currently being devel-oped. The term “extended” is used to define technology which can provide more information than only the geometrical state of the matter (voids, delaminations, cracks…). The aim is to link the physical-che-mical properties of the material to a mechanical strength. Two groups can be distinguished: technologies dedicated to surface quality control prior to bonding, and the one addressing the bonding assembly eva-luation. All these technologies are investigated within the H2020 ComboNDT project[6]. Among thefirst group, some technologies can be quoted such as LIBS (Laser Induced Breakdown Spectroscopy), OSEE (Optically stimulated electron Emission), Enose (Electrical Nose), FTIR (Fourier Transformed Infrared Spectroscopy), or AWT (Aerosol Wetting Test). They are not detailed in the present paper, but well described in literature[6–8].
After bonding, the detection of contaminant is more challenging because there is no longer access to the bondline. Wave-based techni-ques have been investigated such as vibrometry or THz technitechni-ques to investigation the assembly without great success. Nonlinear ultrasound techniques have shown some interesting results[9]. Another approach is to use embedded sensors bonded to the skin to perform an electro-mechanical impedance technique (EMI)[10,11].
For bonding assessment, the laser shock adhesion test (LASAT) ap-pears as a promising technology. This technique generates laser-in-duced shockwaves within the assembly to test. The shock propagation can result in tensile stress loading which can be used to evaluate a bonding strength. Indeed, these stresses can lead to damage is case of a local weakness, or if the damage threshold is exceeded. The absence of damage resulting from a calibrated loading insures the correct strength of the assembly. This technique is not new, and wasfirst demonstrated by J.L. Vossen in the early 80′s, when the laser shock method appeared
[12]. Thefirst patent by V. Gupta for evaluating metallic assemblies in 1995 demonstrates a strong industrial interest for the technology[13]. In the 2000′s, several PhD works addressed adhesion testing of coated systems, thermal barrier and thinfilms: C. Bolis[14], M. Arrigoni[15], and S. Barradas[16]. They demonstrated the test efficacy for several
different systems with experiments and numerical modeling. The ac-ronyme “LASAT” appeared at that time, and the methodology to de-velop this test was proposed, namely: experimental methodology to identify the disbonding threshold, use of Doppler velocimetry to record the material response, experimental/numerical approach to quantify the stresses, comparison to conventional mechanical testing. Ten years later, thicker systems were investigated. These systems are no longer suited for the established laser parameters, which were developed for thin systems and coatings. It was then necessary to have a better un-derstanding of the material response, including the glue behavior[17]. Studies for composite bonding were then carried out. Although some interesting experimental demonstrations were reported, the need for mastering the technology is clearly still apparent [18–20]. For that, investigations have been recently conducted to better understand LASAT on composite material, experimentally[21–24]and numerically
[25]. This work gives a clear insight of what is at stake for LASAT on composite bonding. For the first time, an optimization of the laser parameters adapted to test composite assemblies is proposed.
There are two ways in using LASAT technology. Thefirst one is to use LASAT as an interface characterization technique. The aim is thus to characterize a bonding strength in terms of material or mechanical characterization such as a tensile loading machine but very local. In this
case, the induced tensile loading should be known to quantify the in-terface strength but this quantification is not fully mastered. The test can also be destructive for the substrate, since it can be applied on process control specimens for example in this case. It is another story if LASAT is used as a proof test, whose aim is to ensure the correct bonding/interface strength beforeflying for example. In this scenario, LASAT should be non-destructive, at least for the correct assembly. This application requires perfectly mastering the stress distribution within the assembly, and for that, an optimization of the shock parameters according to the assembly geometry is needed. In the present work, a first optimization loop for a typical aeronautic geometry is proposed. The associated methodology is presented. Assuming that the optimum parameters for the given application are found, the proof test can then be performed. The assembly is shocked at various positions, with or without overlap depending on the test scenario. A diagnostic is used to identify if the bondline failed or not, looking for disbonding evidence. This diagnostic can be time-resolved, such as PDV (Photonic Doppler velocimetry). In this case, the damage is directly evidenced thanks to the signature of the material under shock propagation. Conventional NDT such as ultrasonic techniques can also be used as a post-shock technique to reveal the disdonded area, if any. If no damage is detected, the bonding is considered as correct, and the assembly canfly.
In the present paper, the optimization methodology is first de-scribed. The basic LASAT configuration performance is evaluated. Then, several optimization configurations identified in the present work are proposed and discussed by use of numerical results. Finally, a preliminary experimental validation is given for one of the optimized configurations.
1.2. Methodology
LASAT methodology relies on a dual approach coupling experi-mental characterization and numerical results[25]. Laser shock ex-periments provide data to develop and validatefinite element models. Once the validation obtained, i.e, the agreement between experimental and numerical data reached, it is assumed that the model correctly describes the material behavior under laser shock loading. Numerical results can then be used to quantify the level of stresses withstand by the interface, and to optimize the laser shock parameters in relation to applications. This capability is important for two reasons: 1. it is not possible to have a direct measurement of stress level during shock propagation. Only particle velocity of the free surface can be measured by Doppler velocimetry. 2. The laser source have generally fixed parameters (pulse duration especially) which prevents experimentally testing a wide range of configurations.
The approach chosen to obtain a representative finite element model for the bonded composite assembly is described inFig. 1. The application shouldfirst be perfectly defined up to the elementary as-sembly. Typically in the present work, CFRP to CFRP bonding is ad-dressed, which is common for skin or a fuselage applications. The as-sembly is then divided into elementary materials (composite, bond), and each of them is experimentally characterized under laser shock loading to validate the elementary model. Then, the individual material models are assembled to create the assembly model, which is also va-lidated following the same process. The model can then be used to identify the optimum configuration for the application. If this one is very different from the initial one, it might be necessary to re-loop, to ensure the performances.
The present work focuses on the numerical investigation to identify the optimal configuration. The finite element calculations have been performed with LS-Dyna software. Thefirst steps to develop and vali-date the model were already done and published[25]. In the present paper, the model is thus assumed as validated, with its pro and cons, and the model development is not pushed forward in the present work. However, two important working hypotheses should be recalled. The first one is that there are model errors on both pressure loading and
mechanical behavior. The input pressure is laser/matter interaction model-based. This modelling uncertainty is commonly estimated be-tween 10 and 15%[25,26]. Although the model is considered as vali-dated, it’s weakness lay in the attenuation modeling, leading to stress over-estimation, also estimated about 10%[25]. The second one is that there is material variability. Indeed, composite material remains pro-cess sensitive. The local mechanical properties can vary due to resin overage. This variation is hard to quantify because it depends on the materials and the processes, but can be estimated about 20%. This value is the uncertainty generally obtained in case of mechanical testing (GIC), which also explain why weak bonds are considered below 80% of nominal strength. These two sources of error are not linked. Therefore, it seems reasonable to use a 20% margin on the pressure load (and corresponding margin on the laser energy based on[26]) to apply on the bonded assemblies in order take into account these limitations. The stress value, in %, given in the following sections does not take into account this margin.
The objective of the present work is to enable the bonding assess-ment of a T700/M21 bonded assembly. This assembly is nonsymmetric, made of two composite laminates: one is 2.5 mm thick, with the fol-lowing stacking sequence [0,0,90,90,0,0,90,90,0,0], the second is 1.5 mm thick, with a [0,0,90,90,0,0] lay-up. A FM300 epoxy adhesive film is used to bond the two composite laminates. The bond thickness is equal to 130 µm.
2. Basic configuration
2.1. Basic configuration schematic description
Before considering the optimized solutions, the basic LASAT con-figuration should first be described and analyzed. The basic config-uration is a conventional one; it is a mono-pulse, whose pulse dconfig-uration is about 25 ns, with energy up to few joules on a few millimeter dia-meter focal spot. With an aluminum sacrificial layer, and in a water confinement regime, the input pressure is about 1 GPa, for a 50 ns pulse width[27]. A simplified description of the shock propagation can then be given by a time-position and a pressure/velocity diagram according to shock theory. They are presented inFig. 2. In the present paper, time-position diagrams are always represented along the axis of the laser loading. Practically, the wave propagations in the material depend on the shock impedance, and the pressure state is defined by the Hugoniot curve of each material. For a given pressure loading P1 at time t = 0, the material initially under zero pressure is loaded. The shock propa-gates through the thickness of the material, with the pressure state P1,
up to the free back face where it is reflected into a release wave. The pressure drops, and the matter is accelerated to a particular velocity as defined by the Hugoniot curve (state (3) inFig. 2). In parallel, a release wave initiated at the end of the pressure loading follows the shock and brings back the matter to its initial state (see (2) inFig. 2). The crossing of the two release waves, respectively leading to states (2) and (3), leads to state (4) in which pressure is–P1 (assuming no loss). The material is thus loaded with tensile stresses and an interface, if any, can be da-maged. If the failure stress value (σr2inFig. 2) is above–P1, the
ma-terial will remain sound, if not (σr1inFig. 2), damage will be initiated
where the threshold is overpassed.
The LASAT principle is here described very simply, assuming a perfect 1D propagation with no dissipation and no impedance mis-match at the interfaces. All these hypotheses are not true when applying LASAT to composite. The phenomenon is fully 3D due to the ratio focal spot/thickness and to the composite anisotropy. For this reason, at-tenuation can be strong. In the case of a CFRP lay-up, each interply can act as a small impedance mismatch creating a transmission/reflection phenomenon. This complication demands a model-based approach to understand the propagation, and the resulting stress distribution.
2.2. Basic configuration performances
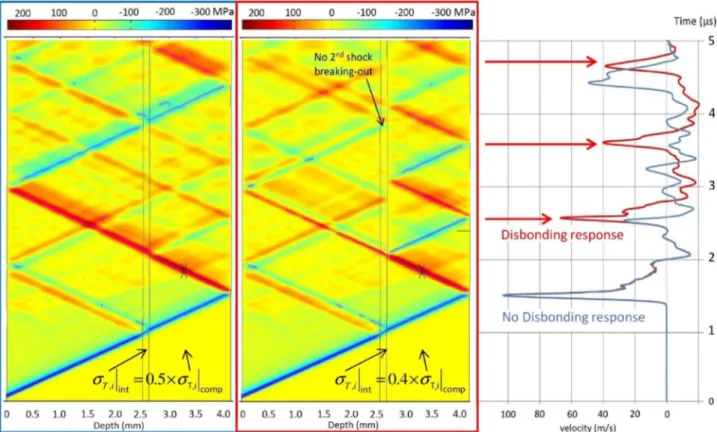
In this section, the objective is to determine which bond strength can be tested by the basic LASAT configuration without creating da-mage inside the composite laminates. For that exercise, the input pressure amplitude is set to 0.38 GPa. From the previous results[25], it is known that this pressure will not lead to any delamination. Then, the bondline strength value is progressively weakened, taking the compo-site interlaminar strength value as a reference (100%). InFig. 3, two numerical results are presented as time-position-pressure diagrams. The first one on the left and outlined in blue was performed with a bond interface strength set at 50% of the composite interlaminar one. In this case, the stress distribution and the velocity signature show that there is no creation of damage. The second one, outlined in red, corresponds to a case where the bonding strength is equal to 40% of the composite interlaminar one. The stress distribution is now different. It is visible at t = 2 µs on the diagram, when the main tension wave goes through the bonded interface. Only a small part of the tension goes through, and the compression reverberation is stronger. At 2 µs later, this is more ob-vious. The compression coming back from the front face toward the bondline cannot pass the interface. This is an evidence of disbonding, the interface acts as a free surface. It is also visible on the free surface velocity curve, in red for this calculation. Indeed, no second shock Fig. 1. Schematic description of the laser shock adhesion test optimization loop for aeronautic applications.
breaking out is visible, and new peaks appear. These peaks are due to the wave trapped in the disbonded thin composite laminate (seeFig. 3). As a conclusion, with the basic laser configuration, the weak bond which might be detected without damaging the composite skins should have a bond strength value below 40% of the composite interlaminar strength value. In reality, because of the model assumptions, the real value is probably slightly lower. Therefore, in order to test a stronger bond while avoiding composite delamination, the stress distribution should be optimized.
3. Optimized configurations
In this section, optimization solutions are proposed. The idea is to try to position the maximum of tensile stresses at the bonded interface by adjusting the laser parameters.
Fig. 2. a) time position diagram in case of a single laser on a bonded composite– schematic 1D shock propagation and pressure state location b) Corresponding pressure/particular velocity diagram.
Fig. 3. Numerical model results in case of single shot (0.38 GPa peak pressure) on a T700/M21 bonded composite– time/position/pressure diagrams and back face velocities displays– Two different interface strength values: 175 MPa (blue color code) and 140 MPa (red color code).
3.1. Optimization by varying the focal spot diameter
3.1.1. Principle and numerical results on monolithic composites
In this section, wefirst propose to keep the same laser parameters (pulse width, energy,…) but to change its focus on the target to add edge effects, also called 2D effects[27]. This is a cheap and easy so-lution since the only thing to change is the position of the target relative to the focusing lens, or the lens itself but no more. The 2D effects are generated by the laser spot edge from which release waves that pro-pagate behind the main shock as shown inFig. 4. The release wave from one edge will meet the one generated by the diametrically opposed edge at the axi-symmetric loading axis. The crossing of these release waves creates tensile loading, like for the main shock, and follows the main shock. InFig. 4-a, a time-position-pressure diagram is proposed for a 3 mm thick T800/M21 monolithic material. This calculation was made with a 2 mm focal spot to create the crossing of edge-release waves as soon as possible and thus better spot it on the diagram. Indeed, the induced tensile loading is visible on the diagram, starting at 0.7 mm; 0.7 µs (see inFig. 4-a). From this point, they can be tracked along the wave propagation because they are desynchronized compared to the main shock propagation. It can also be observed that this 2D effect area crosses the main tensile wave propagating backward from the back face. The superposition of these two regions induces a highest tensile loading zone visible in white on the diagram (see inFig. 4-a).
Calculations were performed with different focal spot diameters to highlight some differences. Since the focal spot diameter has an effect on the laser intensity, and thus on the pressure, the energy was changed to always keep the same intensity, ie the same pressure. Calculation results are presented in Fig. 4-b). For each focal spot diameter, two
values are given: the maximum of tensile stresses reached during the shock propagation (referred by the left vertical axis) and the position of this maximum in the material thickness (referred by the right axis). Small focal spot diameter values (typically 1 mm) induce the lowest level of stresses. In this case, the edge release waves are generated too soon behind the shock front. In hydrodynamic regime, release wave goes faster than shock wave. In this case, the shock is caught-up by the release waves leading to its attenuation. When increasing the focal spot diameter, an optimal size can be found. Here, the 3 mm diameter presents a significant stress level, and it is located deeper inside the material. A bigger focal spot diameter delays the edge release arrival on the loading axis. The superposition of the induced tensile region with the main tensile wave occurs later and thus deeper. For an even bigger focal spot diameter values (> 7mm), stress level and stress position do not change, indicating that the edge effects do not influence the stress distribution anymore. The shock propagation can be assimilated to a 1D propagation.
This study shows that 2D effects can add additional tensile loading into the assembly in superposition with the main wave propagation. The correct focal spot size relative to the material thickness, result the optimum timing of the arrival on the propagation axis, can help to modify the stress distribution.
3.1.2. Modeling results for bonded assemblies
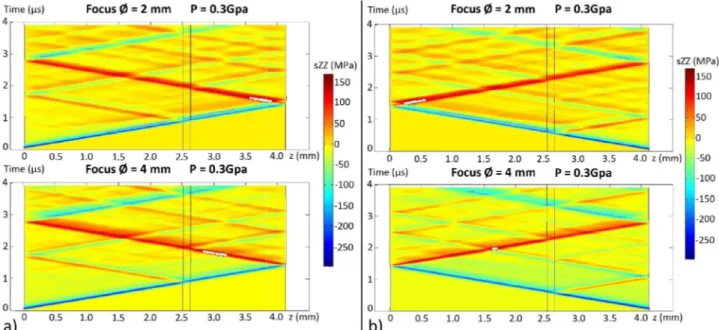
Several calculations were performed with various focal spot dia-meter values, keeping the pressure constant (0.3 GPa). Since a dis-symmetric assembly should be tested, two configurations were in-vestigated, one with the laser beam hitting the thick composite laminate, and one with the laser beam hitting the thin composite Fig. 4. Sketch of the 2D effect phenomenon in a homogeneous material submitted to a laser shock – a) Time/position/pressure diagram for 0.3 GPa single shot with a 2 mm diameter focal spot, b) synthesis chart of the whole parametric study showing stress magnitude and stress location as a function of focal spot diameter.
laminate. InFig. 5, some examples of results are presented as time-position-pressure diagrams. The highest tensile stress values are high-lighted in white. It can be seen that the 2D effect phenomenon can modify the location of the highest tensile stress zone. The position of the bondline with respect to the hit face is important because it can have an influence on the stress distribution. This effect can be observed by comparingFig. 5-a and -b, respectively obtained shooting on the thick composite plate or on the thin one, and for the same diameter value (4 mm). In Fig. 5-b, it can be seen that when the shock goes through the bond, part of the energy is reflected into a release wave at thefirst interface due to the lower impedance of the bond material. But when crossing the second interface, the shock is reflected into a shock wave, the composite impedance being higher than the bond impedance. For the same reason, this shock is also transmitted as a stress wave into the thin composite when propagating backward. After a reflection on the front face, the compression is converted into tension propagating frontward. Tensile stresses cross the bond and reach the thick composite where it meets the main tensile wave propagating backward from the
back face. The superposition of these two tensile waves leads to a highest stress level, which is in this particular case higher than any-where else in the assembly. It means that in this case, the edge effects do not influence the stress distribution, or at least not obviously.
The phenomenon is completely different if shooting from the thick face (seeFig. 5-a). The thickness of composite delays the arrival of the tensile wave coming from the front face. The time offlight of the back and forth is longer in this skin. The superposition of the two tensile waves then occurs after that the main tensile wave coming from the back face has crossed the bond. Part of the energy has been thus re-flected. Consequently, the crossing area is no longer the highest one. However, to see if the position of the maximum stress is in this case influenced by the edge effects, this result should be compared to the one obtained for a different focal diameter value.
The 2 mm diameter calculations can be considered for comparison (seeFig. 5). Results show that small spots generate fast edge effects,
inducing tensile loading behind the shock front. Consequently, the tensile wave due to the edge effect crosses the main tensile wave very Fig. 5. Numerical results on the bonded composite assembly in case of a single 0.3 GPa shot with various focal spot diameters when the laser beam hits the thick composite plate (a) or the thin composite plate (b)– Evidencing different locations of the maximum of tensile stresses.
Fig. 6. Synthesis charts of the 2D effect numerical investigations for bonding assemblies showing stress magnitude and stress location as a function of focal spot diameter, in case of thick plate (a) or thin plate (b) loading.
close from the back face. At this depth, the tensile stress level is high. The superposition leads to create a maximum stress at this position. For this diameter, the bond reflection does not influence the maximum stress distribution anymore. To have a complete view, results from all the diameters can now be compared. For that, results are synthetized in
Fig. 6, using the same display than inFig. 4-b.
The conclusions are nearly the same whatever the loading skin is. Indeed, for both cases, there is a diameter threshold after which the 2D effects do not influence the position of the maximum stresses anymore. This value is between 4 and 5 mm if shooting from the thick face, and between 3 and 4 mm if shooting from the thin skin (see respectively
Fig. 6-a and b). Above this threshold, the tensile loading induced by edge effects arrives too late in the shock propagation to significantly influence the stress distribution. The position of the maximum tensile stress values is thus steered by thefirst shock reflection at the second bond interface and its reverberation on the front face (Fig. 5-b, 4 mm diameter). Below the threshold, the tensile loading induced by edge effects has the good timing to influence the position of the maximum. For small diameter, below 2 mm, the behavior is closed to the one observed for monolithic material. The edge effect tension moves the high tensile stress zone to the back face. However, the level of the maximum stress values is smaller than in case of other diameters due to the attenuation by these lateral release waves. In between (averagely between 2 and 4 mm), there is another regime which can be considered as a transition regime. In this regime, the arrival of the tensile wave induced by edge effects is slightly delayed, and progressively modifies the location of the highest tensile stress zone.
These results show that varying the focal spot diameter is not effi-cient for testing only the bondline in the assembly. Indeed, the max-imum of stresses is steered deeper inside the assembly, but not right on the bondline. However, these results also show that the best config-uration is obtained when using a laser focal spot diameter of 4 mm with a loading from the thick composite. In this configuration, the stress maximum value is high, and the closest from the bondline. For this reason, the following calculations will be performed with a 4 mm dia-meter focal spot.
3.2. Multi pulse configurations
In the previous section, a way to optimize the stress distribution was proposed without adjusting the laser source. It was the easiest solution because it can work with the existing setup in the laboratory. However, the best configuration found is not yet fully optimal. For that, other shock configurations can be investigated. These configurations would need new and different laser sources than the one historically used. They arefirst theoretically described. Then, numerical results are given for each configuration, with a particular focus on stress distribution. 3.2.1. Theoretical principle
InFig. 7, three different optimization solutions are proposed. Time
position diagrams are used for that, with the same assumption than in
Fig. 2. These solutions are:
- Tunable pulse duration (see 1st diagram inFig. 7): This
configura-tion is close to the historical configuration in the way the main tensile wave is generated. The main idea is to use a variable pulse duration, in order to change the timing of the release wave coming from the front face. If shifted a bit later, that is to say if the pulse duration is longer, then the crossing of the two release waves will be shifted later and deeper in the assembly. This shift changes the position of thefirst tensile stresses in the assembly, consequently the whole stress distribution. To put thefirst tensile stresses at the in-terface, the pressure pulse duration should be equal to the travel time of the release wave in the back face skin. But long pulse duration could be difficult to obtain with existing laser technology. - Double pulse on the front face (see 2nd diagram inFig. 7). The idea
is here to add an additional tensile loading using a second pulse and especially its release. In other words, an additional release is used to reload the tensile wave, for example to compensate the attenuation. The delay between the two pulses can be adjusted depending where highest stresses are needed. This solution is close to thefirst one above, except that the material is not loaded during a long time, which is not especially necessary since only the release is necessary to change the stress distribution.
- Symmetrical laser shock (last diagram inFig. 7). This solution is probably the most accurate one. One shock is driven on each face. Each shock propagation leads to its own tensile wave following the same phenomenon than the one in stake for basic configuration. However, the crossing of these propagations leads successively to a superposition of shocks (see 2P1 area inFig. 7) and a superposition of tensile loadings (-2P1 area). This level is significantly higher than anywhere else in the assembly. Moreover, this area is theoretically very sharp and as long as single pulse duration. The delay between the pulses can be used to position this area within the assembly. As shown inFig. 7, if one of the pulses is delayed from the other, the superposition of tensile waves will occur deeper in the assembly. Thanks to these characteristics, this configuration can potentially enable a true optimization, by choosing the position of maximum of tensile stresses (delay), and loading only this area (sharpness). This solution was patented[28].
In the following sub-sections, numerical results are given for each configuration to show their potential. Two different tools are used for that.
- Synthesis charts (Fig. 8-a, and 10-a). They are similar to the ones presented in the previous sections, that is to say both the maximum of tensile stresses and its position are displayed. On the horizontal axis, pressure pulse duration and the delay between the pulses are respectively given.
- Time-position-stress diagrams (Figs. 8–11) are also similar to the ones previously presented, except that additional information was added. The maximum stress areas are now displayed as purple re-gions. A dark purple zone means that the stresses are between the maximum value and 95% of the maximum value. A light purple zone means that the stresses are between the maximum and 70% of the maximum. This information was added to have an idea of the extent of maximum stress regions, and also to estimate the potential performance of the configuration. The 90% area can be considered as an area in which the maximum stress level is reached everywhere. This is particularly important when considering multiple maximum stress areas.
The focal spot is kept at 4 mm for all the calculations. The pressure level was lowered to 0.15 GPa in case of long pulse and symmetrical loading. Indeed, the longer pulse duration might initiate damage by bending, and the symmetrical shocks artificially led to a 0.3 GPa load. 3.2.2. Tunable pulse duration
The tuneable pulse results are given for the assembly of interest in
Fig. 8. Results show that the maximum of tensile stresses is rapidly located deep inside the material, at the middle of the thick skin. A 50 ns pulse duration leads to a maximum close to the back face, as previously shown. Then, the 100 ns calculation shows two different positions for the maximum, inside the two skins. Above this value, the maximum will remain located between 1 and 1.5 mm from the front face in the thick skin and no strong evolution. The maximum stress value grows for 300 ns after which it remains stable (see inFig. 8-a). The position of this area is due to a phenomenon similar to the one detailed in the 2D effect section. A shock, coming back from the bondline, is reflected on the front face into a tensile wave which reloads the main tensile loading. However, when looking to the maximum stress zone instead of looking
to the maximum value, a high tensile loading zone can be observed close to the interface (see 90% zone inFig. 8-b). In this case, the nu-merical results show that the bondline is loaded with about the same level as the composite thick skin laminate is. Thus, to avoid generating damage in the composite laminates, the bonded interface could be tested with this configuration if its bond strength value is lower than 90% of the composite interlaminar strength.
Fig. 9presents results obtained when trying to put thefirst stresses at the bonded interface. Theoretically, this configuration is interesting for two reasons: 1. thefirst stresses generated in the assembly might be the highest; 2. it is easy to calculate the necessary pulse duration be-cause it directly corresponds to back and forth time in the second skin (see inFig. 9). However, this configuration does not appear as inter-esting as expected. In case of the assembly of interest, a maximum loading zone is obtained close to the back face, but another one, slightly deeper in the composite laminate is also generated. Because of that, performance for this configuration cannot be improved.
To conclude this section, the obtained numerical results have shown that the long pulse configuration can be interesting to get deeper stress concentration. The range from 200 to 500 ns seems particularly inter-esting and would enable to test a bondline with a strength value up to 90% of the composite interlaminar one. However, the long loading time
can also represent a risk for the assembly integrity. Indeed, this loading can induce strong shear and bending loadings in the laminates. These effects were not evaluated in this study.
3.2.3. Double pulse solution
Compared to the previous results, it can be observed that the ma-terial under double pulse configuration, shown inFig. 10, is less loaded than in case of long pulses. For that, the maximum stress region extent (depth and timing) can be just compared (see Fig. 8-b and 10-b). Maximum stress region on the second tensile wave reflection is also no more visible. This is going into the good direction to avoid damage by bending for example. A batch of numerical calculations was performed with a delay between the pulses in the range [0–500 ns]. In this case, a local extremum can be observed for a 250 ns delay (Fig. 10-a). It is the value for which the tensile stresses are the closest to the bondline. Before and after, the maxima are located further in the thin skin la-minates (see in Fig. 10-a). This result is also interesting because it presents the overall highest maximum value. The corresponding time-position-diagram is given inFig. 10-b. Even if the maximum of stress is close to the bondline, it is not on the bondline. The stress level at the bond interface is in the range [70%max, 80%max]. Thus, the composite is loaded with higher stresses than the bond. Consequently, this Fig. 7. Schematic time/position diagrams presenting the three different optimization solutions: tunable pulse duration, double pulse on front face and symmetrical laser shocks.
Fig. 8. Tunable pulse numerical investigations for bonded assembly (0.15 GPa–4 mm diameter – [50–500 ns]), a) Synthesis chart showing stress magnitude and stress location as a function of pulse duration, b) Optimal stress distribution for 500 ns pulse shown as a time/position/pressure diagram with display enhancement.
optimization solution would work only for testing a bonding strength up to 80% of the composite interlaminar strength.
3.2.4. Symmetrical laser shock
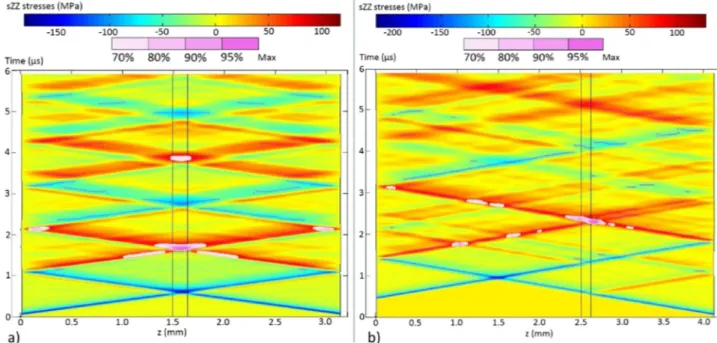
The symmetrical laser shock is presented in this section for two types of assemblies. A symmetrical assembly is proposed inFig. 11-a, and results for the assembly of interest are presented inFig. 11-b. As explained in the previous section, the symmetrical laser shock principle is quite simple. It consists in superposing two tensile waves, each wave being generated by the reflection of a shock initiated on the opposite side. To superpose this tension in the middle of the assembly in order to test a bond located there, the two shocks have to be produced at the same time. In this way, the travel time being the same until the bondline, the wave will intersect on it (as shown inFig. 11-a). A de-sirable outcome is that the stress distribution generated this way is at a tensile maximum in the bond, and only in it. The composite skins are of course loaded, but at a level between 10 and 20% lower than in the ideal bond strength. This result indicates that with this configuration, it should be possible to test an interface whose strength is about 100% of
the composite interlaminar strength.
If the bond line is not in the middle, then the delay between the pulses can be adapted. The delay can be adjusted simply by using the travel time in the two composite skins. One face is 2.5 mm thick, the other one is 1.5 mm thick and the bond is about 0.2 mm thick. To position the maximum tensile stress at the interface between the bond and the thin composite for example, thickness difference is about 1.2 mm. Considering the sound speed in the overall assembly about 3000 m/s, the delay should be equal to 400 ns. Results are presented in
Fig. 11-b and show a good positioning of the maximum tensile stresses at the interface. The other interface, or the bond bulk itself, could be equally loaded by slightly changing the delay. Like in the symmetrical assembly case, the maximum stress regions in the composite laminates are at least 10% below the maximum value, which leads to the same performances: a bond with a strength up to 100% of the composite interlaminar strength could be tested without damaging the composite skins.
Although the two previous optimal configurations required new laser sources in order to be tested– long pulses, synchronized double Fig. 9. Tunable pulse investigations forfirst stresses positioning on the bonded interface (0.15 GPa–4 mm diameter – 1 µs), time/postion/pressure diagram with maximum stresses display for the bonded composite assembly.
Fig. 10. Double pulse numerical investigations for bonded assembly (0.3 GPa–4 mm diameter – [50–500 ns]), a) Synthesis chart showing stress magnitude and stress location as a function of the delay between the two pulses, b) Optimal stress distribution for 250 ns delay between the pulses shown as a time/position/pressure diagram.
laser pulses– the symmetrical laser pulses, with no delay between the pulses, can be tested with the available sources. Indeed a beam splitter can be used to separate a unique laser pulse into two pulses (see in
Fig. 12). In order to check the numerical results, a Nd Yag laser (1064 nm, 25 ns pulse duration) was used, and the beam splitter had a 30/70 transmission/reflection ratio. To equilibrate the beam, optical densities were used to attenuate the reflected beam (see inFig. 12). The difference of optical path on the table was about 1 m, which leads to a 3 ns delay clearly acceptable considering the wave velocity and the geometrical uncertainty on the bond depth. A symmetrical assembly
was then tested, made of T700/M21 CFRP and FM300 bond. Interface was contaminated with release agent before bonding to get a weak bond. More details about the material can be found in[24]. As shown by the observations of cross sections performed on shocked samples, the symmetrical laser shock performed very well. In particular, the dis-bonding threshold is reached at 0.9 GW/cm2per beam, with no com-posite failure. This is a major improvement compared to previous work
[23-25]. Moreover, if the energy is increased above the threshold, the disbonding becomes much more obvious and the composite delamina-tion remains very small. This delaminadelamina-tion size is very different from Fig. 11. Symmetrical laser shock investigations forfirst and highest stresses positioning on the interface (0.15 GPa – 4 mm diameter), time/position/pressure diagram with maximum stresses display for a) a symmetric assembly, Dt = 0 ns and b) a non-symmetric assembly, Dt = 400 ns.
Fig. 12. First experimental demonstration of the symmetrical laser shock configuration – experimental setup and its schematic description - Cross section observation of shocked composite assemblies (red lines for laser beams, white lines for damage).
the one observed in the mono pulse configuration as shown by previous studies[22]. It presents much less transvers cracks through the ply than the damage morphology observed in mono pulse configuration. This phenomenon might be due to a bending loading quite different in case of symmetrical shock. Indeed, for a single shot, after the spallation in-itiation, the damage propagation is helped by a three-point bending like loading. The delaminated ply is attached on the edges (more or less corresponding to the focal spot dimension). With a second laser shock from the opposite surface, this bending effect might be balanced, thus leading to a sharper delamination between the plies and less transvers cracks. This hypothesis should be confirmed by another numerical campaign, at long time especially, when these phenomena occur. These experimental results partially validate the numerical predictions for this particular configuration.
4. Conclusions & perspectives
In the present paper, the optimization of the laser shock parameters in relation to a bonded composite assembly is discussed. Using nu-merical simulations, the performances of the historical basic config-uration werefirst analyzed, and three different optimization solutions were then proposed.
For the historical mono pulse configuration, a parametric study on the focal spot diameter showed that the edge effects can have an in-fluence on the material dynamic response to laser shock loading. Specifically, an edge effect modifies the back face velocity signal, and thus the stress distribution. In particular, the edge effect creates an additional tensile stress wave propagating behind the main shock front. The focal spot diameter delays its initiation and the crossing moment between it and the main tensile wave propagating from the back face. In some cases, this effect leads to a superposition of tensile stresses, which becomes the most loaded zone in the assembly. For the appli-cation of interest, the optimal configuration is a 4 mm spot diameter. In this configuration, the highest tensile stress values are the closest ones to the bondline. It was also demonstrated that, using the conventional mono pulse configuration, only a bond with an adhesion strength value up to 40% of the composite interlaminar strength is possible to detect without damaging the composite skins.
To go further, three optimization solutions were proposed: long laser pulses, double pulses on front face and symmetrical pulses. The long pulses calculation showed it was not enough to put the first stresses at the interface. In this case, the maximum values of stresses were observed deep inside thefirst skin due to transmission/reflection effects. In this configuration, only a bondline with an interface strength is lower than 80% of the ideal composite interlaminar strength can be tested without damaging the composite laminates. It is even the case if the pulse is about few 100 ns, performances are not better. Moreover, this configuration is not easy to test since a long pulse laser source might not be available high enough energy.
The double pulse configuration is interesting. Compared to the previous configuration, the bending effect of the assembly is limited. With a 250 ns delay, results showed that the maximum of tensile stresses can be brought close to the bondline. In this case, the stress distribution in the assembly enables to test an interface with a bond strength up to 80% of the composite interlaminar strength.
Only the symmetrical laser shock gives the possibility to test a bond interface with a bond strength up to 100% of the composite inter-laminar strength value, without damaging the composite laminates. In this case, the maximum of tensile stress is generated by the super-position of two“mono pulse induced” tensile waves. Because of that, the loaded region is much smaller and also sustains a higher load than everywhere else in the assembly. This is the most efficient optimization solution investigated in the present work.
As explained, the model uncertainty and material variation should be taken into account. It is possible that all of the stresses predicted could be reduced about 20%. In future work, improvements should be
made on the model for a more accurate estimation of stresses. For that, strain rate should be taken into account for the deformation behavior but also in the damage modelling.
Corresponding experiments will be performed to validate these model predictions. For that, new laser sources have been acquired, and work has started[29].
CRediT authorship contribution statement
Romain Ecault: Conceptualization, Methodology, Software, Validation, Writing - original draft.Fabienne Touchard: Supervision, Writing - review & editing, Conceptualization, Methodology.Laurent Berthe: Supervision, Conceptualization, Methodology, Resources. Michel Boustie: Supervision, Conceptualization, Methodology, Funding acquisition.
Declaration of Competing Interest
The authors declare that they have no known competingfinancial interests or personal relationships that could have appeared to influ-ence the work reported in this paper.
Acknowledgements
The research leading to these results has received funding from the European Union's Seventh Framework Program (FP7/2007-2013) under grant agreement n° ACP0-GA-2010-266226 (ENCOMB, Extended Non-Destructive Testing of Composite Bonds).
The research leading to these results has received funding from the European Union’s Horizon 2020 research and innovation program under grant agreement No 636494.
I dedicate this paper to my second son, currently growing in his mother’s belly.
References
[1] Wang Gong-Dong, Melly Stephen Kirwa, Li Nan. Using dampers to mitigate thrust forces during carbon-fibre reinforced polymer drilling: experimental and finite element evaluation. J Reinforced Plastics Compos 2018;37(1):60–74.
[2] Stelzer S, Ucsnik S, Pinter G. Strength and damage tolerance of composite-compo-site joints with steel and titanium through the thickness reinforcements. Compos Part A-Appl Sci Manuf 2016;88:39–47.
[3] Löbel, Thomas, Disbond Stopping Concept: Surface Toughening. BOPACS Symposium, 05.-06. Sep. 2016, Hamburg, Deutschland; 2016.
[4] Löbel, Thomas und Kühn, Markus und Holzhüter, Dirk und Hühne, Christian, Experimental Investigations of the Disbond Stopping Capability of a Novel Epoxy-Thermoplastic Bondline Architecture for Composite Joints. In: Proceedings of the 16th European Conference on Composite Materials. ECCM-16, 22.-26. Jun. 2014, Sevilla, Spanien; 2014.
[5] Lopez-Cruz Pedro, Laliberte Jeremy, Lessard Larry. Investigation of bolted/bonded composite joint behaviour using design of experiments. Compos Struct
2017;170:192–201. [6] www.combondt.eu.
[7] Tornow C, Schlag M, Leite Cavalcanti W, Brune K, Dieckhoff S, Mayer B. In-process
quality assurance procedures for surface preparation in adhesive bonding of light-weight composite structures. Presented in the WCARP 2018 (41st Annual & 6th WCARP Meeting), San Diego CA. 2018.
[8] De Vito S, Salvato M, Massera E, Formisano F, Miglietta ML, Esposito E, Di Francia G. Testing an electronic nose for pre-bond NDT in Realistic CFRP Parts assembly and repair. Presented in the IEEE Metrology for Aerospace workshop 2018 in Italy. 2018.
[9] Solodov Igor, Segur Damien, Kreutzbruck Marc. Evaluation of bonding quality in CFRP composite laminates by measurements of local vibration nonlinearity. Presented in the ECNDT 2018, Gothenburg, Sweden. 2018.
[10] Malinowski P, Wandowski T, Ostachowicz W. The use of electromechanical im-pedance conductance signatures for detection of weak adhesive bonds of carbon fibre–reinforced polymer. Struct Health Monit 2015;14(4):332–44.
[11] Malinowski Paweł H, Tserpes Konstantinos I, Ecault Romain, Ostachowicz Wiesław M. Study of adhesive bonds by mechanical tests, ultrasounds and electromechanical impedance method. Proceeding of IWSHM2017. 2017.
[12] Vossen JL. Measurements offilm-substrate bond strength by laser spallation. Adhesion Measurement of Thin Films, Thick Films, and Bulk Coatings. ASTM International; 1978.
technique. J Appl Phys 1993;74(4):2388–410.
[14] Bolis C., Etude numérique et expérimentale de la séparation par chocs brefs d’in-terface de revêtement multi-couches. Application au test d’adhérence par chocs laser, Thèse de l’Université de Poitiers, Ecole Doctorale Sciences pour l’Ingénieur; 2004.
[15] Arrigoni M, Etude de l’influence des rugosités d’interface, de porosités, et de l’épaisseur d’échantillon sur la propagation des chocs dans des systèmes revêtus. Application au procédé LASAT (LASer Adherence Test), Thèse de l’Université de Poitiers, Ecole Doctorale Sciences pour l’Ingénieur; 2004.
[16] Barradas S, Molins R, Jeandin M, Arrigoni M, Boustie M, Bolis C, et al. Application of laser shock adhesion testing to the study of the interlamellar strength and coating–substrate adhesion in coldsprayed copper coating of aluminum, published in. Surface Coatings Technol 2005;197(2005):18–27.
[17] Laporte D, Malaise F, Boustie M, Chevalier JM, Buzaud E, Thessieux C. Dynamic behaviour of two adhesive materials. DYMAT 19th Proc. (Strasbourg, France). 2010. p. 245.
[18] Gay E, Berthe L, Boustie M, Arrigoni M, Buzaud E. Effects of the shock duration on the response of CFRP composite laminates. J Phys D Appl Phys
2014;47(45):455303.
[19] Bossi R, et al. Laser bond testing. Mater Eval 2009;67:819–27.
[20] Perton M, Blouin A, Monchalin J-P. Adhesive bond testing of carbon–epoxy com-posites by laser shockwave. J Phys D: Appl Phys 2010;44:034012.
[21] Gay E, Berthe L, Boustie M, Arrigoni M, Trombini M. Study of the response of CFRP composite laminates to a laser-induced shock. Compos B Eng 2014;64:108–15. [22] Ecault R, Boustie M, Touchard F, Pons F, Berthe L, Chocinski-Arnault L, et al.
Bockenheimer «A study of composite material damage induced by laser shock waves». Compos Part A 2013;56:54–64.https://doi.org/10.1016/j.compositesa. 2013.05.015.
[23] Ecault R, Boustie M, Berthe L, Touchard F, Chocinski-Arnault L, Voillaume H, Campagne B. Development of the laser shock wave adhesion test on bonded CFRP composite. Int J Struct Integrity 2014;5(4):253–61. https://doi.org/10.1108/IJSI-10-2013-0032.
[24] Ehrhart B, Ecault R, Touchard F, Boustie M, Berthe L, Bockenheimer C, Valeske B. Laser shock adhesion test for the control of weak adhesive bonded CFRP structures. Int J Adh Adh 2014;52:57–65.
[25] Ecault R, Touchard F, Boustie M, Berthe L, Dominguez N. Numerical modeling of laser-induced shock experiments for the development of the adhesion test for bonded composite materials. Compos Struct 2016;152:382–94.
[26] Bardy S, Aubert B, Berthe L, Combis P, Hébert D, Lescoute E, et al. Numerical study of laser ablation on aluminum for shock-wave applications: development of a sui-table model by comparison with recent experiments. Opt Eng 2016;56(1):011014. [27] Berthe L, Fabbro R, Peyre P, Bartnicki E. Wavelength dependent of laser shock-wave
generation in the water-confinement regime. J Appl Phys 1999;85(11):7552–5. [28] Boustie, M, Ecault R, Berthe L, Method of non-destructivetesting comprising the
generation of a state of localised and controlled traction in a multi-material and/or multi-layer assembly. WO Patent App. PCT/FR2014/053,300; 2015.
[29] Courapied D, Berthe L, Peyre P, Coste F, Zou J-P, Sautivet A-M. Laser-delayed double shock-wave generation in water-confinement regime. J Laser Appl 2015;27(S2).https://doi.org/10.2351/1.4906382. S29101.

![Fig. 10. Double pulse numerical investigations for bonded assembly (0.3 GPa – 4 mm diameter – [50 – 500 ns]), a) Synthesis chart showing stress magnitude and stress location as a function of the delay between the two pulses, b) Optimal stress distribution](https://thumb-eu.123doks.com/thumbv2/123doknet/7328319.211344/10.892.189.703.80.390/numerical-investigations-assembly-diameter-synthesis-magnitude-location-distribution.webp)