UNIVERSITE DE
SHERBROOKE
Faculte de genie
Departement de genie chimique
ATTENUATION OF GREENHOUSE GAS EMISSIONS BY MEANS OF METHANE BIOFILTRATION:
OPTIMIZATION OF THE OPERATING PARAMETERS
ATTENUATION DES EMISSIONS DE GAZ A EFFET DE SERRE PAR BIOFILTRATION DU METHANE:
OPTIMISATION DES PARAMETRES OPERATOIRES
THESE DE DOCTORAT E S SCIENCES APPLIQUEES
Speciality: genie chimique
Composition du jury Professeur Bernard Marcos Professeure Michele Heitz Professeur Ryszard Brzezinski Professeur Yves Andres
Sompassate Josiane NIKIEMA
1*1
Library and Archives Canada Published Heritage Branch 395 Wellington Street OttawaONK1A0N4 Canada Bibliotheque et Archives Canada Direction du Patrimoine de I'edition 395, rue Wellington OttawaONK1A0N4 CanadaYour file Votre reference ISBN: 978-0-494-52847-1 Our file Notre reference ISBN: 978-0-494-52847-1
NOTICE: AVIS:
The author has granted a
non-exclusive license allowing Library and Archives Canada to reproduce, publish, archive, preserve, conserve, communicate to the public by
telecommunication or on the Internet, loan, distribute and sell theses
worldwide, for commercial or non-commercial purposes, in microform, paper, electronic and/or any other formats.
L'auteur a accorde une licence non exclusive permettant a la Bibliotheque et Archives Canada de reproduire, publier, archiver, sauvegarder, conserver, transmettre au public par telecommunication ou par I'lnternet, preter, distribuer et vendre des theses partout dans le monde, a des fins commerciales ou autres, sur support microforme, papier, electronique et/ou autres formats.
The author retains copyright ownership and moral rights in this thesis. Neither the thesis nor substantial extracts from it may be printed or otherwise reproduced without the author's permission.
L'auteur conserve la propriete du droit d'auteur et des droits moraux qui protege cette these. Ni la these ni des extraits substantiels de celle-ci ne doivent etre imprimes ou autrement
reproduits sans son autorisation.
In compliance with the Canadian Privacy Act some supporting forms may have been removed from this thesis.
Conformement a la loi canadienne sur la protection de la vie privee, quelques
formulaires secondaires ont ete enleves de cette these.
While these forms may be included in the document page count, their removal does not represent any loss of content from the thesis.
Bien que ces formulaires aient inclus dans la pagination, il n'y aura aucun contenu manquant.
1*1
« Du haut du ciel, le Seigneur plonge son regard, II apergoit tous les humains. De Vendroit ou il siege, il observe tous les habitants de la terre. Lui qui leur a cree a tous intelligence et volonte, ilprend garde a ce qu'ilsfont. »
Extrait de la Bible, Psaumes 33: 13-15
« From heaven the Lord looks down and sees everyone. From his throne he watches all those who live on the earth. He creates the hearts of all people. He is aware of everything they do. »
Abstract
The main goal of this work has been that of optimizing the operating conditions of a bio filter, intended for the control of methane, an important greenhouse gas widely emitted by older or smaller landfill installations. The specific objectives were: 1) to select a suitable packing material (of organic or inorganic type); 2) to optimize the concentrations of input nutrients, mainly consisting of nitrogen, phosphorus, potassium and copper, which are intended to be introduced via the nutrient solution; 3) to determine the optimized values of the most important design parameters, such as the methane inlet load (which depends on the air flow rate and the inlet methane concentration); and 4) to model the biofilter performance.
Firstly, the comparison of the two packing materials, one of organic type, and the other of inorganic type, has revealed that the latter was the more appropriate material for the methane biofiltration. Then, through the use of the selected packing material, the influence of each individual nutrient on the efficiency of the process has been investigated. The results obtained have shown that both nitrogen and phosphorus concentrations have to be controlled, while potassium and copper were revealed as being nutrients of only minor importance.
Secondly, the optimization of the inlet gas flow rate and of the inlet methane concentration (and consequently, of the methane inlet load also), has been performed. According to the results of the studies, these parameters require good control during methane biofiltration because a limitation in biofilter performance could otherwise be induced. In addition, it was noted that the increase in the inlet gas flow rate led generally to a greater decrease of the methane conversion than the one induced by the inlet methane concentration.
Finally, a new method, based on the use of solid extracts sampled from the methane biofilter, has been applied to the determination of methane biofilter kinetic parameters. Following this study, a steady state model of the methane biofiltration, taking into consideration the important operational parameters, as identified previously, has been developed. One particular feature of this model is that it takes into consideration the influence of the biofilter average temperature. The prediction results, obtained with the use of the model, have been successfully compared with the experimental results.
Keywords: Biofiltration; methane; landfill; packing material; nutrients; operating parameters; kinetic parameters; model
Resume
L'objectif principal de cette these a ete d'optimiser les conditions operatoires d'un biofiltre destine a l'elimination du methane, un gaz a effet de serre emis par les sites d'enfouissement sanitaire de petites tailles ou relativement ages. Les objectifs specifiques etaient: 1) de selectionner un lit filtrant adapte au proced6; 2) d'optimiser les concentrations de nutriments, principalement 1'azote, le phosphore, le potassium et le cuivre, fournis au biofiltre par 1'intermediate de la solution nutritive; 3) d'identifier les valeurs optimales des parametres de design les plus importants, notamment la charge initiale de methane (qui depend du debit d'air et de la concentration initiale de methane); et 4) de modeliser les performances du biofiltre. Dans un premier temps, la comparaison de deux lits filtrants, l'un de nature organique, et 1'autre de type inorganique, a montre que le dernier lit filtrant etait le plus approprie pour la bio filtration du methane. Par la suite, 1'influence de chaque nutriment sur les performances du biofiltre a ete etudiee, en utilisant le lit filtrant selectionne. Les resultats obtenus ont demontre que les concentrations d'azote et de phosphore doivent etre convenablement ajustees tandis que celles du potassium et du cuivre se sont revelees etre de moindre importance.
Dans un deuxieme temps, l'optimisation du debit d'air introduit dans le biofiltre ainsi que de la concentration initiale de methane (et par consequent de la charge initiale de methane aussi), a ete effectuee. Considerant les resultats de cette etude, ces deux parametres necessitent un bon controle au cours de la biofiltration du methane, sinon une baisse de performance pourrait survenir. De plus, il a ete note que 1'augmentation du debit d'air occasionne generalement une diminution de la conversion de methane plus importante que celle causee par 1'augmentation de la concentration initiale du methane.
Finalement, une nouvelle methode utilisant des echantillons de lits filtrants, preleves directement dans le biofiltre traitant le methane, a permis la determination des parametres cinetiques de la biofiltration du methane. Par la suite, un modele decrivant le fonctionnement du biofiltre en regime permanent, et prenant en compte les principaux parametres operatoires prealablement identifies, a ete developpe. Une caracteristique importante de ce modele est qu'il integre la temperature moyenne dans le biofiltre. Les resultats predits a partir de ce modele se sont reveles satisfaisants lorsque compares aux donnees experimentales.
Mots-cles: Biofiltration; methane; enfouissement sanitaire; lit filtrant; nutriments; parametres operatoires; parametres cinetiques; modele
Remerciements
Je tiens a adresser mes sinceres remerciements a toutes les personnes et institutions qui n'ont menage aucun effort pour la reussite de me etudes doctorales. Citons entre autres:
* Michele Heitz, ma Directrice de recherche, professeure au Departement de genie chimique de la Faculte de genie de l'Universite de Sherbrooke. Elle m'a ouvert la porte de son Laboratoire (Biocom) et m'a fait confiance. Plus d'une fois, j'ai pu compter sur son soutien, ses conseils et sa disponibilite. Sa contribution a ma reussite est tout simplement inestimable.
* Le Conseil de Recherche en Sciences Naturelles et en Genie du Canada, au travers duquel j'ai beneficie d'une bourse d'etudes superieures du Canada pour mes etudes doctorales.
* L' ensemble des membres du groupe Biocom, notamment Louise Bibeau, Matthieu Girard, Antonio Avalos Ramirez, Yaomin Jin, et Paul-Andre Dastous. lis ont toujours ete presents pour moi et ont su, en permanence, creer une ambiance de travail agreable.
* Ryszard Brzezinski, professeur au Departement de biologie de la Faculte des sciences de l'Universite de Sherbrooke, ainsi que son etudiant Pascal Viens. Un grand merci pour vos conseils et votre appui.
* Guy Payre, professeur au Departement de genie mecanique de la Faculte de genie de l'Universite de Sherbrooke. Sa participation lors de 1'elaboration du modele presente dans cette these a permis de releve le defi, et ce, avec brio.
* Peter Lanigan, traducteur. Merci pour tous les efforts investis dans les revisions des documents.
* L'ensemble des techniciens et secretaires du Departement de genie chimique et de genie biotechnologique (Faculte de genie, Universite de Sherbrooke), qui se sont montres promptes a me venir en aide, chaque fois que cela etait necessaire.
* L'ensemble de mes amis, incluant Claude Ariane Kamga Youmbi et Mathieu Baga, sur lesquels j'ai pu, et peut toujours, compter en permanence.
* Toute ma famille, notamment mes parents Rose et Denis Nikiema, mes freres Regis et Wenceslas, ma soeur Christelle ainsi que mes oncles et tantes. lis ont su m'encourager et me soutenir dans la poursuite de mes etudes doctorales.
* Franck Sohou, mon epoux. Qui d'autre que toi aurait pu me reconforter et m'encourager a poursuivre malgre les obstacles ?
Table of contents
GENERAL PRESENTATION II
CHAPITRE 1. INTRODUCTION - ELIMINATION OF METHANE GENERATED
FROM LANDFILLS BY BIOFILTRATION: A REVIEW 4
1.1. Abstract 4 1.2. Introduction 5 1.3. Sanitary landfills 6 1.4. Biogas 7 1.4.1. Biogas composition 7 1.4.2. Biogas production 8 1.4.3. Methane in the biogas 10 1.4.4. Biogas valorization 11 1.4.5. Biogas elimination 12 1.5. Methane Biofiltration 13
1.5.1. Configuration 13 1.5.2. Micro-organisms 17 1.5.3. Inoculation and incubation 22
1.5.4. Parameters 23 1.6. Landfill covers 31 1.7. Conclusion 33 1.8. Acknowledgements 34
CHAPITRE 2. INFLUENCE OF METHANE INLET LOAD AND NITROGEN
CONCENTRATION DURING BIOFILTRATION 35
2.1. Abstract 35 2.2. Introduction 36 2.3. Material and methods 39
2.3.2. Biofilter configuration and equipments 39
2.3.3. Nutrient solution 41 2.4. Results and discussion 42
2.4.1. Methane elimination in the compost-based bed 43 2.4.2. Methane elimination in the inorganic-based bed 46
2.5. Conclusion 53 2.6. Acknowledgments 54
CHAPITRE 3. THE INFLUENCE OF PHOSPHORUS, POTASSIUM AND COPPER
ON METHANE BIOFILTRATION PERFORMANCE 55
3.1. Abstract 55 3.2. Introduction 56
3.2.1. The role of phosphorus according to the literature 59 3.2.2: The role of potassium according to the literature 60 3.2.3. The role of copper according to the literature 61
3.3. Material and methods 61 3.3.1. Description of the laboratory-scale system 61
3.3.2. Experimental procedure 63 3.3.3. Assessment parameters 64
3.4. Results 65 3.4.1. Influence of phosphorus 65
3.4.2. Elimination capacity at an inlet load of 75 g/m3/h 66
3.4.3. Production of carbon dioxide at an inlet load of 75 g/m3/h 69 3.4.4. Influence of the P concentration on biofilter efficiency with variable inlet loads ..71
3.4.5. Influence of potassium, magnesium and calcium 73 3.4.6. Influence of copper, zinc, manganese, boron, molybdenum, cobalt and iodine 75
3.5. Conclusion 77 3.6. Acknowledgments 79
CHAPITRE 4. THE INFLUENCE OF THE GAS FLOW RATE DURING METHANE
BIOFILTRATION ON AN INORGANIC PACKING MATERIAL 80
4.1. Abstract 80 4.2. Introduction 81 4.3. Material and methods..'. 84
4.4. Results 88 4.4.1. Influence of the flow rate on the conversion 88
4.4.2. Operational ranges and optimal volumetric loads 91 4.4.3. Influence of the gas flow rate on the elimination capacity and the production of
carbon dioxide 93 4.5. Conclusion 97 4.6. Acknowledgments 98
CHAPITRE 5. A NEW METHOD TO DETERMINE THE MICROBIAL KINETIC
PARAMETERS IN BIOLOGICAL AIR FILTERS 99
5.1. Abstract 99 5.2. Introduction 100 5.3. Equipment and procedures 101
5.3.1. Continuous biofiltration setup 101
5.3.2. Kinetic protocol 102 5.3.3. Analysis tools 103 5.4. Results and discussion 105
5.4.1. Determination of the specific growth rates 105 5.4.2. Determination of the kinetic parameters 106
5.5. Conclusion 113 5.6. Acknowledgements 114
5.7. Notations 115
CHAPITRE 6. A MATHEMATICAL STEADY STATE MODEL FOR METHANE
BIOELIMINATION IN A CLOSED BIOFILTER 116
6.2. Introduction 117 6.3. Model development 118
6.3.1. Hypothesis 118 6.3.2. Mathematical model 120
6.4. Materials and methods 128 6.4.1. Design of the biofiltration system 128
6.4.2. Description of the assessment parameters 129
6.5. Results 130 6.5.1. Parameters' estimation 130
6.5.2. Modeling of the biofilter conversion and elimination capacity 133
6.5.3. Modeling of the production of carbon dioxide 137
6.5.4. Modeling of the biofilter temperature 140 6.6. Profiles of concentrations in the biofilter 141
6.7. Discussion- Model's limits 143
6.8. Conclusion 144 6.9. Nomenclature 145 6.10. Acknowledgements 146
GENERAL CONCLUSION 148
CHAPITRE 7. APPENDIX - CONTROL OF METHANE EMISSIONS ISSUING FROM
LANDFILLS: THE CANADIAN CASE 153
7.1. Abstract 153 7.2. Introduction 154
7.2.1. Wastes in Canada 154 7.2.2. The biogas and the leachate 155
7.2.3. The methane biofiltration 156 7.3. Materials and methods 157
7.4. Results 158 7.5. Conclusion 161 7.6. Acknowledgements 162
CHAPITRE 8. REFERENCES 163 8.1. Introduction 163 8.2. Chapter 1 163 8.3. Chapter 2 178 8.4. Chapter 3 179 8.5. Chapter 4 183 8.6. Chapter 5 .' 185 8.7. Chapter 6 186 8.8. Appendix •. 188
List of Tables
Table 1-1: Typical composition ranges for biogas produced in a landfill 9
Table 1-2: Performance parameters used in biofiltration 14 Table 1-3: Experiments on the topic of methane biofiltration 15 Table 1-4: Optimal water content for some filter beds for methane elimination 30
Table 2-1: Composition of the multi-component nutrient solution (NS2) 42 Table 2-2: Parameters used to quantify the performance of a biofilter 43 Table 3-1: Typical compositions for the nutrients proposed by the authors 59 Table 3-2: Composition of the 5 main solutions used in order to form the experimental
nutrient solutions; NS1, NS2 and NS3 64 Table 3-3: Parameters used to quantify the performance of a biofilter 65
Table 3-4: Preparation of nutrient solutions; NS1, NS2 and NS3, using solutions A, B, C, D
and E 66 Table 3-5: Maximum concentrations and mass ratios of trace minerals present in solution C.76
Table 4-1: Composition of the nutrient solutions: NS1 and NS2 86
Table 4-2: Description of the assessment parameters 87
Table 6-1: Values of the model parameters 121 Table 7-1. Parameters used to express the results 158
List of Figures
Figure 2-1: Lab-scale biofiltration system 40 Figure 2-2: The elimination capacity in the organic-based bio filter as a function of the
nitrogen concentration inNSI for an inlet load of 75 g/m /h 44 Figure 2-3: The elimination capacity in the organic-based bio filter as a function of the
nitrogen concentration in NS2 for inlet loads of 55, 75 and 95 g/m3/h 45 Figure 2-4: The elimination capacity in the inorganic-based bio filter as a function of the inlet
load for nitrogen concentrations in NS2 of 0.14; 0.25; 0.50; 0.75 and 1.0 g/1 46 Figure 2-5: The inlet load and elimination capacity in the inorganic-based bio filter as a
function of time, at nitrogen concentrations in NS2 of 1.0 and 0.50 g/1 48 Figure 2-6: The carbon dioxide production rate in the inorganic-based biofilter as a function of
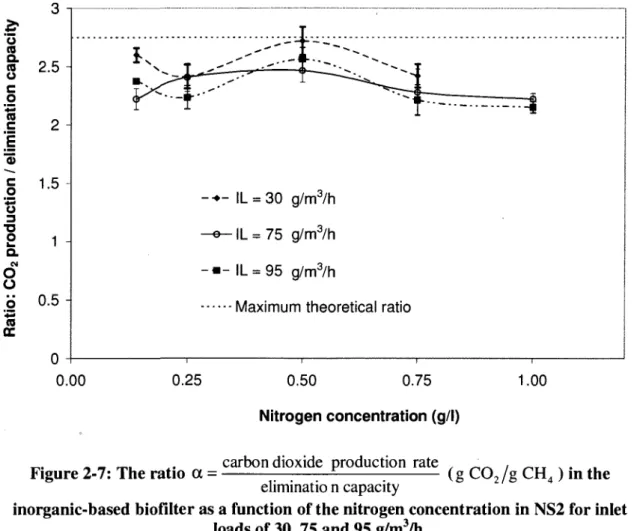
the inlet load for nitrogen concentrations in NS2 of 0.14; 0.25; 0.50; 0.75 and 1.0 g/1....49 ^. „ „ ™ . carbon dioxide production rate , „ ^ , ^TT N . , .
Figure 2-7: The ratio a = (g C02/g CH4 ) in the morganic-eliminatio n capacity
based biofilter as a function of the nitrogen concentration in NS2 for inlet loads of 30, 75
and95g/m3/h 51
Figure 2-8: The elimination capacity in the inorganic-based biofilter as a function of the
nitrogen concentration in NS2 and NS3 for an inlet load of 75 g/m3/h 53
Figure 3-1: Lab-scale biofiltration system 62 Figure 3-2: The elimination capacity (g/m3/h) and the carbon dioxide production rate (g/m3/h)
as a function of the phosphorus concentration (g/L); Inlet load = 75 g/m3/h 67 Figure 3-3: The variations of the pressure drop (Pa/m) and the elimination capacity (g/m3/h)
with time (days); phosphorus concentration = 3.1 g/L and an inlet load = 75 g/m3/h 69 Figure 3-4: The ratio (carbon dioxide production)/(elimination capacity) (i.e. a) and the
elimination capacity (g/m3/h) as a function of the phosphorus concentration (g/L); Inlet
load = 75 g/m3/h 70
Figure 3-5: The elimination capacity (g/m3/h) as a function of the inlet load (g/m3/h) for two
Figure 3-6: The carbon dioxide production (g/m3/h) as a function of the inlet load (g/m3/h) for
the two phosphorus concentrations, i.e. 0.3 and 1.5 g/L 73 Figure 3-7: The elimination capacity (g/m3/h) and the ratio a (i.e. (carbon dioxide production)
/ (elimination capacity)) as a function of the potassium concentrations (g/L); Inlet load =
75g/m3/h 74
Figure 3-8: The elimination capacity (g/m3/h) and the carbon dioxide production rate (g/m3/h)
as a function of the copper concentration (g/L); Inlet load = 75 g/m3/h 77
Figure 4-1: Lab-scale biofiltration system 85 Figure 4-2: Conversion as a function of inlet methane concentration for gas flow rates of 1, 2,
3 and 5.5 L/min; nutrient solution: 0.3 g-P/L 89 Figure 4-3: Conversion as a function of inlet methane concentration for gas flow rates of 2, 3
and 5.5 L/min; nutrient solution: 1.5 g-P/L 90 Figure 4-4: Elimination capacity as a function of inlet methane concentration for gas flow
rates of 2, 4.2 and 5.5 L/min; nutrient solutions: NS1 (0.3 g-P/L) and NS2 (1.5 g-P/L)..94 Figure 4-5: Carbon dioxide production as a function of methane elimination capacity for gas
flow rates of 2, 3, 4.2 and 5.5 L/min; nutrient solutions: NS1 (0.3 P/L) and NS2 (1.5
g-P/L) 96
Figure 5-1: Typical experimental evolutions of the mass of bio mass and methane
concentration versus time (20 g solid extracts, C0CH - 9.6 g.m") 106 Figure 5-2: Evolution of the specific growth rate versus the initial methane concentration:
Representation of the Mo nod and Haldane models considering all experimental data.. 107 C
Figure 5-3: Evolution of —:—- versus the initial methane concentration for range 1 108 C
Figure 5-4: Evolution of ——^- versus the adjusted initial methane concentration for range II. 110 Figure 5-5: Evolution of the specific growth rate versus the initial methane concentration;
Figure 5-6: Evolution of the biomass yield coefficients versus the initial methane
concentration 113
Figure 6-1: Phenomena occurring within the bio filter and considered in the present model. 121 Figure 6-2: Average biofilter temperature (°C) expressed as a function of the elimination
capacity (g/m3/h) for gas flow rates of 4.2 and 5.5 L/min 131
Figure 6-3: Production of CO2 (g/m3/h), in the gas phase, as a function of the elimination capacity (g/m /h) of the biofilter, during steady state operation (gas flow rate = 4.2
L/min; CH4 concentration: < 9500 ppmv) 133
Figure 6-4: CH4 conversion (predicted and experimental values) (%) expressed as a function
of the gas flow rate (L/min), for an inlet CH4 concentrations of 7500 ppmv 135 Figure 6-5: CH4 conversion (predicted and experimental values) (%) expressed as a function
of the gas flow rate (L/min), for an inlet CH4 concentrations of 2500 ppmv 135 Figure 6-6: Elimination capacity in the CH4 biofilter as a function of the inlet CH4
concentration (1500 to 9500 ppmv) for different gas flow rates (1 to 5.5 L/min) 137 Figure 6-7: CO2 production (g/m /h) as a function of the gas flow rate (L/min) for an inlet CH4
concentration of 9500 ppmv 138 Figure 6-8: C02 production (g/m3/h) as a function of the inlet CH4 concentration (< 9500
ppmv) for different gas flow rates (1 to 5.5 L/min) 139 Figure 6-9: Biofilter average temperature (°C) (experimental and predicted values) as a
function of the gas flow rate (< 5.5 L/min) ...140 Figure 6-10: Typical height of the filter bed (m) presented as a function of the predicted
concentrations of CH4 and CO2, within the gas phase (inlet CH4 concentration = 6.3 g/m3
(or 9500 ppmv); gas flow rate = 2 L/min) 142 Figure 6-11: Typical predicted concentrations of CH4 and CO2 within the bio film phase,
represented as a function of the biofilm depth (m); (height level of the packing material
within the biofilter: 0.1 m) 143
Figure 7-2: Conversion (%) and inlet load (g/m3/h) in the biofilter as a function of time (days). 159 Figure 7-3: Elimination capacity (g/m /h) and carbon dioxide production (g/m /h) in the
GENERAL PRESENTATION
An airborne pollutant is a substance that has a negative influence on human health and/or contributes to the degradation of animal and vegetal lives, and also of the associated water and soil resources, etc. According to Environment Canada, the main types of airborne pollutants can be grouped within 4 categories; these are: 1) criteria air contaminants and related pollutants, being responsible for both smog formation and acid rains, and which include various pollutants such as particulate matter, volatile organic compounds (VOCs) and oxides of nitrogen and sulphur; 2) persistent organic pollutants, such as the polychlorinated biphenyls (PCBs), dioxins, furans, and various pesticides; these semi-volatile organic molecules having the property of accumulating in those living organisms contacting with them; 3) heavy metals, such as mercury, cadmium and lead; these elements being generally emitted in association with the fine particles, i.e. with particle diameters of < 2.5 urn, and 4) toxic pollutants, i.e. those pollutants listed under the Canadian Environmental Protection Act, 1999 (Schedule 1), such as methanol, benzene and several others (Environment Canada, 2008a).
In addition to this listing, one also has the greenhouse gases (GHG) category. This grouping includes those substances that are not necessarily toxic for either animals or the general environment, but otherwise facilitates the shortwave and the solar radiation to reach the earth, leading to an increase in the earth's superficial temperature. Among the anthropogenic GHG are: water vapor, carbon dioxide (CO2), nitrous oxide (N2O) and methane (CH4). The concentration of this latter GHG has increased by some 150 %, on average, over the most recent 250 years (as compared with 31 % and 17 % for CO2 and N20, respectively) (Environment Canada, 2008b).
The main anthropogenic CH4 emissions are linked with various agricultural practices (e.g. livestock, flooded rice cultivation, etc.), with a proportion of 25 %, the energy (i.e. mainly through coal mining and fuel gas delivery systems) with a proportion of 50 %, and organic wastes decomposition, mainly taking place within landfills, and with a proportion of 25 %. According to Environment Canada, a reduction of some 8 % of the total emissions is
necessary in order to hold the present increase of the CH4 concentration in the atmosphere (Environment Canada, 2008c).
The first chapter of this present thesis begins with a description of sanitary landfills and how the resulting product biogas is obtained, following the wastes' disposal. Then, the biogas processing is presented: i.e. detailing its composition and describing possible valorization and elimination techniques that may be applied. Among the latter is the biofiltration method, which has been the subject of much detailed attention. As a consequence, the configuration of the biofilter, the types of micro-organisms involved and the major operating parameters (e.g. filter bed material selection, pH and moisture content of the filter bed, nutrients, operating temperature and inlet loads of methane) that require control during CH4 biodegradation are discussed.
In Chapters 2 and 3, the influences of the input nitrogen and of the inlet load, on the methane biofilter, are presented. Two filter bed material types have been considered and compared: i.e. an organic compost material and an inorganic gravel material. Following this comparative study, the inorganic filter bed has been selected and a further study has been undertaken on the influence of the phosphorus concentration during the methane biofiltration. It is important to note that this has been the first study performed having the aim of determining the influence of the input phosphorus nutrient during the overall methane biofiltration process. The particular behavior and response, induced by the presence or abundance of phosphorus, is also discussed, taking into account the inlet load applied at the biofilter entry point.
In Chapter 4, the main interest examined is that of the influence of the total gas flow rate on the methane biofiltration. Indeed, this parameter affects the mass transfer of the pollutant methane, this in turn therefore has an effect on the overall biofilter performance.
In order to model the biofilter performance, it is necessary to determine the values of the microkinetic parameters. This matter has formed the subject of Chapter 5. It is to be noted that the determination of the kinetic parameters has never been effected (according to our knowledge) for application of methane biodegradation into air biofilters.
Finally, Chapter 6 presents the steady state model, as developed to estimate the performance of the methane treating biofilter, in terms of the conversion, elimination capacity and carbon dioxide production parameters, and which also integrates the main results obtained previously during methane biofiltration studies.
CHAPITRE i. INTRODUCTION - ELIMINATION OF METHANE
GENERATED FROM LANDFILLS BY BlOFILTRATION: A REVIEW
Authors: J. Nikiema, R. Brzezinski and M. Heitz
Paper published in the Re/Views in Environmental Science and Bio/Technology, 6(4): 261-284, (2007).
1.1. Abstract
The production of biogas in landfills, its composition and the problems resulting from its generation are all reviewed. Biofiltration is a promising option for the control of emissions to atmosphere of the methane contained in biogas issued from the smaller and/or older landfills. A detailed review of the methane biofiltration literature is presented. The micro-organisms, mainly the methanotrophs, involved in the methane biodegradation process, and their needs in terms of oxygen and carbon dioxide utilisation, are described. Moreover, the influence of nutrients such as copper, nitrogen and phosphorus, and the process operating conditions such as temperature, pH and moisture content of the biofilter bed, are also presented. Finally, the performance of various filter beds, in terms of their elimination capacities, is presented for laboratory scale biofilters and landfill covers.
Resume
La production du biogaz dans les sites d'enfouissement sanitaire, sa composition de meme que les problemes resultant de sa generation sont etudies dans le present article. La biofiltration est un procede prometteur, utilisable pour le controle des emissions atmospheriques du methane contenu dans le biogaz genere dans les petits et/ou vieux sites d'enfouissement sanitaire. Une revue detaillee de la biofiltration du methane est presentee. De plus, les micro-organismes intervenant dans la biodegradation du methane, principalement les methanotrophes, et leurs
besoins en oxygene et en dioxyde de carbone sont egalement decrits. Par ailleurs, 1'influence des nutriments tels le cuivre, 1'azote et le phosphore, ainsi que des parametres operatoires du procede tels la temperature, le pH et l'humidite du lit filtrant est egalement discutee. Enfin, la performance de divers lits filtrant, en termes de capacites d'elimination, pour des essais a l'echelle laboratoire et pour les sols de couverture des sites d'enfouissement sanitaire est presentee.
1.2. Introduction
Biogas results from the anaerobic degradation of organic wastes. Every year, thousands of tons of the greenhouse gas (GHG), methane (CH4), are produced in landfills, some of which escapes directly to the atmosphere. Even if GHG emissions associated with landfills represent only a small percentage (3.4 % for Canada) of the national total of GHG emissions from all sectors, it is important to note that landfills generally constitute the most important sources of anthropogenic CH4. For example, in Canada and the United States, around 25 % and 34 % respectively, of the total methane emissions are directly related to landfill installations (Environnement Canada, 2006; EPA, 2006). About 10000 landfills presently exist in Canada and the average waste production per inhabitant in yr. 2000 was 1020 kg, of which some 73.2 % was discarded to landfills. The wastes have generated in yr. 2001 GHG emissions, mainly in the form of CH4, at a level around 25.106 metric tons, when expressed as the carbon dioxide (CO2) equivalent (Environnement Canada, 2006). The recent ratification by Canada of the Kyoto protocol forces this country, along with several others, to find new alternatives for the control of CH4 emissions. Indeed, Canada has committed itself to reduce its GHG emissions by 6 %, compared to the 1990 level, during the period from 2008 to 2012, by targeting some particular gaseous compounds, such as CH4, for major attention (Kyoto protocol, 1998).
Methane, as a GHG, is some 21 to 25 times more detrimental to the environment than CO2 and its lifespan in the atmosphere is around 12 years (Hiitsch et al., 1994; Goossens, 1996; Hettiaratchi and Stein, 2001; Kumar et al., 2004). Various technologies such as combustion can be used to control the CH4 emissions issued from landfills but, for the older and/or smaller
landfills, traditional technologies are not very applicable and thus the biofiltration approach could be a promising solution. This process is one of the oldest of biotechnologies used in the treatment of polluted air. In the beginning, the process was employed only for the elimination of odors (Marsh, 1994). Thereafter, biofiltration, applied to contaminated air, proved to be also reliable for the elimination of volatile organic compounds (VOCs) and volatile inorganic compounds (VICs) (Jorio et al., 2003; Delhomenie and Heitz, 2005).
The idea of using biofiltration for CH4 elimination derives from the fact that some bacterial species are able to degrade CH4 while generating oxidation by-products such as water (H2O), CO2, salts and biomass, all products much less harmful for the environment than the initial substrate. On an annual basis, at least 10 to 25 % of the total CH4 emitted from landfills is oxidized by micro-organisms (Nozhevnikova et al., 1993; Mancinelli, 1995; Chanton and Liptay, 2000; Christophersen et al., 2000; EPA, 2005; Stralis-Pavese et al., 2006). Moreover, biofiltration creates environmental problems (such as CO2 production) to a lesser extent, in comparison with regular chemical oxidation processes. Also, biofiltration often offers the advantage of being performed at normal atmospheric pressure and temperature, thus resulting in lower ranges operational costs than traditional technologies (Ottengraf, 1986).
1.3. Sanitary landfills
A sanitary landfill is an installation arranged to receive wastes and to retain the products of their decomposition so that they cease to constitute a threat for human or animal health (Popov, 2005; Zamorano et al., 2007). Several types of landfills presently exist, some, known as closed-landfills, prevent the migration of liquid phase species from these sites towards the exterior environment. They are often used for the long term storage of dangerous wastes. However, the majority of landfills are only partially closed, thereby allowing the collection and treatment of the leachate, or kept open, leading to the gradual migration and dispersal of the leachate within the immediate ecosystem (Warmer Bulletin, 2000; Nikiema et al., 2004a; Zamorano et al., 2007). Sanitary landfills can receive and process, over the period of their active life, more than a million metric tons of wastes (Desideri et al., 2003; Zamorano et al., 2007; Spokas et al., 2006). For small cities and towns of less than 35000 inhabitants, a
municipal landfill of 20-30 m in depth is able to receive up to 200000 m3 of waste during its lifetime and is classified as a small landfill (Borjesson et al., 2001; Park et al., 2004). The choice of a suitable site must be the subject of quite detailed attention. Factors commonly taken into account are; the long term availability of the site, which will be devoted to this exclusive use over a period of at least thirty (30) years; its geological stability and characteristics. The site must also be of suitable size, and be located as far as possible from both residential and commercial areas, though remaining of easy access and servicing (Gielecki, 1997).
Wastes, after their arrival on the site, are dehumidified if necessary, and moderately compacted, generally using bulldozers, to reduce their density to values bordering on 0.7 to 0.9 m3 per metric ton before storage (Warmer Bulletin, 2000; Zamorano et al., 2007). At the end of each day's operations, the densified wastes are covered with an inert layer: e.g. compacted mineral material, such as clay soil, of about 0.15 m height, in order to control the harmful effects of waste's decomposition (such as odors) and losses, and to reduce the risk of fires. When an operational section of the site is completely filled, a final cover, composed of 0.6-1.0 m of clay and 0.2-0.6 m of soil, is applied to isolate it. The goal of this operation is thus to limit and even prevent the infiltration of H20 into the thus deposited wastes (Zamorano et al, 2007).
1.4. Biogas
1.4.1. Biogas composition
Once stored in landfills, wastes degrade biologically, thereby generating biogas (Popov, 2005). This biogas contains mainly CH4, a colorless and odorless GHG, explosive when its concentration lies in the range 5 % to 15 % V/V in air (Perry et al., 1997; Tagaris et al., 2003), and CO2, able to cause respiratory problems when its concentration is greater than 0.5 % V/V for a prolonged exposure (Toutant, 1994; Reginster, 1999; Nikiema et al., 2004a). The CH4 concentrations in biogas, as mentioned in the literature, generally vary from 30 % V/V to 70 % V/V while the CO2 concentration varies between 20-50 % V/V (Humer and Lechner,
1999b; Kallistova et al., 2005; Murphy and McCarthy, 2005; Tsai, 2006; Zamorano et al., 2007).
In the bio gas, some sulfur compounds are present in small proportions (typically less than 0.2 % V/V), such as hydrogen sulphide (H2S), mercaptans and thiols. These are responsible for the unpleasant odors that often emerge from poorly maintained landfills and can cause to humans and animals nausea, illness and in extreme cases death (Ma et al., 1996; Reginster, 1999; Warmer Bulletin, 2000). The biogas also generally contains some chlorinated compounds (less than 40 ppmv), among which are vinyl chloride, dichloromethane and tetrachloroethylene, all carcinogenic for humans and animals (Brosseau and Heitz, 1994; Reginster, 1999; Warmer Bulletin, 2000; Scheutz et al., 2000; Zamorano et al., 2007).
Biogas can also contain trace amounts of various VOCs (less than 70 ppmv), such as benzene, a carcinogenic compound, toluene and the xylenes. Hydrogen (H2), a by-product of the waste decomposition, can also be found in biogas at small concentrations, < 0.2 % V/V, along with nitrogen (< 5 % V/V) and sometimes oxygen (O2) (< 1 % V/V) (Reginster, 1999; Warmer Bulletin, 2000; ZWA, 2006). Moreover, biogas is generally water saturated (Warmer Bulletin, 2000; Spokas et al., 2006). Even when all of these compounds are found in biogas of various origins, their concentrations can be very variable and depend on the type of the stored waste and the age of the landfill. Table 1-1 presents typical concentrations for several compounds generally found in biogas.
1.4.2. Biogas production
One metric ton of municipal waste can generate between 135 and 375 m3 of biogas (Humer and Lechner, 1999b; Warmer Bulletin, 2000; Aye and Widjaya, 2006; Murphy and McCarthy, 2005; Zamorano et al., 2007). Many parameters influence the quantity and the rate of biogas production over time (Goossens, 1996; Ozkaya et al., 2007). First, the age of the site is a determining factor in the production of biogas, due to commencement of waste decomposition, which can begin approximately three months after the waste storage installation and is subsequently spread over some 20 to 50 years (Bajic and Zeiss, 2001; Zamorano et al., 2007). During the early years of a sanitary landfill's life (when it is being
established and filled), the rate of generated biogas released increases rapidly, from 0 to 11 m3.metric ton"1.year"1 (Reginster, 1999; Kumar et al., 2004) and thereafter, a slow and continuous decline in the gas emission follows. After some 30 to 50 years, rates of biogas production become very low and almost cease (Reginster, 1999).
TABLE 1-1: TYPICAL COMPOSITION RANGES FOR BIOGAS PRODUCED IN A LANDFILL
(Reginster 1999; Humer and Lechner 1999b; ZWA 2006; Tsai 2006) Important Compounds Methane Carbon dioxide Nitrogen Oxygen Ammonia Sulfur compounds Hydrogen Carbon monoxide Other trace compounds
Percentage (%) 30-70 20-50 1-5 0.1-1.0 0.1-1.0 0-0.2 0-0.2 0-0.2 0.01-0.6 These concentrations are expressed on a dry weight basis
The rate of biogas production also depends on the waste bed internal temperature and, to a lesser extent, on the external climatic conditions, such as the ambient temperature (Kumar et al., 2004). The optimal temperature for the production of biogas is 35-37°C (Kettunen and Rintala, 1997). The lowering of the temperature to 24°C in a controlled environment, such as within a digester, causes a reduction in the rate of biogas production of nearly 50 % (Crill, 1991; Nguyen et al., 2006). On the other hand, according to Chanton and Liptay (2000), variations in the production of biogas from an older landfill, as caused by seasonal temperature changes, are weak because the composting reactions of the organic wastes, located inside the deeper installed beds, ensures a near constant year round temperature of around 50°C (Straka et al., 1999; Hudgins and Green, 2000).
Another important parameter is the waste's moisture content that should ideally remain between 50 and 60% wt/wt. This factor can be controlled during the wastes' initial compaction, i.e. just before their placement in the long-term storage. The wetter the wastes, the greater their rate of degradation. However, a waste bed that is excessively wet (i.e. more than 65 % wt/wt moisture content) may cause settlement in the site material and produces substantial amounts of leachate needing to be handled. On the other hand, when wastes are not wet enough (less than 30 % wt/wt moisture content), they degrade more slowly because the microbial activity is inhibited. Therefore, it results in an increase of the lifespan of the wastes. However, the mechanical stability of the landfill is good, reducing the risk of safety hazards generation (Reinhart and Al-Yousfi, 1996; Warmer Bulletin, 2000; Hudgins and Green, 2000). The type of waste stored in the landfill can also influence both the composition and the quantities of the generated biogas produced. Organic wastes produce a biogas principally containing CH4 and CO2, in contrast to synthetic wastes that can be practically inert, like glass, or introduce into the biogas specific substances such as H2S, in the case of certain plastics degradation (Brosseau and Heitz, 1994). Finally, the physical characteristics of the landfill, e.g. the bed depth, and its chemical characteristics, such as the pH, also play important roles in determining the production rate of the biogas. For maximum biogas production, the bed must be of sufficient depth to ensure that its interior regions provide for an anaerobic environment in which the relevant micro-organisms can thrive, and the pH must also generally be close to neutral, i.e., between 6.8 and 7.2 (Yongzhi and Hu, 2002; Kettunen and Rintala, 1997).
1.4.3. Methane in the biogas
Methane, the atomically simplest and most stable hydrocarbon, is one of the important components in biogas. Its synthesis in organic waste beds is performed in three steps. Initially, polymers of the organic matter are hydrolyzed by the heterotrophic bacteria to form monomers. These molecules are then subject to fermentation which leads to the production of the organic and soluble products, composed mainly of acetates, formates and alcohols. By-products arising during this process step are CO2 and H2 (Le Mer and Roger, 2001). These
by-products are then converted to acetate in the presence of acetogenic bacteria, with simultaneous acidification, according to the following reaction:
2 C02 + 4 H2 -> CH3COO " + H+ + 2 H20 (Eq. 1-1) All of these steps are strictly anaerobic. Acetate and other organic acids are then decomposed to CH4 and CO2 by the methanogenic micro-organisms, all belonging to the domain Archaea (Hudgins and Green, 2000; Le Mer and Roger, 2001; Ozkaya et al., 2007). These micro-organisms are strictly anaerobic (i.e. the tolerated dissolved oxygen concentrations do not excede the low micromolar range) and they are widely found in various environments such as anaerobic digestors, anoxic sediments, flooded soils and landfills. The acidification and methane generation steps are synchronized and mutualistic associations of micro-organisms belonging to different genera are often observed at this late stage of methanogenesis, creating reciprocally favorable conditions, each moving the reaction equilibrium of the other in the most favorable direction (Whitman et al., 1999; Le Mer and Roger, 2001).
1.4.4. Biogas valorization
Some landfills have active biogas collection systems (made as gas wells) but even in these cases, the quantities of recovered gases are usually only between 40 % and 60 % of the actually produced gas quantities (Humer and Lechner, 1999a, b; Bajic and Zeiss, 2001; Christophersen and Kjeldsen, 2001; Popov, 2005; Zamorano et al., 2007; Spokas et al., 2006). Newer more efficient techniques, including the use of synthetic cover materials, now allow for up to 90 % gas collection effectiveness to be reached (Spokas et al, 2006). The biogas thus collected can subsequently be used in a variety of processes.
Combustion: This option is applicable only if the generated CH4 concentration in the biogas and the overall biogas quantities are important, i.e. more than 30 % (which occurs during the first 25 years of the landfill) and 50 m3.h"', respectively (Reginster, 1999; Bajic and Zeiss, 2001; Streese et al., 2001; Haubrichs and Widmann, 2006). The calorific value of biogas is typically around 20000 kJ.m"3, i.e. about half that of the calorific value of natural gas and thus, the hot gases generated from biogas combustion can be best used as an energy source for the
production of electricity and/or to generate hot water or steam (Goossens, 1996; Desideri et al., 2003; Tsai, 2006; Zamorano et al., 2007; Spokas et al., 2006). This valorization process allows at least, the partial meeting of the energy demand for the wastes processing site and for other clients located in its neighborhood. The investment cost required to install and operate such technology, considering a global collection and energy recovery efficiency of 50 %, in a landfill, already equipped with biogas collection systems, is 3.1 $ US/ton CO2 equivalent of CH4 eliminated (Ayalon et al., 2001). Estimates made by the Environmental Protection Agency (EPA) in 1996 indicated that the recovered energy from biogas, issued from the landfills across the whole USA, could be used to meet the needs of some 2.3 million homes (Goossens, 1996). However, this solution is not universally economic at present because of the low cost of natural gas. Moreover, the addition of biogas to the natural gas network may deteriorate the quality and lifetime of the latter (Brosseau and Heitz, 1994; Ewall, 1999). Other alternatives: A catalytic flow reversal reactor technology concept was developed by Natural Resources Canada (USDE, 2005). The main goal of this process is the elimination of CH4 when its concentration in air lies between the values of 0.1 to 1 % V/V. The methane is oxidized in a packed bed reactor, the exit product gases having a temperature ranging from 600 to 800°C. Heat can then be recovered from it, either to produce electricity or to satisfy various local heating needs. Another alternative for the CH4 content in biogas valorization consists of transforming this compound into methanol. This latter product can then be sold to chemical processors (Ewall, 1999; Popov, 2005).
1.4.5. Biogas elimination
Flaring: Sometimes, collected biogas is simply burned in flares. This CH4 elimination method is done with minimal facilities and without energy recuperation, the objective being to avoid the risk of explosion caused by the presence of CH4 in the air. However, this disposal method can be environmentally harmful, when dangerous compounds, such as dioxins, are generated during the combustion and are released to the atmosphere (Gielecki, 1997; Jaffrin et al., 2003). Flaring of landfill biogas requires about 1.2 $ US/ton eq CO2 of CH4 eliminated (Ayalon et al., 2001). This treatment process can be used only when the amounts of biogas to
be treated exceed 10-15 m3.rf', while the biogas CH4 concentration remains greater than 20 % V/V (Haubrichs and Widmann, 2006).
Biological oxidation: Many landfill installations are, even today, still deprived of collection systems for the biogas produced. And even where such systems are in place, it is still difficult, and usually uneconomic, to utilize traditional valorization techniques for the older or smaller landfills (Bajic and Zeiss, 2001). In these cases, other processes may need to be used to eliminate the dangers created by the CH4 presence in the atmosphere-released biogas. A possible solution is the use of biofiltration, a biological oxidation process. This idea comes from the fact that some bacteria are able to degrade air pollution compounds, such as CH4. This process already provides for the elimination of some 10 to 100 % of the CH4 escaping from the upper layers of landfills, depending on local climatic conditions (Nozhevnikova et al, 1993; Kightley et al., 1995; Czepiel et al., 1996; Chanton et al., 1999; Christophersen et al., 2000; Bajic and Zeiss, 2001; EPA, 2005; Stralis-Pavese et al, 2006).
1.5. Methane Biofiltration
1.5.1. Configuration
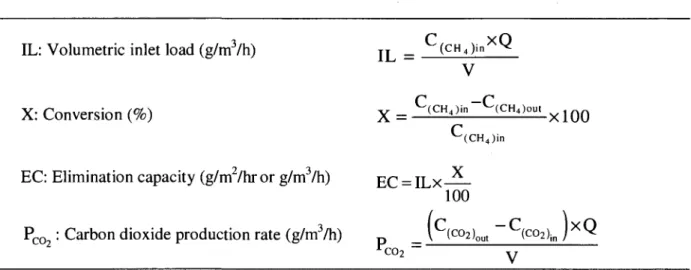
A biofilter is a three-phase bioreactor: the filter bed constitutes the solid phase, the biofilm, the liquid phase and the gaseous pollutants, the gas phase. Contact between the micro-organisms and the polluting CH4 takes place in the biofilm, immobilized on the filter bed. The majority of biofilters, as used in lab-scale experiments, are closed systems. The air supply is ensured by a forced ventilation system. Gases circulation in the biofilter can be effected from either top to bottom or conversely. Closed biofilters are compact systems that can be assembled from several stages. Different performance parameters like inlet load (IL), elimination capacity (EC) and conversion (X) used in biofiltration are defined in Table 1-2. Maintaining the operational parameters unchanged in a closed biofilter is also a relatively easy practice, resulting in good performance, with CH4 X values as high as 90 % (Dammann et al., 1999; Streese et al., 2001; Gebert et al., 2001; du Plessis et al., 2003; Nikiema et al., 2005). The biofilter can also be an open system generally organised within the landfill covers.
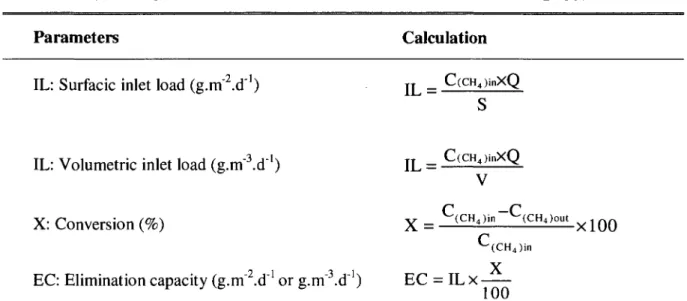
TABLE 1-2: PERFORMANCE PARAMETERS USED IN BIOFILTRATION
Parameters Calculation IL: Surfacic inlet load (g.mld1) I L _ C(CH4)inXQ
S
IL: Volumetric inlet load (g.mld1) IL = C(CH<)inX °-V
X: Conversion (%) X = C(CH4)in~C(CH4)out x 100
C
^ ( C H4) i n
EC: Elimination capacity (g.m^.d1 or g.irf'.d"1) EC = IL x
WhereC(CH y. Methane concentration in g.m"3; Q: Volumetric flow rate of gases in m3.d"'; S: Biofilter bed cross-section in m2 and V: Biofilter bed volume in m3.
Usually, in this case, the flow of the polluted gas in the bed proceeds upwards, while the O2 diffuses from the ambient air into the bed (passive ventilation). The main disadvantage of this process lies in the difficulty of controlling the operational parameters, such as the temperature and moisture levels. Moreover, transfer of 02 to the bed's lowest layers is a very important limiting factor for the overall performance (Kjeldsen et al., 1997; Gebert et al., 2001). For example, removal efficiencies of up to 60 % can be obtained, when the empty bed residence times (EBRT) is at least an hour, with an open biofilter, installed on a landfill site (du Plessis et al, 2003; Gebert and Groengroeft, 2006a, b).
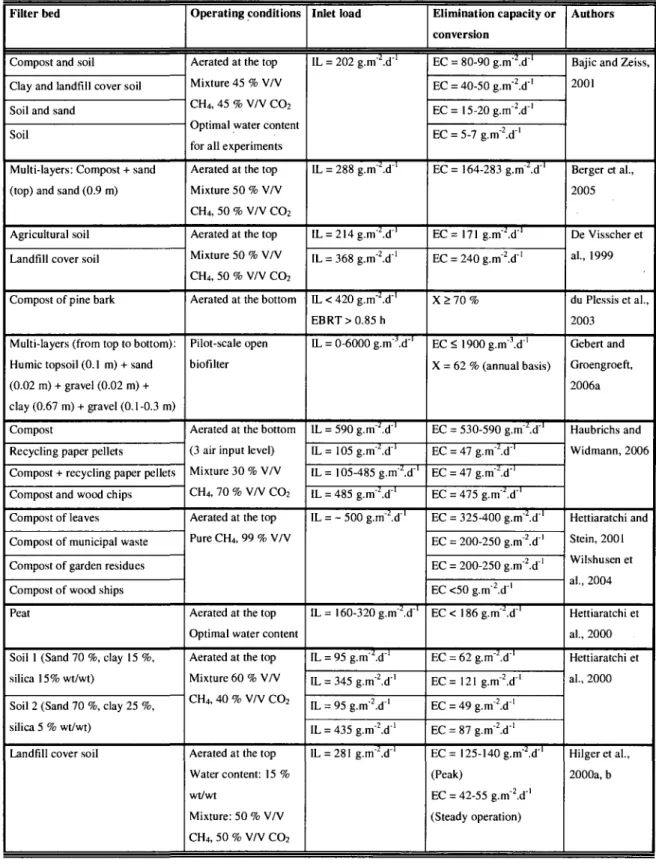
Laboratory-scale experiments, using a forced ventilation at the top of the biofilter in order to simulate the natural behavior of landfill covers, have been reported by several authors (Hilger et al., 2000a, b; Hettiaratchi and Stein, 2001; Stein and Hettiaratchi, 2001). The best EC obtained with this operational mode was achieved in the range of 325 and 400 g.m"2.d_1 (Hettiaratchi and Stein, 2001). The IL of CH4 is another important parameter. Various ILs have been tested at the laboratory scale and are reported in the literature, as presented in Table
TABLE 1-3: EXPERIMENTS ON THE TOPIC OF METHANE BIOFILTRATION
Filter bed
Compost and soil Clay and landfill cover soil Soil and sand
Soil
Multi-layers: Compost + sand (top) and sand (0.9 m)
Agricultural soil Landfill cover soil
Compost of pine bark
Multi-layers (from top to bottom): Humic topsoil (0.1 m) + sand (0.02 m) + gravel (0.02 m) + clay (0.67 m) + gravel (0.1-0.3 m) Compost
Recycling paper pellets
Compost + recycling paper pellets Compost and wood chips Compost of leaves Compost of municipal waste Compost of garden residues Compost of wood ships Peat
Soil 1 (Sand 70 %, clay 15%, silica 15% wt/wt)
Soil 2 (Sand 70 %, clay 25 %, silica 5 % wt/wt)
Landfill cover soil
Operating conditions
Aerated at the top Mixture 45 % V/V CH4, 45 % V/V C 02 Optimal water content for all experiments Aerated at the top Mixture 50 % V/V CH4, 50 % V/V CO2 Aerated at the top Mixture 50 % V/V CH4, 50 % V/V CO2 Aerated at the bottom
Pilot-scale open biofilter
Aerated at the bottom (3 air input level) Mixture 30 % V/V CH4, 70 % V/V CO2 Aerated at the top Pure CH4, 99 % V/V
Aerated at the top Optimal water content Aerated at the top Mixture 60 % V/V CH4, 40 % V/V CO2
Aerated at the top Water content: 15 % wt/wt Mixture: 50 % V/V CH4, 50 % V/V CO2 Inlet load IL = 202 g.m'2.d'' IL = 288 g.m"2.d"' IL = 214g.m"2.d"' IL = 368 g.m'ld'1 IL < 420 g.m'2.d'' EBRT>0.85h IL = 0-6000 g.m"J.d"' IL = 590 g.m'.d'1 IL=105g.m-2.d"' IL= 105-485 g.m'.d"1 IL = 485 g.m'.d"1 IL = - 500 g.m'.d"1 IL= 160-320 g.m"2.d"' IL = 95 g.m"\d"' IL = 345 g.m'2.d'' IL = 95 g.mld"1 IL = 435g.m"2.d"' IL = 281 g.m"2.d~' Elimination capacity or conversion EC = 80-90 g.m"2.d"' EC = 40-50 g.m"2.d"' EC= 15-20 g.m"2.d"' EC = 5-7 g.m"2.d"' EC = 164-283 g.m"2.d"' EC= 171g.m'2.d-' EC = 240 g.m"2.d"' X > 70 % EC<1900g.m"3.d"' X = 62 % (annual basis) EC = 530-590 g.m"2.d'' EC = 47 g.m"2.d~' EC = 47 g.m"2.d"' EC = 475 g.m'2.d'' EC = 325-400 g.m"'2.d'' EC = 200-250 g.m"2.d"' EC = 200-250 g.mld"1 EC <50 g.m'2.d"' EC< 186g.m~2.d'' EC = 62 g.m2.d"' EC = 121 g.m"2.d"' EC = 49 g . m l d1 EC = 87 g.mld"1 EC= 125-140 g.m'2.d'' (Peak) EC = 42-55 g.m"2.d"' (Steady operation) Authors
Bajic and Zeiss, 2001 Berger et al., 2005 De Visscher et al., 1999 du Plessis et al., 2003 Gebert and Groengroeft, 2006a Haubrichs and Widmann, 2006 Hettiaratchi and Stein, 2001 Wilshusen et al., 2004 Hettiaratchi et al., 2000 Hettiaratchi et al., 2000 Hilger et al., 2000a, b
Filter bed
Fresh compost
Mature compost Soil
Compost of municipal waste Compost of clarification sludge Soil
Landfill cover soil Garden soil Mature compost Inorganic material Compost Soil Glass tubes Peat
Landfill cover soil Agricultural soil
Compost + landfill cover material
Compost
Compost + peat + wood fibers Multi-layers
Compost
Compost + peat + wood fibers Soill
Soil 2
Operating conditions
Aerated at the top Temperature: 18°C
Aerated at the top Temperature: 18-20°C
In situ
Aerated at the bottom 7000-7500 ppmv CH4 Aerated at the top Pure CH4> Optimal conditions
Aerated at the bottom Percolation
0.25- 1.0%VWCH4 Aerated at the top Pure CH4 99 % V/V Water content: 10% wt/wt
In situ open biofilter
Bench-scale open biofilter
Large-scale open biofilter
Aerated at the top Mixture 60 % V/V CH4, 40 % V/V C02 Inlet load IL= 135-170 g.m"2.d"' Q = 4-5 mL.min"1 IL = - 235 g.m'2.d'' Q = 4 -7 mL.min'1 2400 L biogas.m^.d"1 IL = ~ 1700g.m"2.d~' IL = 525g.m"\d"' IL = 200g .m'.d"1 IL = 750 g ,m"2.d"' IL = 320 g.rn'.d-' IL = 320 g.m"2.d"' IL = 310g.m"2.d"' IL= 18500-42800 g.m-3.d-' IL = 288-3120 g.m-'.d"1 IL = 288-3120 g.m-'.d'1 (not available) Elimination capacity or conversion X = 60 % from day 25 to day 50 X = 100% after 55 days X = 100% after 15 days X = 30-40% from day 10 to day 50 EC = ~188g.m"\d-' EC =-175-190 g.m'2.d"' EC = -82 g.m"2.d_1 EC = -95 g.m'2.d"' EC = ~175g.m'2.d'' X = 100% EC = - 700 g.m"\d"' EC = - 300 g.m"2.d"' EC = 435 g.m2.d'' EC = 96 - 98 % EC = 27 - 28 % EC = 96-160 g.m'2.d'' EC = 64-130 g.m"2.d"' EC = 93-155 g.m"2.d"' X > 90 % EC= 1500 g.m-'.d-1 a EC = 960 g.m-'.d'1 EC = 720 g.m-'.d"1 EC = 960 g.m-'.d-1 a EC = 480 g.m-'.d"1 EC = 40-100 g.m"2.d"' EC = 75-100 g.m-ld"1 Authors Humer and Lechner, 1999b Humer and Lechner, 2001 Hupeet al., 1998 Nikiema et al., 2004b Park et al., 2002 Slyetal., 1993 Stein and Hettiaratchi, 2001 Straka et al., 1999 Streese and Stegmann, 2003 Visvanathan et al., 1999
a: This EC was the maximal value obtained. After 5 months of operation, the CH4 oxidation rate in the biofilter
was obtained, as against 100 % when the IL was only of 186 g.m^.d"1 (Hettiaratchi et al., 2000). An experiment reported by Humer and Lechner (1999b) on a sandy soil bed, showed the same tendency. However, according to Humer and Lechner (1999b), a flow rate of too low value could lead to poor performance if the filter bed porosity is not high enough.
In the case of methane biooxidation, EBRTs are typically between a few minutes to several hours, due to methane's low-biodegradability (Dammann et al., 1999; Hettiaratchi and Stein, 2001; du Plessis et al., 2003; Nikiema et al., 2004b; Nikiema et al., 2005). In contrast, for VOCs and VICs bio filtration, EBRTs are in general, between 30 and 120 seconds (Jorio and Heitz, 1999). The required operating volumes can reach as much as 100 times those used for treating the same amount of odors (Streese and Stegmann, 2003). Indeed, the size of the bio filter should be at a scale of at least 1 m3 of filter bed for achieving flow rates of CH4 in the range of 0.01 m3.h_1 to 2.5 m3.h~' (Straka et al., 1999; Stresse and Stegmann, 2003; Haubrichs and Widmann, 2006). The height of the open biofilters with passive ventilation, used for CH4 elimination, must also be lower than 1 m (Kjeldsen et al., 1997; Boeckx and Van Cleemput, 2000; Stein and Hettiaratchi, 2001; Stein et al., 2001; Park et al., 2002; Tagaris et al., 2003). Open systems are usually less expensive, at least 15 %, than closed systems. In 2001, for the non-easily degradable, volatile organic pollutants, the costs for the installation of open biofilters were between 0.25 and 0.4 $ for each m3.d_1 of polluted gas to be treated (we assume this cost will probably be similar to that for CFL). In addition, the industry consensus on capital and operating costs must be considered, and recently, these costs were 0.5-1.8 $ and 0.07-0.1 $ per m3.d-1 of polluted gas, respectively (Janni et al., 2001).
1.5.2. Micro-organisms
O Methanotrophs
The specific bacteria responsible for the decomposition of CH4 are known as methanotrophs and constitute a sub-group of the methylotrophs, i.e. bacteria specialized in the degradation of those compounds having only one carbon atom. Earlier, methanotrophs were identified only according to their morphology, their intracytoplasmic membranes structure and some of their
physiological characteristics. Since then, DNA analysis has aided the identification of the genera of methanotrophs (Hanson and Hanson, 1996; Lidstrom, 2001).
There are three basic steps in the decomposition of CH4. The first reaction step consists of the oxidation of CH4 to methanol, utilizing the enzyme MMO (Hanson and Hanson, 1996; Auman et al., 2002). The methanol thus obtained is transformed into formaldehyde. The latter compound can be subsequently used in a dissimilatory pathway (i.e., being oxidized to CO2, with formate as an intermediate) or via several types of assimilatory pathways, leading to the synthesis of cell components, necessary for the growth of methanotrophs (Hanson and Hanson, 1996).
The genera of methanotrophs are grouped into three main types. The genera Methylomonas,
Methylomicrobium, Methylobacter, Methylocaldum, Methylophaga, Methylosarcina, Methylothermus, Methylohalobius and Methylosphaera belong to type I. They assimilate
formaldehyde by the ribulose monophosphate pathway and their cellular membranes are mainly made up of fatty acids with 16, or sometimes 14 atoms of carbon (Hanson and Hanson,
1996; Tsubota et al., 2005, Kalyuzhnaya et al., 2005; Heyer et al., 2005; Stralis-Pavese et al., 2006). Methylocystis, Methylocella, Methylocapsa and Methylosinus constitute the type II and they use the serine pathway for their formaldehyde assimilation. Their cellular membranes contain fatty acids of 18 carbons, arranged around the cell periphery (Hanson and Hanson, 1996; Borjesson et al., 1998; Dedysh et al., 2000; Dedysh et al., 2002; Nikiema et al., 2005).
Methylococcus, known as type X, combines the properties of types I and II i.e. fatty acids with
16 carbons and the assimilation of formaldehyde through both the ribulose monophosphate cycle and the serine pathway. The recently completed genomic sequence of Methylococcus
capsulatus confirmed the presence of genes directing both pathways (Hanson and Hanson,
1996; Wise et al., 1999; Kelly et al., 2005). Aerobic methanotrophic bacteria are essentially unable to grow on substrates containing C-C bonds as the only carbon source and thus can be considered as obligate Ci metabolizers. The genus Methylocella seems however to be an exception to this rule, being able to use compounds such as acetate, pyruvate, succinate, malate, and ethanol (Dedysh et al., 2005; Horz et al., 2005).
Methylococcus (type X), Methylothermus and Methylocaldum (type I) are moderately
thermophilic and their optimal growth temperatures vary from 42°C, for the majority, to 62°C.
Methylomonas, Methylobacter and Methylosphaera, all of type I, are psychrophilic,
developing over a range of temperatures, from 5 to 15°C (Trotsenko and Khmelenina, 2002).
Methylobacter, type I bacteria, have an optimum growth temperature of around 6°C, while Methylosphaera develop better, between 10 and 13°C, in sea water (Berestovskaya et al.,
2002). Mention is made that several methanotrophic communities have the capability of adapting to various temperatures, as long as these lie between 0 and 55°C. However, at temperatures lower than 0°C, the multiplication of the bacteria stops (Humer and Lechner, 1999b). Methylocystis and Methylosinus, bacteria composing type II, are acidophilic. They exhibit a maximum growth rate in acidic media, in the pH range from 5 to 5.5.
Methylomicrobium (type I bacteria) are distributed between the group of halophilic, being at
ease in saline media having sodium chloride concentrations ranging from 0.5 to 5.6 % wt/wt, and that of the alcaliphilic, for which the optimal pH ranges between 7.5 and 10 (Trotsenko and Khmelenina, 2002).
* Methane monooxygenase enzyme
A specific enzyme known as methane monooxygenase or MMO characterizes the methanotrophs. The MMO is the key enzyme allowing methanotrophs to perform the decomposition of CH4 (Hanson and Hanson, 1996). This enzyme exists in two forms: particulate MMO (pMMO) and soluble MMO (sMMO). The pMMO enzyme can be both found in and synthesized by all methanotrophs, except Methylocella, but the sMMO is almost always present in bacteria of type II and X. However, some Methylomonas strains (type I), possessing the sMMO enzyme, have already been found (Auman et al., 2002).
It is known that methanotrophs containing pMMO (mainly type I) grow more rapidly and are more specific to Cfkthan those having the sMMO (type II and X) (Henckel et al., 2000; Reay and Nedwell, 2004). These differences are noticed when the CH4 concentration is lower than 1000 ppmv of CH4 (Segers, 1998). Thus, type I bacteria with pMMO develop quickly when the experimental conditions permit and become dominant in environments when such rapid growth is allowed (Henckel et al., 2000). However, they are sensitive to variations in nutrients
availability, mainly the nitrogen and copper, and in the CH4 concentrations. On the other hand, populations of type II and X bacteria, having the sMMO, are quasi-steady and very stable in various environments, such as the landfill covers (Henckel et al., 2000; Grossman et al., 2004). In addition, sMMO also has affinities for a variety of compounds, such as methanol, several chlorinated compounds and hydrocarbons, among which are the alkanes, olefinic hydrocarbons and aromatic compounds (Hanson and Hanson, 1996; Dunfield et al., 1999; Vorholt, 2002; Hilger and Humer, 2003; Erwin et al., 2005; Hesselsoe et al., 2005; Lindner et al., 2005).
* Oxygen and carbon dioxide needs of methanotrophs
All of the methanotrophs species can be found in small quantities in any environments exposed simultaneously to significant amounts of CH4 and O2 (Borjesson et al., 1998; Dammann et al., 1999). For example, Methylomonas and Methylobacter (type I),
Methylocystis and Methylosinus (type II) as well as Methylococcus (type X) have already been
isolated from the cover soils of several landfills (Borjesson et al., 1998). However, the distribution of methanotrophs within a filtering material is not a random process since each type of bacteria develops preferentially in that portion offering the most advantageous conditions for its growth (Henckel et al., 2000; Gebert et al., 2003). An O2 concentration of 21 % V/V, associated with a CH4 concentration less than 1000 ppmv better supports the growth of type I bacteria. On the other hand, when the CH4 concentration is superior to 1 % V/V and the concentration of O2 is low (about 1 % V/V), type II bacteria develop better (Hanson and Hanson, 1996; Henckel et al., 2000; Crossman et al., 2004). However, there are exceptions to this scheme and some type I bacteria have their growth stimulated only in the presence of an appreciable concentration of CH4 (> 1% V/V), and correspondingly, a low amount of O2 (< 1% V/V) (Henckel et al., 2000; Erwin et al., 2005). Bender and Conrad (1994), Czepiel et al. (1996) and Stein and Hettiaratchi (2001) have shown that, by increasing the O2 concentration from 3 to 20 % V/V in the gas mixture, the CH4 conversion varies only slightly (less than 10 %). However, a decrease of O2 concentrations from 3 to 1 % causes the fall off of CH4 oxidation of more than 50 %. However, during the experiments of Stein and Hettiaratchi
(2001), the maximal CH4 elimination was obtained at O2 concentration between 0.75 and 1.6%.
The presence of CO2 in a bio filter at the same time as the CH4 can modify the behavior of the micro-organisms present. According to Acha et al. (2002), the activity of the methanotrophs, using the serine pathway for the assimilation of formaldehyde obtained during the decomposition process of CH4, requires some CO2 input (partial pressure of CO2 around 11.6 kPa) (Acha et al., 2002).
O Non-methanotrophic bacteria
Nitrifying bacteria, responsible for the decomposition of ammonia (NH3), can also degrade CH4, but their performance rate is less than 5 % that of the pure methanotrophic populations (Hanson and Hanson, 1996; Bodelier and Frenzel, 1999). Also, some bacteria involved in the decomposition of methanol are also capable of degrading CH4, but only if the CH4 concentrations remain below 10 % V/V. The optimal growth temperature for these bacteria is around 35°C (Hughes et al., 2002). There are also certain anaerobic bacteria that are able to degrade CH4. Such bacteria are active when immersed in aqueous media. These bacteria work in tandem with those involved in reducing sulphates, the reaction requiring additional sources of carbon such as acetate or lactate (Hanson and Hanson, 1996; Kotelnikova, 2002; Valentine, 2002). The minimal sulphate concentration in the system must be approximately 1 mmol.L"1 (Segers, 1998). The hypothesis of coupling between sulphate reduction and anaerobic methane oxidation is also supported by studies on a landfill-leachate plume (Grossman et al., 2002) and in ground water (Van Stempvoort et al., 2005). However, experiments to isolate these anaerobic bacteria remain unsuccessful to date (Conrad, 1996; Segers, 1998; Kotelnikova, 2002). Recently, a microbial consortium has been isolated, found to be performing methane oxidation, coupled to nitrate reduction, in the absence of oxygen. The consortium includes two micro-organisms: a bacterium and an archaeon, belonging to as yet an unknown species (Raghoebarsing et al., 2006).
1.5.3. Inoculation and incubation
When contact is created between methanotrophs and CH4 in a biofilter, an induction step, during which X is weak (0-10 % of the steady state conversion), always precedes the optimal system functioning. This lag phase is due to the activation and growth of the methanotrophic bacteria (Bender and Conrad, 1995; Henckel et al., 2000) and its duration is determined by the operating conditions (CH4 concentration, temperature and moisture of the filter bed). During the experiments carried out by Henckel et al. (2000) in microcosms maintained under a CH4 continuous flow environment, some 6 and 19 days were required to reach steady X, respectively for high (10000 ppmv) and low (1000 ppmv) CH4 concentrations. In order to aid the establishment of the specific and competitive methanotrophic population in the filter bed, inoculation of the bed by selected methanotrophic bacteria is usually performed, even if the success of this practice is not guaranteed.
At the laboratory scale, another common practice involves incubation, consisting of a prolonged exposure (several days or weeks) of the filter bed to significant CH4 concentrations, ranging between 1000 ppmv and 200000 ppmv. The higher the CH4 concentration, the more the growth of the methanotrophs is promoted. The consequence then is a rapid increase in the oxidation rate (Bender and Conrad, 1995; Hanson and Hanson, 1996; Henckel et al., 2000; Le Mer and Roger, 2001; Crossman et al., 2004; Mor et al., 2006). For example, the oxidation rate for a CH4 at initial concentration of 100000 ppmv is around 0.8 g CtU.kg soil'.d"1 which is 10 times higher than the value observed for a CH4 initial concentration of 10000 ppmv (Bender and Conrad, 1995). Since all bacteria do not develop within the same range of CH4 concentrations, the choice of the incubation parameters must be made judiciously. At the end of the induction phase, a peak value in the conversion up to 3 times that obtained for a steady operation (e.g. X = 64 %) can be noted (Hettiaratchi and Stein, 2001; Abichou et al., 2006a).
1.5.4. Parameters
0 Filter bed
The filter bed is the solid phase on which the biofilm containing the micro-organisms is to be formed. It must present sufficient space for the development of micro-organisms and it should also have a texture providing a great moisture-holding capacity, in addition to appropriate bacteriological and mechanical properties. It must also be inexpensive (Humer and Lechner, 1999a, b; Bajic and Zeiss, 2001; Nikiema et al., 2004b). Various experiments, conducted at the laboratory scale, have been performed to test various filter bed structures, using natural materials such as soils and composts or synthetic materials. The results obtained are presented in Table 1-3 and will be expressed in terms of the IL, EC and X. Composts of various origins (solid wastes, vegetable wastes, clarification sludges...) were tested during the CH4 biofiltration. Compost, made from mature yard wastes yielded the best results with EC up to 590 g.m^.d"1 and at values for X of between 90 and 100 %, during more than 100 days of continuous filter operation (Haubrichs and Widmann, 2006). Compost, made from dead leaves, also yielded good results (Hettiaratchi and Stein, 2001; Wilshusen et al., 2004). In addition, the time required to reach 100 %, conversion is less for the mature compost than that for freshly generated compost, being some 15 days and 55 days respectively. This result makes the mature compost a preferred framework for the biofiltration of CH4 (Humer and Lechner, 1999b).
The soils most often employed are those of landfills covers (Hettiaratchi et al., 2000; Hilger et al., 2000a), but agricultural soils, soils derived from mountains, forests and rice plantations, peat bogs and swamps, have also been tested in CH4 biofiltration (Dobbie and Smith, 1996; Hiitsch, 1998b; Del Grosso et al., 2000; Hettiaratchi et al., 2000; Cai and Mosier, 2000; Nozhevnikova et al., 2001; Stein and Hettiaratchi, 2001; Novikov and Stepanov, 2002; Kravchenko, 2002). All of these soils contain different proportions of sand, clay, silica and organic matter. The most effective soils for CH4 elimination are those taken directly from the upper layers of landfill covers. An EC of 435 g.m"2.d_1, corresponding to an X value of greater than 80 %, has been reported in the literature (Park et al., 2002). The addition to a soil of organic residues, such as vegetable residues (beet leaves, wheat straw), clarification sludge or