Long-term variation of Dust episodes over the United Arab Emirates
1Ghouse Basha1*, M.Venkat Ratnam1, K. Niranjan Kumar2, T.B.M.J. Ouarda3 2
and P. Kishore4 3
4
1National Atmospheric Research Laboratory, Gadanki, Tirupathi, India. 5
2Atmosphere and Ocean Research Institute (AORI), The University of Tokyo, Chiba, Japan 6
3Canada Research Chair in Statistical Hydro-Climatology, INRS-ETE, National Institute of 7
Scientific Research, Quebec City (QC), G1K9A9, Canada 8
4
Department of Earth System Science, University of California, Irvine, California, 92697, USA 9 10 11 12 13 Corresponding Author 14 Ghouse Basha 15
National Atmospheric Research Laboratory 16
Department of Space, Tirupathi-517502. 17 Email: [email protected] 18 19 20 21
22
Abstract: 23
This paper deals with the investigation of long-term variability of atmospheric dust over 24
the United Arab Emirates (UAE). The climatology of dust episodes (dust events, dust storms, and 25
severe dust storms) is compiled based on the hourly observations and synoptic codes recorded at 26
four different stations over UAE between the years 1983-2014. The diurnal, temporal, monthly, 27
and inter-annual variations of dust episodes and their relation with the mean wind speed, maximum 28
wind speed, and temperature are discussed. Dust episodes show a clear diurnal variation in all the 29
stations. The duration of dust storms is large compared to dust events. For instance, dust events 30
over the UAE persist for 2-5 hours while dust storms last for about 5-11 hours. Dust storms also 31
show clear seasonal variability with the maximum occurring during winter and the minimum 32
during summer whereas most of the dust events occur during the months of March and April. The 33
inter-annual variation of dust events shows a significant decrease while dust storms depict a 34
moderate increase over the UAE. The synoptic scale climatology of all dust storms is also analysed 35
and shows changes in wind direction to the south-west prior to 2 days of the dust storm generation. 36
The climatology of wind direction and wind speed during the dust episode indicates that 90% of 37
dust episodes are coming from the southwest direction. These observed results are discussed in 38
light of the current global warming scenarios with a special emphasis on the role of dust episodes 39
on the regional enhancement of temperature. 40
41
Keywords: Dust episode, Dust storm, UAE, Wind Speed and Temperature 42
1.Introduction 44
Dust storms (DSs) are one of the natural hazards that severely affect daily life for short time 45
intervals (Maghrabi et al., 2011). DSs are the consequence of the air turbulence, which spreads a 46
large mass of dust in the atmosphere and reduces the horizontal visibility to few hundreds of meters 47
which leads to the occurrence of traffic accidents and other disturbances (Goudie and Middleton, 48
2006). Desert dust also has a significant impact on aviation as it affects aircraft engines and 49
visibility (Lekas et al., 2011; WMO, 2011). Such incidents lead to rerouting aircraft, flight delays 50
and massive cancellation of scheduled flights as well as mechanical problems such as erosion and 51
corrosion of aircraft engines (WMO, 2011). The dust particles that are suspended in the air have 52
several impacts on climate, hydrological cycle and human health (IPCC, 2013). Dust aerosols alter 53
the radiative budget through absorption and scattering of long-wave and shortwave radiation. In 54
addition, dust particles cause a serious risk to the environment and human health, particularly with 55
patients suffering from lung diseases (Gobbi et al., 2007; Zhang et al., 2012). 56
The Middle East is one of the most active hotspots for the occurrence of DSs in the world. The 57
Rub' al Khali is the largest uninterrupted sand desert in the world with dunes that reach a height of 58
250 m. The Rub' al Khali is also known to be one of the most arid and hottest locations in the 59
Arabian Peninsula. Its vast area of sand and dust provides a sizeable source region to areas 60
surrounding the Arabian Peninsula. Further, the desert acts as a fuel for the northwest originating 61
DSs before they drift into the Arabian Sea and eventually dissipate. The major parts of Saudi 62
Arabia, and the southern part of the United Arab Emirates (UAE) are situated in Rub' al Khali 63
desert. The dust particles that originate in these arid regions can be transported over long distances 64
by strong winds and convective processes (Sun et al., 2001). 65
The synoptic and mesoscale weather systems which are responsible for the generation of DSs 66
atmospheric circulation are related to DS frequency (Zhang et al., 1997; Yang et al., 2008). These 68
large-scale systems (atmospheric circulations) alter the local climatic parameters such as 69
temperature, precipitation, winds, and others (Niranjan Kumar and Ouarda, 2014; Naizghi and 70
Ouarda, 2017; Niranjan Kumar et al., 2016; Kumar et al., 2017). Climatic variables (temperature, 71
precipitation, and wind) significantly influence the occurrence of DSs (Gao et al., 2003; Natsagdorj 72
et al., 2003; Ouarda et al., 2014). For example, higher temperature with strong winds help in the 73
formation of DSs in regions like Rub' al Khali (Notaro et al., 2013). The detailed long-term 74
variability of dust episodes can explain the past climatological and environmental changes and will 75
help understand the controlling or responsible factors for the occurrence of DSs. Several case 76
studies have focused on DSs and their impacts on aerosol optical and radiative properties (Miller 77
et al., 2008; Hansell et al., 2008; Basha et al. 2015). Several studies have also been carried out on 78
the long-term variation of dust episodes around the major parts of the desert areas in the world 79
(Qian et al. 2002; Natsagdorj et al., 2003; Ekström et al., 2004; Hara et al., 2006; Sabbah et al., 80
2012; Steenburgh et al. 2012; Guan et al. 2014; Wang et al., 2017; An et al., 2018). For instance, 81
de Villiers and van Heerden (2007) studied the variability of dust episodes over the Abu Dhabi 82
region by considering data from 1994-2003. Unfortunately, no study exists over the whole UAE 83
on the long-term variability of dust episodes. Hence, the present study focuses on the long-term 84
variation of dust episodes at four stations in the UAE between the years 1983-2014. In addition, 85
we have also attempted to investigate the responsible or controlling factors for the occurrence of 86
DSs. 87
The present paper is organized as follows: Section 2 contains the description of the datasets 88
used and the methodology adopted for the identification of dust episodes. The diurnal, temporal, 89
monthly, and inter-annual variations of dust episodes and their relation with average wind speed, 90
maximum wind speed, and temperature are presented in Section 3. The important conclusions 91
drawn from the current study are summarized in section 4. 92
2. Data and Methods 93
2.1. Data sets 94
The data used in this study are obtained from the National Climate Data Center 95
(https://www.ncdc.noaa.gov/cdo-web/datasets) at four different stations of UAE operational since 96
1983. The stations are Abu Dhabi (54.69°E, 24.29°N), Dubai (55.27°E,25.20°N), Sharjah 97
(55.51°E, 25.32°N), and Ras Al-Khaimah (55.97°E, 25.80°N). The data includes conventional 98
meteorological variables such as wind speed, wind direction, temperature, and visibility 99
accompanied by visual observations of current weather on the hourly basis at UTC. The whole 100
paper deals with UTC time only. Monthly data of temperature, maximum wind speed, and average 101
wind speed are derived from hourly observations from all the stations for the period 1983-2014. 102
2.2. Methodology 103
A DS or sandstorm is a collection of dust or sand particles of dust or sand that are 104
significantly lifted from the surface to higher altitude by strong turbulent wind and thus visibility 105
reduces to few hundreds of meters (WMO 2009). The horizontal visibility is the maximum distance 106
at which an observer can see and identify an object lying close to the horizontal plane on which he 107
or she is standing (American Meteorological Society, Glossary). According to the WMO, the dust 108
episodes are classified as Severe Dust Storm (SDS) (horizontal visibility lies between 0-200 m), 109
DS (horizontal visibility lies between 200 m-1 km) and Dust Event (horizontal visibility lies 110
between 1-5 km). Along with horizontal visibility, we also use background weather conditions, 111
which refer to atmospheric phenomena occurring at the time of observation recorded at a given 112
station. The synoptic codes for dust observation are 7–9 and 30–35 (WMO 2009). In this study, 113
we considered one dust episode in a given day, even if there were two or more episodic events. 114
2.3. Study region 115
The topography of UAE and its surrounding regions is shown in Figure 1. The UAE is 116
located in the southwestern part of Asia bordered by the Arabian Gulf to the north, the Arabian 117
Sea and Oman to the east, Saudi Arabia to the south and Qatar and Saudi Arabia to the West. The 118
geographical location of the UAE is between 21.5o-26.5oN and 51.5o-56.5oE and covers an area of 119
about 77,700 km2. The UAE is comprised of large sandy desert, which covers about 90% of the 120
country’s surface area, extending from the Oman Mountains in the east to the coastline of the 121
Arabian Gulf. The mountains peak about ~1.4–1.6 km above mean sea level, and extend from the 122
north to the southeastern part of the country as shown in Figure 1. The blue line in Figure 1 123
indicates the Rub' al Khali desert, which is known as the Empty Quarter. Desert is a dominant 124
landscape in the UAE, from the massive rolling dunes in the Empty Quarter to the flat sandy and 125
gravel plains stretching towards the mountains. The UAE lies across the Tropic of Cancer, which 126
receives a large amount of radiation from the Sun during the summer. The wind pattern over this 127
region is northwesterly throughout the year, known as Shamal wind (Rao et al., 2001; Ouarda et 128
al., 2015). The climate of the UAE can be divided into two main seasons with two transition 129
periods: Summer (Jun-Sep), fall transition (Oct-Nov), winter (Dec-Mar), spring transition (Apr-130
May). 131
3. Results and discussion 132
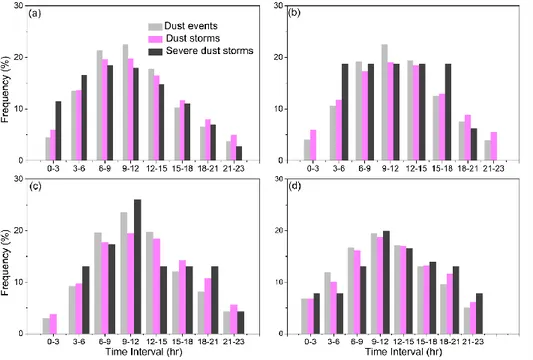
3.1. Diurnal variation in dust episodes 133
The diurnal frequency of dust episodes is estimated from hourly observations, which are 134
integrated to 3 hours’ timescale for all the four different stations as shown in Figure 2. Dust 135
episodes illustrate clearly the diurnal variation over the UAE region. The frequency of occurrence 136
of dust episodes is maximum during 9-15 hours. The diurnal variation in the frequency of dust 137
episodes in this region is consistent with previous studies over other regions in the world (Orgill 138
and Sehmel 1976; Natsagdorj et al. 2003; Wang et al. 2005; Guan et al. 2014). During daytime, 139
the heating of Earth’s surface takes place due to incoming solar radiation thus creating unstable 140
conditions favoring the formation of convection (Stull, 1998; Basha and Ratnam, 2009; Ratnam 141
and Basha, 2010). The nocturnal temperature inversion induces stability; removal of the inversion 142
due to surface heating during the day increases the environmental lapse rate to the dry adiabatic 143
lapse rate and increases instability. Convective sources cause the thermals of warm air to rise from 144
the ground, which leads to strong horizontal velocities, more intense turbulence and increased dust 145
entertainment and transport (Geiger et al., 1995). In addition, the sea breeze circulation and the 146
maximum differential temperature between sea temperature and land temperature during the later 147
afternoon and early evening, which, in conjunction with a Shamal, can considerably reduce 148
visibility. Sea breezes are like clockwork and very rarely is there a day without them along the 149
UAE gulf coast. 150
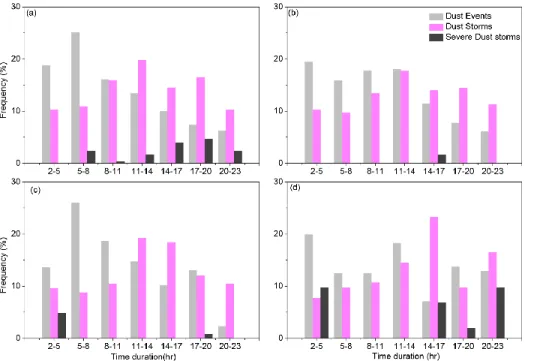
The climatological duration of dust episodes at four different stations is shown in Figure 151
3. We have considered only the dust episodes whose period is greater than 2 hours to identify its 152
temporal variability. Almost 55% of Dust episodes’ duration fall within the 2-8 hour period, and 153
40% of DSs were in the range of 5-11 hour period. The SDS duration varies from station to station. 154
The SDS duration is highest over Abu Dhabi followed by Dubai, Sharjah, and Ras Al Khaimah 155
(RAK). Over Abu Dhabi (Dubai), the maximum duration falls in 11-14 (8-11) hour period. The 156
Sharjah station shows a maximum duration of 5-8 hours. The temporal frequency of SDS at RAK 157
is about 15% during the period of 2-17 hours. 158
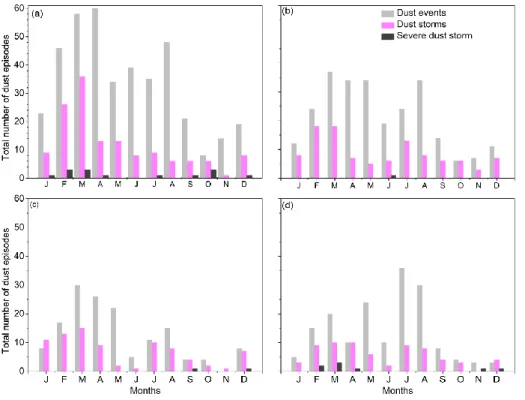
The monthly climatology of dust episodes at four stations in the UAE is shown in Figure 159
4. Significant seasonal variation is observed in dust episodes. The maximum number of Dust 160
episodes was observed over Abu Dhabi followed by Dubai, Sharjah, and RAK. The seasonal 161
distributions of dust events and DSs are maximum during winter followed by summer. Most of the 162
Dust events occur during March, April, and August in all locations. The DSs start peaking during 163
December, reach a maximum in March and then decrease reaching a minimum during August. 164
Over the UAE, SDSs are significantly low compared to DSs. The total number of SDSs observed 165
over the Abu Dhabi, Dubai, Sharjah, and RAK is 10, 4, 3, and 9 respectively, over the period 1983-166
2014. Although the four stations are separated by ~100 km distance, the impact of DSs varies 167
significantly from station to station. 168
The inter-annual variation of dust episodes during the period 1983-2014 is shown in Figure 169
5. Dust episodes show an increasing trend at all stations with a magnitude of 0.20, 0.025, 0.16 and 170
0.20/year over Abu Dhabi, Dubai, Sharjah, and RAK, respectively. The increasing trends in dust 171
events are large over Abu Dhabi, and RAK compared to the other two stations. The maximum 172
number of dust episodes over Abu Dhabi is observed during the year 2007. This number varies 173
from station to station. A moderate increasing trend is noticed in DSs in all stations. The dust 174
episodes show high and low phases during the 1983-1992 and 1994-1999 phases, respectively, 175
indicating decadal variability. Therefore, we have divided the total data series into three-decades 176
i.e. first decade (1983-1993), second decade (1994-2004) and third decade (2005-2014), to verify 177
the decadal variability of Dust episodes and DSs. In the first decade, the occurrence of dust 178
episodes is very high compared to the other decades except over RAK. Compared to the first and 179
third decades, the second decade shows a very low occurrence of dust episodes. The occurrence 180
of DSs increases significantly in the third decade in all stations. The Abu Dhabi station shows a 181
higher number of dust episodes compared to other stations. 182
3.2. Climatology of dust episodes: Synoptic scale analysis 183
In this section, we summarize the characteristics of synoptic scale climatology before, 184
during and after the event in the years 1983-2014. The synoptic pattern that generates DSs is shown 185
in Figure 6. The composite spatial and temporal distributions of Sea Level Pressure (SLP) along 186
with wind vectors at the surface level are selected before, during and after the DS to examine its 187
synoptic variability. The National Centers for Environmental Prediction (NCEP) reanalysis mean 188
SLP and surface winds are utilized to study the synoptic analysis of all the DSs which occurred 189
from 1983 to 2014 over the UAE region. The NCEP reanalysis uses a global data assimilation 190
system on 2.5o longitude and 2.5o latitude (Kalnay et al., 1996). The evolution of each event is 191
examined by extending the composite analysis to the days preceding (Days -6, -4 and -2), during 192
(Day 0) and following (Days +2, +4) the occurrence of DS. The anomalies are acquired by 193
removing from each DS the daily climatological mean for the reference period 1983-2014. The 194
most pronounced feature noticed is the occurrence of low pressure over the UAE region 195
corresponding to high pressure over north-east Africa. The strong southwesterly wind brings most 196
of the desert dust to the UAE region from Rub' al Khali. A strong cyclonic circulation pattern 197
clearly emerges 2 days before the occurrence of the DS. This pattern strengthens when it 198
approaches the day during the event and dissipates slowly after the event. The composite picture 199
indicates that the southwesterly surface winds bring dust to the UAE region. 200
The cyclonic circulation pattern is clearly emerging before and during the DS days, 201
associated with the low pressure over the UAE. During dusty days, the locations of the high-speed 202
winds (~3 ms-1) shift to the Rub' al Khali, which bring most of the dust to this region. The 203
composite wind speed and direction map shows speedy air streams during the beginning of the 204
DSs. This circulation transports a large amount of dust from the western part to the Southern part 205
of the Arabian Peninsula. The global pressure systems shift southward in winter. Low-pressure 206
systems and their troughs are closer to the UAE. Cooler air from the north is entrained around the 207
western flank of these systems, warm/hot air from the desert, to the south, along with the eastern 208
flank of the desert, assisted by the morning land breeze (de Villiers et al., 2007). 209
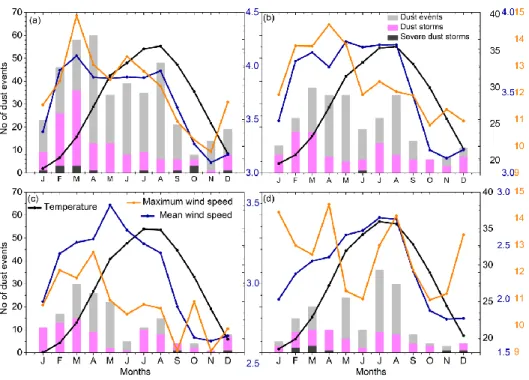
3.3. Relationship between dust episodes and climatic parameters 210
In this section, we investigated the relation between meteorological parameters and dust 211
episodes responsbile for the occurrence of dust storms. The monthly variation of dust episodes, 212
mean wind speed, maximum wind speed, and temperature is shown in Figure 7. The main observed 213
feature is the strong relationship between DSs and maximum wind speed with a correlation of 214
about 0.88, 0.83,0.82, 0.86 at the Abu Dhabi, Dubai, Sharjah and RAK stations, respectively. The 215
dust events significantly correlate with average wind speed with a coefficient value of about ~0.88 216
at all the stations. Therefore, DSs (dust events) correspond to the maximum (average) wind speed 217
over the UAE. From the above results, it is clear that wind has a significant impact on the 218
occurrence of dust episodes. The monthly mean temperature shows a maximum during August. 219
During this month, a maximum number of dust episodes is observed at all stations except Sharjah. 220
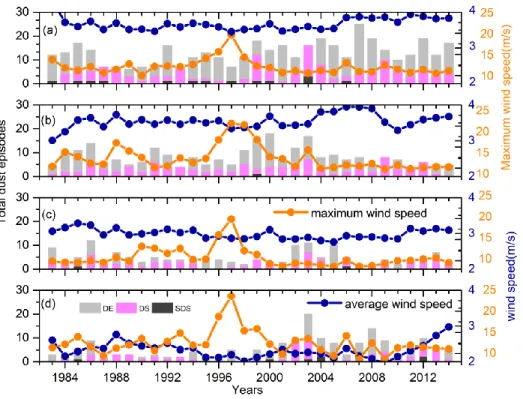
The annual variations of dust episodes, wind speed, and maximum wind speed during the 221
years 1983-2014 are shown in Figure 8. The maximum wind speed illustrates variations similar to 222
those of DS variability at inter-annual time scales except during the years 1992-2001. The mean 223
wind speed shows increasing (decreasing) trend over Abu Dhabi, Dubai (Sharjah and RAK). This 224
suggests that the mean wind speed is a significant contributing factor for the occurrence of DSs 225
compared with maximum wind speed. This might be due to the strong wind that lifts easily the 226
dust from sand rich areas where the DSs occur. The strong wind is the direct factor for causing the 227
DSs. The UAE is situated in an extremely dry region with a wide sandy surface and low vegetation 228
coverage. The ecological environment is fragile, with large areas of desert and decertified land, 229
which provide sufficient materials for the occurrence of DSs. 230
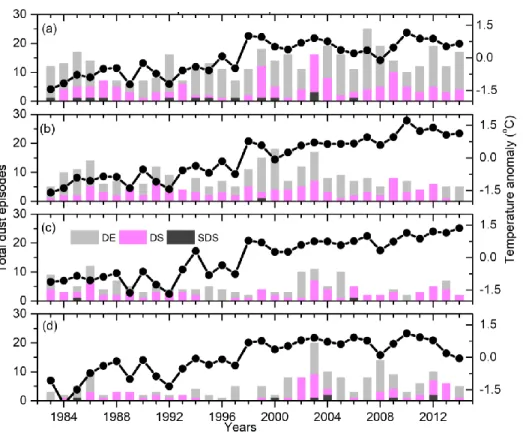
The annual temperature variation shows an increasing trend in all stations as shown in 231
Figure 9. A significant increase in temperature trend of ~ 0.065oC/year (averaged over all stations) 232
is noticed from the year 1983 over the UAE. Thus, an increase in temperature of about 2.08 K is 233
noticed in last 32 years over these stations. The relationship between temperature anomaly and 234
dust episodes is very complex. A positive correlation is observed between temperature, dust events 235
and DSs. A higher temperature leads to an increase in surface evaporation, which reduces 236
precipitation. These effects give rise to the creation of drier and looser surface soil and the most 237
frequent DSs. An increasing trend in temperature and dust episodes is observed in Figure 9. 238
Previous work by Zhand and Reid (2010) showed the large increase of AOD over Coastal China, 239
the Indian Bay of Bengal, and the Arabian Sea. Particularly, over the coastal part of India, the 240
increase in AOD depicts a worsening scenario to heavily polluted air, which impacts the local 241
regional climate. Hsu et al. (2012) observed a significant increasing trend in mineral dust over the 242
Arabian Peninsula by considering 13-years of MODIS AOD data, which matches with our present 243
study. The increase in Arabian dust directly influenced the Indian monsoon circulation and 244
contributed to rainfall increase over the southern part of India as discussed by Solmon et al. (2015). 245
4. Summary and Conclusions 246
This study focuses on the climatic variability of dust episodes over a 30 year period in the UAE 247
region. The diurnal, monthly and inter-annual variations of dust episodes and their relation with 248
mean wind speed, maximum wind speed, and temperature are investigated. In addition, the 249
synoptic climatology of DSs and reduction/enhancement in temperature/wind speed are also 250
investigated. The main conclusions are summarized in the following: 251
1. There exists a clear diurnal variation in the occurrence of dust episodes with a peak during 252
9-12 hour local time. 253
2. The duration of dust events has a period of 2-5 hours, whereas DSs have a large period 254
ranging between 5-8 hours. 255
3. The duration of the SDS is largest, over Abu Dhabi followed by Dubai, Sharjah, and RAK. 256
Over Abu Dhabi (Dubai), the maximum duration falls in the range of 11-14 (8-11) hours. 257
The Sharjah station shows a maximum duration of 5-8 hours. The temporal frequency of 258
SDS at RAK is about 15% during the 2-17 hour local time. 259
4. The seasonal distributions of dust episodes and DSs are maximum during the winter 260
followed by summer. Most of the dust episodes occur during March and April in all the 261
locations except RAK. A maximum number of dust episodes is observed over Abu Dhabi 262
followed by Dubai, Sharjah, and RAK. 263
5. The maximum temperature during August corresponds to the occurrence of a large number 264
of dust episodes in all stations. 265
6. The occurrence of DSs increases significantly during the recent decade at all stations. The 266
Abu Dhabi station shows a higher number of dust episodes compared to the other stations. 267
A clear increasing trend in dust episodes of 0.20, 0.025, 0.16 and 0.20/year is noticed over 268
Abu Dhabi, Dubai, Sharjah, and RAK, respectively. 269
7. The occurrence of low pressure over the UAE and corresponding high pressure over 270
northeast Africa leads to strong southwesterly winds, which brings most of the desert dust 271
to the UAE from Rub' al Khali. A strong cyclonic circulation pattern emerges clearly two 272
days prior to the occurrence of DS. 273
8. On the monthly time scale, dust events significantly correlate (>0.80) with mean wind 274
speed whereas DS correlates with maximum wind speed. 275
9. The most common wind direction during the dust episode period is mainly from the 276
southwest direction. This suggests that dust is brought from the Rub' al Khali region to the 277
UAE region. 278
Over East Asia, the decrease in intensity and frequency of SDSs is due to the decrease in 279
the intensity of polar vortex (An et al., 2018). Increase in extreme precipitation reduces the 280
frequency of dust storms over China (Wang et al., 2016). However, our results suggest that 281
the mean wind speed is a significant contributing factor to the occurrence of dust episodes. 282
Maximum wind speed contributes to the occurrence of major DSs. During summer, the 283
temperature over this region reaches a peak value, and the surface soil becomes drier with 284
looser surface. Wind speed is low during the summer months over this region. As the 285
precedence of winter, wind speed becomes higher and the particles of dust or sand are lifted 286
to higher heights by strong and turbulent wind. The visibility is then reduced to less than 287
few hundred meters. An interesting feature noted in the present study is that the increase 288
in surface temperature is associatedr to an increase in dust events. Though part of the 289
increase in surface temperature can be explained by global warming, the reported increase 290
in global temperature was only 0.87 K during the period 1880-2015 291
(http://climate.nasa.gov/vital-signs/global-temperature/). The additional 1.21 K over these 292
stations can be partly related to the increase in dust episodes. Since global temperatures are 293
expected to increase further, dust episodes are also expected to increase in the UAE. 294
Acknowledgements 295
The authors wish to thank the National Climate DataCenter and NCEP data center for 296
providing hourly observations of surface data and reanalysis data. 297
References 298
299
An, L., Che, H., Xue, M., Zhang, T., Wang, H., Wang, Y., Zhou, C., Zhao, H., Gui, K., Zheng, Y., 300
Sun, T., 2018. Temporal and spatial variations in sand and dust storm events in East Asia from 301
2007 to 2016: relationships with surface conditions and climate change. Sci. Total Environ. 302
633, 452–462. 303
Basha, G., Phanikumar, D.V., Kumar, K.N., Ouarda, T.B.M.J., Marpu, P.R., 2015. Investigation 304
of aerosol optical, physical, and radiative characteristics of a severe dust storm observed over 305
UAE. Rem. Sen. Env. doi:10.1016/j.rse.2015.08.033. 306
Basha, G., Ratnam, M.V., 2009. Identification of atmospheric boundary layer height over a tropical 307
station using high resolution radiosonde refractivity profiles: Comparison with GPS radio 308
occultation measurements. J. Geophys. Res., 114, D16101. 309
http://dx.doi.org/10.1029/2008JD011692. 310
de Villiers, M.P., van Heerden, J., 2007. Dust storms and dust at Abu Dhabi International Airport. 311
Weather 62, no. 12: 322–350. 312
Ekström, M., McTainsh, G.H., Chappell, A., 2004. Australian dust storms: temporal trends and 313
relationships with synoptic pressure distributions (1960–99). Int. J. Climatol. 24:1581–1599. 314
Gao, T., Su, L.J., Ma, Q.X., Li, H.Y., Li, X.C., Yu, X., 2003. Climatic analyses on increasing dust 315
storm frequency in the springs of 2000 and 2001 in Inner Mongolia. Int. J. Climatol. 316
23(14):1743–1755. 317
Geiger, R., Aron, R., Todhunter, P.E., 1995. The climate near the ground. Vieweg, Wiesbaden, pp 318
97–107. 319
Gobbi, G., Barnaba, F., Ammannato, L., 2007. Estimating the impact of Saharan dust on the year 320
2001 PM10 record of Rome, Italy. Atmos. Environ. 41, 261–275, 321
doi:10.1016/j.atmosenv.2006.08.036. 322
Goudie, A.S., Middleton, N., 2006. Desert dust in the global system. New York: Springer Berlin 323
Heidelberg 324
Guan, Q., Yang, J., Zhao, S., Pan, B., Liu, C., Zhang, D., Wu, T., 2014. Climatological analysis of 325
dust storms in the area surrounding the Tengger Desert during 1960–2007. Clim. Dyn. 45, 903– 326
913. http://dx.doi.org/10.1007/ s00382-014-2321-3. 327
Hansell, R.A., Liou, K.N., Ou, S.C., Tsay, S.C., Ji, Q., Reid, J.S., 2008. Remote sensing of mineral 328
dust aerosol using AERI during the UAE2: A modeling and sensitivity study. J. Geophys. Res. 329
113, D18202. doi:10.1029/2008JD010246. 330
Hara, Y., Uno, I., Wang, Z., 2006. Long-term variation of Asian dust and related climate factors. 331
Atmos. Environ. 40, 6730–6740. 332
Hsu, N.C., Gautam, R., Sayer, A.M., Bettenhausen, C., Li, C., Jeong, M.J., Tsay, S.C., Holebn, 333
B.N., 2012. Global and regional trends of aerosol optical depth over land and ocean using 334
SeaWiFS measurements from 1997 to 2010. Atmos. Chem. Phys. 12 (17), 8037e8053. 335
IPCC Climate Change, 2013. The Physical Science Basis. Contribution of Working Group I to the 336
Fifth Assessment Report of the Intergovernmental Panel on Climate Change. Cambridge 337
Kalnay, E., Kanamitsu, M., Kistler, R., Collins, W., Deaven, D., Gandin, L., Iredell, M., Saha, D., 339
White, G., Woollen, J., Zhu, Y., Chelliah, M., Ebisuzaki, W., Higgins, W., Janowiak, J., Mo, 340
K.C., Ropelewski, C., Wang, J., Leetma, A., Reynolds, R., Dennis, J., 1996. The NCEP/NCAR 341
40-years reanalysis project. Bull. Am. Meteorol. Soc. 77, 437–472. 342
Kaplan, M.L., Vellore, R. K., Lewis, J. M., Young, M., 2011. The role of unbalanced mesoscale 343
circulations in dust storms. J. Geophys. Res. 116, D23101. doi:10.1029/2011JD016218 344
Kumar, K.N., Molini, A., Ouarda, T.B.M.J. and Rajeevan, M.N., 2017. North Atlantic controls on 345
wintertime warm extremes and aridification trends in the Middle East, Scientific Reports, 7(1): 346
12301. doi:10.1038/s41598-017-12430-3. 347
Lekas, T., Kallos, G., Kushta, J., Solomos, S., Spyrou, C., 2011. Impacts of dust on aviation,” in 348
Proceedings of the 6th International Workshop on Sand/Dust storms and Associated Dust fall, 349
Athens, Greece. 350
Maghrabi, A., Alharbi, B., Tapper, N., 2011. Impact of the March 2009 dust event in Saudi Arabia 351
on aerosol optical properties, meteorological parameters, sky temperature and emissivity. 352
Atmos. Environ., 45:2164–2173. 353
Miller, S.D., Kuciauskas, A.P., Liu, M., Ji, Q., Reid, J.S., Breed, D.W., Walker, A.L., Mandoos, 354
A.A., 2008. Haboob dust storms of the southern Arabian Peninsula. J. Geophys. Res. 113, 355
D01202. doi: 10.1029/2007JD008550. 356
Naizghi, M.S. and Ouarda, T.B.M.J., 2017. Teleconnections and analysis of long-term wind speed 357
variability in the UAE, International Journal of Climatology, 37(1): 230-248. 358
doi:10.1002/joc.4700. 359
Natsagdorj, L., Jugdera, D., Chung, Y.S., 2003. Analysis of dust storms observed in Mongolia 360
during 1937–1999. Atmos. Environ. 37(9–10):1401–1411. 361
Niranjan Kumar, K., Ouarda, T.B.M.J., Sandeep, S. and Ajayamohan, R.S., 2016. Wintertime 362
precipitation variability over the Arabian Peninsula and its relationship with ENSO in the 363
CAM4 simulations, Climate Dynamics, 47(7): 2443-2454. doi:10.1007/s00382-016-2973-2. 364
Niranjan Kumar, K. and T.B.M.J. Ouarda, 2014. Precipitation variability over UAE and Global 365
SST Tele-connections, Journal of Geophysical Research-Atmosphere. 119(17). 366
doi:10.1002/2014JD021724. 367
Notaro, M., Alkolibi, F., Fadda, E., Bakhrjy, F., 2013. Trajectory analysis of Saudi Arabian dust 368
storms. J. Geophys. Res. 118, 6028–6043. 369
Orgill, M.M., Sehmel, G.A., 1976. Frequency and diurnal variation of dust storms in the 370
contiguous U.S.A. Atmos. Environ. 10(10):813–825. 371
Ouarda, T.B.M.J., Charron, C., Niranjan Kumar, K., Marpu, P., Ghedira, H., Molini, A., Khayal, 372
I., 2014. Evolution of the rainfall regime in the UAE, Journal of Hydrology, 514 (June): 258– 373
270. doi:10.1016/j.jhydrol.2014.04.032. 374
Ouarda, T.B.M.J., Charron, C., Shin, J.-Y., Marpu, P.R., Al-Mandoos, A.H, Al-Tamimi, M.H., 375
Ghedira, H. and T.N. Al Hosary, 2015. Probability distributions of wind speed in the UAE, 376
Energy Conversion and Management, 93:414-434. doi:10.1016/j.enconman.2015.01.036. 377
Qian, W.H., Quan, L., Shi, S., 2002. Variations of the dust storm in China and its climatic control. 378
J. Clim. 15(10):1216–1229. 379
Rao, P.G., Al-Sulaiti, M.H., Al-Mulla, A.H., 2001. Winter Shamals in Quatar, Arabian Gulf. 380
Weather 56(12): 444–451. 381
Ratnam, M.V., Basha, G., 2010. A robust method to determine global distribution of atmospheric 382
boundary layer top from COSMIC GPS RO measurements. Atmos. Sci. Lett., 11, 216–222. 383
http://dx.doi.org/10.1002/asl.277. 384
Sabbah, I., Hasan, F.M., 2008. Remote sensing of aerosols over the Solar Village, Saudi Arabia. 385
Atmos. Res. 90, 170–179. 386
Solmon, F., Nair, V.S., Mallet, M., 2015. Increasing Arabian dust activity and the Indian summer 387
monsoon. Atmos. Chem. Phys. 15, 8051–8064. 388
Steenburgh, W.J., Massey, J.D., Painter, T.H., 2012. Episodic dust events of Utah's Wasatch front 389
and adjoining region. J. Appl. Meteorol. Climatol 51, 1654–1669. 390
https://doi.org/10.1175/JAMC-D-12-07.1 391
Stull, R.B., 1988. An Introduction to Boundary Layer Meteorology. Kluwer, 666pp. 392
Sun, J.M., Zhang, M.Y., Liu, T.S., 2001. Spatial and temporal characteristics of dust storms in 393
China and its surrounding regions, 1960–1999: relations to source area and climate. J. Geophys. 394
Res. 106(10):325–333. 395
Wang, K., Zhang, Y., Zhang, X., Fan, J., Leung, L.R., Zheng, B., Zhang, Q., He, K., 2018. Fine-396
scale application of WRF-CAM5 during a dust storm episode over East Asia: sensitivity to grid 397
resolutions and aerosol activation parameterizations. Atmos. Environ. 176, 1–20. 398
https://doi.org/10.1016/j.atmosenv.2017.12.014 399
Wang, S.G., Wang, J.Y., Zhou, Z.J., Shang, K.Z., 2005. Regional characteristics of three kinds of 400
dust storm events in China. Atmos. Environ. 39(3):509–520. 401
WMO, 2011., WMO Sand and Dust Storm Warning Advisory and Assessment System 402
(SDSWAS)-Science and Implementation Plan 2011–2015, Research Department, Atmospheric 403
Research and Environment Branch. 404
WMO., 2009. Manual on codes: International codes. Vol. I.1 (Part A—Alphanumeric codes), 405
WMO-No.306.Available online at
406
http://www.wmo.int/pages/prog/www/WMOCodes/VolumeI1.html#VolumeI1. 407
Yang, Y.Q., Hou, Q., Zhou, C.H., Liu, H.L., Wang, Y.Q., Niu, T., 2008. Sand/dust storm processes 408
in Northeast Asia and associated largescale circulations. Atmos. Chem. Phys. 8:25–33. 409
Zhang, J., Reid, J.S., 2010. A decadal regional and global trend analysis of the aerosol optical 410
depth using over water MODIS and MISR aerosol products. Atmos. Chem. Phys. 10, 10949– 411
10963. 412
Zhang, R.J., Ho, K.F., Shen, Z.X., 2012. The role of aerosol in climate change, the environment, 413
and human health. Atm. and Oce. Sci. Letters., vol. 5, no. 2, pp. 156– 161. 414
Zhang, X.Y., Arimoto, R., An, Z.S., 1997. Dust emission from Chinese desert sources linked to 415
variations in atmospheric circulation. J. Geophys. Res. 102(D23), 28,041–28,047. 416 417 418 419 Figures: 420 421 422 423 424
(d
e
Ras Al Khaimah
Sharjah
Dubai
Saudi Arabia
Abu Dhabi
425 426 427 428 429 430 431
Figure 1. Digital Elevation Map (DEM) of Middle East. Observational stations are shown by Green 432
dots. Abu Dhabi (54.37°E, 54.37°E), Dubai (55.27°E, 25.20°N), Sharjah (55.42°E, 25.34°N), 433
and Ras Al Khaimah (55.98°E, 25.67°N). The dark white line indicates the spatial extent of 434
Rub' al Khali or Empty Quarters (Not to Scale) which is the largest sand desert in the world 435
covering most of the southern third of the Arabian Peninsula. 436
437 438
439
Figure 2. Diurnal variation of dust events, dust storms and severe dust storms over (a) Abu Dhabi, 440
(b) Dubai, (c) Sharjah and (d) RAK averaged over the years 1983 to 2014. 441
442 443 444 445
446
Figure 3. Duration of dust events, dust storms and severe dust storms over (a) Abu Dhabi, (b) 447
Dubai, (c) Sharjah and (d) RAK averaged over the years 1983 to 2014. 448 449 450 451 452 453 454
455
Figure 4. Monthly variation of dust events, dust storms and severe dust storms over (a) Abu Dhabi, 456
(b) Dubai, (c) Sharjah, and (d) RAK averaged over the years 1983 to 2014. 457 458 459 460 461 462 463 464
Figure 5. Yearly variation of dust events and dust storms over (a) Abu Dhabi, (b) Dubai, (c) 466
Sharjah, and (d) RAK ,observed during 1983 to 2014. The straight line indicates the linear 467
trend. 468
469
Figure 6. Temporal evaluation of composite wind vectors at 1000 hPa superimposed on Sea Level Pressure (SLP) from NCEP/NCAR
470
reanalysis over the Arabian Peninsula. The SLP anomalies for the Days -6, -4, -2 belong to preceding events (a, b, c). Day ‘0’ refers
471
to the event occurrence day (d). Days 2 and 4 occur after the event.
472 473 474
475 476 477
478
Figure 7. Monthly variation of dust events, dust storms, severe dust storms over (a) Abu Dhabi, 479
(b) Dubai, (c) Sharjah and (d) RAK averaged over the years 1983 to 2014. The mean wind 480
speed (ms-1), maximum wind speed (ms-1) and temperature (oC) observed during the same 481
period are also superimposed with the axis on the right. 482
483 484 485 486
487 488
489
Figure 8. Annual variation of dust events, dust storms, and severe dust storms over (a) Abu Dhabi, 490
(b) Dubai, (c) Sharjah and (d) RAK, observed during 1983 to 2014. The mean wind speed (ms -491
1) and maximum wind speed (ms-1) observed during the same period are also superimposed 492
with the axis on the right. 493
494 495 496 497
498 499 500
501
Figure 9. Annual variation of dust events, dust storms, and severe dust storms observed during 502
1983 to 2014 over (a) Abu Dhabi, (b) Dubai, (c) Sharjah and (d) RAK. The monthly mean 503
temperature anomaly (oC) observed during the same period is also superimposed with the axis 504
on the right. 505