HAL Id: tel-02981059
https://pastel.archives-ouvertes.fr/tel-02981059
Submitted on 27 Oct 2020HAL is a multi-disciplinary open access archive for the deposit and dissemination of sci-entific research documents, whether they are
pub-L’archive ouverte pluridisciplinaire HAL, est destinée au dépôt et à la diffusion de documents scientifiques de niveau recherche, publiés ou non,
microfluidics
Kevin Grosselin
To cite this version:
Kevin Grosselin. Cancer treatment and relapse : single-cell chromatin profiling of rare persister cells using dropbased microfluidics. Biochemistry, Molecular Biology. Université Paris sciences et let-tres, 2018. English. �NNT : 2018PSLET015�. �tel-02981059�
THÈSE DE DOCTORAT
de l'Université de recherche Paris Sciences et Lettres
PSL Research University
Préparée à ESPCI Paris
Cancer treatment and relapse: single-cell chromatin profiling of rare
persister cells using droplet-based microfluidics
École doctorale n
o388
CHIMIE PHYSIQUE ET CHIMIE ANALYTIQUE DE PARIS CENTRE
Spécialité
CHIMIE PHYSIQUESoutenue par
Kevin GROSSELIN
le 26 Septembre 2018
Dirigée par Prof. Andrew Griffiths
CONFIDENTIEL
COMPOSITION DU JURY :
Mr Christian Muchardt Institut Pasteur, Président
Mme Virginie Pénard-Lacronique Institut Gustave Roussy, Rapporteur Mme Anne-Marie Gué
LAAS, Rapporteur Mme Angela Taddei Institut Curie, Examinateur Mr Joshua Waterfall Institut Curie, Examinateur Mr Andrew Griffiths
Remerciements
Mes remerciements s’adressent en premier lieu à Annabelle Gérard et Andrew Griffiths. Annabelle, tu n’as pas choisi la facilité il y a 4 ans en faisant confiance à un petit chimiste qui n’avait jamais touché une pipette ! Tu as su me trans-mettre les connaissances et la rigueur nécessaire pour la réussite de ce travail de thèse. Si j’en suis à rédiger ce manuscrit aujourd’hui c’est en grande partie grâce à toi, merci pour tout. Andrew, merci de m’avoir accueilli au sein du Laboratoire de Biochimie. J’ai bénéficié d’un environnement de travail remarquable qui m’a permis de m’épanouir scientifiquement et humainement. Je te remercie pour ta disponibilité et ta confiance aux cours de ces années de thèse.
Je remercie Fred Dom, directeur d’HiFiBiO France, d’avoir financé mes recherches au cours de ces 4 dernières années. Tu m’as toujours considéré comme un membre à part entière d’HiFiBiO bien que tu n’aies pas toujours été tendre avec moi (2 défaites sévères en autant de matchs de squash !). J’ai eu la chance de pouvoir bénéficier de toutes les ressources nécessaires pour mener à bien mon projet scien-tifique.
Je remercie Mme Virginie Pénard-Lacronique, Mme Anne-Marie Gué, Mme An-gela Taddei, Mr Christian Muchardt & Mr Joshua Waterfall d’avoir accepté de faire partie du jury de soutenance de ma thèse.
Je remercie chaleureusement Céline Vallot de l’Institut Curie pour notre intense collaboration au cours de cette dernière année. A ce titre, je remercie également Virginie Pénard-Lacronique de l’Institut Gustave Roussy, Jan Zylicz de l’Institut Curie et les plateformes de séquençage de l’Institut Curie et de l’ICM qui ont ac-cepté mes demandes les plus farfelues et toujours traité mes échantillons dans les plus brefs délais.
Ce travail de thèse n’était pas un cavalier seul et de nombreuses personnes ont contribué à son avancement. Marcel, merci pour ton aide précieuse lors du développement microfluidique. Tu as toujours refusé l’idée du Kevinator mais avec
du recul je crois que c’était un mal pour un bien ! Adam, merci pour les analyses des données de séquençage et pour m’avoir encouragé à apprendre la program-mation. Baptiste, merci d’avoir partagé toute ta rigueur expérimentale, mais je l’avoue je ne découpe pas encore les dents de crocodile des petits bouts de Scotch ! Merci, Yannick, pour m’avoir fourni des billes de grande qualité ; Adeline, pour ton aide précieuse lors de notre fameuse ”Hell Week” ; Vera, même si tu ne m’as jamais dit que filtrer les cellules à la décongélation n’était pas forcément utile ; les membres anonymes de la team Mickey, avec qui les discussions étaient toujours productives (en deux mots : Yellow Submarine) ; le B230, dont j’ai pris beaucoup de plaisir à diriger ! Merci Raph, pour m’avoir transmis ton savoir microfluidique ; Antoine, même si tu n’as toujours pas compris qu’une bonne ligne de commande vaut mieux qu’une interface graphique ; Sophie, bien que tu aies brisé notre binôme ménage SCC ; Steph, ”the umr manager!” partie trop tôt en télétravail.
Merci ma chère Marina, mes chers Pablo, Stéphane et Marco. Vous m’avez tou-jours donné d’excellents conseils et étiez toutou-jours présents pour répondre à mes questions, même les moins pertinentes ! Merci Isa, Hélène et Céline, vous êtes indispensables et votre aide a grandement facilité mon quotidien.
Je sais pertinemment que ce travail de thèse n’aurait pas été de même qual-ité sans vous les amis. Je pense notamment à tous les Sages et à toi, Le Van. Que ce soit en Tunisie, en Ariège, en Bretagne, en Corse, en Ardèche ou lors de l’Appartathon, des TBT et du Marathon du Médoc, ces moments passés ensemble resteront des souvenirs impérissables de cette période de thèse.
Merci Maman, Papa, Groli, Poup et Bikou pour votre soutien tout au long de la thèse. Vous avez toujours été et vous resterez une formidable source d’inspiration. Enfin, je profite de ces dernières lignes pour remercier la personne dont la con-tribution à ce travail a été la plus grande. Tu es la première personne à subir mes états d’âme mais tu as eu la patience et le courage d’y faire face. Je ne pense pas me tromper en écrivant ici que tout ceux qui ont travaillé avec moi au cours de ces dernières années se joignent également à ces remerciements. S’ils ont eu la chance de me connaitre souriant et agréable au quotidien, c’est grâce à toi ! Elodie, merci.
Contents
Remerciements i
Contents iii
List of Figures vii
List of Tables ix
Abstract xiii
Introduction
1
1 From chromatin modifications to cell-type identity 3
1.1 Packaging DNA . . . 4
1.1.1 The nucleosome: subunit of chromatin . . . 4
1.1.2 Higher order of chromatin organization . . . 5
1.2 Chromatin modifications and their machineries . . . 6
1.2.1 DNA methylation . . . 7
1.2.2 Histone post-translational modifications . . . 7
1.3 Functional consequences of histone modifications . . . 10
1.3.1 Establishing global chromatin environments . . . 10
1.3.2 Regulation of DNA-based processes . . . 12
1.3.3 Histone modifications interactions . . . 12
1.4 Defining cell identity based on histone modifications . . . 14
1.4.1 Genome-wide mapping of histone modifications . . . 14
1.4.2 Epigenomic signatures define cell-type identity . . . 18
2 Droplet-based microfluidics for single-cell epigenomic profiling 21 2.1 Scaling by shrinking . . . 23
2.2 Droplet-based microfluidics . . . 25
2.2.1 Key features of droplet-based microfluidics . . . 25
2.2.2 Manipulating droplets . . . 26
2.2.3 Predicting cell compartmentalization . . . 29
2.3 Single-cell -omics in droplets . . . 29
2.3.1 Droplets barcoding . . . 29
2.3.2 State of the art in single-cell -omics using droplet-based microfluidics workflows . . . 32
2.4 Mapping histone modifications at single-cell resolution . . . 35
3 Studying epigenetic intratumoral heterogeneity to better understand the emergence of therapeutic resistance 39 3.1 Epigenetic abnormalities in tumors . . . 40
3.1.1 Chromatin modifications are disrupted in malignant cells . . 40
3.1.2 Epigenetic intratumoral heterogeneity contributes to therapeutic resistance . . . 41
3.2 Deciphering intratumoral heterogeneity at the single-cell level . . . 42
3.3 Scope of the thesis . . . 44
Results
47
4 Development of a single-cell ChIP-seq platform for the mapping of histone post-translational modifications at the single-cell level 49 4.1 Introduction to the droplet-microfluidic workflow . . . 514.2 Synchronizing & pausing chromatin fragmentation in droplets . . . 56
4.2.1 Compartmentalization of cells in droplets . . . 56
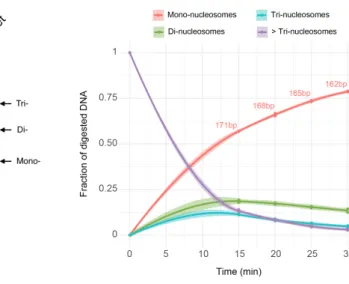
4.2.2 MNase calibration in droplets . . . 58
4.2.3 Controlling MNase activity in droplets . . . 60
4.3 DNA barcoding strategy for efficient chromatin indexing at single-cell resolution . . . 62
4.3.1 Introduction to the DNA barcoding strategy . . . 62
4.3.2 Precise DNA barcode design improved chromatin indexing in droplets . . . 65
4.4 Nucleosomes barcoding in droplets . . . 70
4.4.1 Delivering DNA barcodes into nucleosomes-containing droplets 70 4.4.2 Inactivating MNase in droplets . . . 75
4.4.3 Assessing barcode-nucleosome ligation efficacy in droplets . . 77
CONTENTS 5 Single-cell ChIP-seq identifies rare sensitive tumor cells with
chro-matin state similar to resistant tumor cells after treatment 83 5.1 Reconstructing cell type-specific chromatin states from single-cell
ChIP-seq profiles . . . 85 5.1.1 Maintaining single-cell resolution throughout the scChIP-seq
procedure . . . 85 5.1.2 Accurate clustering of cell type-specific chromatin states . . 87 5.1.3 In silico simulation of detection limit . . . 93 5.1.4 Distinguishing subpopulations from heterogeneous cell
sus-pension . . . 95 5.1.5 Conclusion & perspectives . . . 97 5.2 Grosselin et al, in preparation . . . 97
Discussion
131
Appendix
139
A Material & Methods related to [Grosselin et al, in preparation] 141 B Bioinformatic pipeline for single-cell ChIP-seq data analysis 147 B.1 Introduction to the bioinformatic pipeline . . . 147 B.2 Overview of raw reads processing steps . . . 150
List of Figures
1.1.1 ”Beads on a string” structure of chromatin . . . 5
1.1.2 Packaging DNA . . . 6
1.3.1 Histone modifications crosstalk . . . 13
1.3.2 Interplay between DNA methylation and histone modifications . . 14
1.4.1 Genome-wide mapping of histone modifications by Chromatin Im-munoPrecipitation followed by sequencing (ChIP-seq) . . . 17
1.4.2 Chromatin states define cell identity . . . 18
2.0.1 Evolution of the number of cells profiled in single-cell RNA-seq experiments . . . 22
2.1.1 Microfluidic confinement strategies for single-cell analysis . . . 24
2.2.1 Examples of microfluidic modules for manipulating droplets . . . 28
2.2.2 Predicting the number of cells per droplets . . . 29
2.4.1 Overview of Drop-ChIP procedure developed by Rotem et al . . . 37
4.1.1 Schematic illustrating the microfluidic workflow of the single-cell ChIP-seq procedure . . . 55
4.2.1 Monitoring cell encapsulation in 45 pl droplets . . . 57
4.2.2 Calibration of MNase activity in droplets . . . 59
4.2.3 Synchronizing & pausing MNase activity between droplets . . . 61
4.3.1 Quality controls of barcoded hydrogel beads . . . 64
4.3.2 The original barcode design yields low proportion of reads with a correct structure . . . 66
4.3.3 Optimizing the barcode structure greatly enhanced the quality of the sequencing data . . . 69
4.4.1 Monitoring hydrogel beads loading in 100 pl droplets . . . 71
4.4.2 Monitoring droplets fusion . . . 73
4.4.3 MNase inactivation in droplets . . . 76
4.4.4 Schematic drawing illustrating the model experiment used to assess ligation efficacy in droplets . . . 79
5.1.1 Sequencing a mix of human and mouse cells reveals specie-specific mapping and single-cell resolution . . . 86 5.1.2 Design of proof of concept study and expected outcome . . . 88 5.1.3 Deconvolution of single-cell barcodes associated with cell
type-specific sequences . . . 90 5.1.4 Increasing cell coverage lowers detection limit of rare cell populations 94 5.1.5 Deciphering chromatin states from heterogeneous samples . . . 96 B.1 Bioinformatic pipeline for processing of raw scChIP-seq data . . . 148 B.2 Decomposition of sequencing libraries . . . 149 B.1 Distribution of the number of reads per barcode . . . 151 B.2 Strategy for the identification of duplicates reads . . . 152 B.3 Impact of the sequencing depth on the total number of reads per
label . . . 154 B.4 Statistics of duplicate reads identification for 3 distinct histone
List of Tables
1.1 Classes of histone modifications . . . 8
3.1 Functional consequences of altered chromatin modifications in can-cer . . . 40
5.1 Sequencing performance (1/2) . . . 91
5.2 Sequencing performance (2/2) . . . 91
Cancer treatment and relapse:
single-cell chromatin profiling of rare
persister cells using droplet-based
Abstract
E
pigenetic mechanisms including DNA methylation and histone modifications modulate chromatin structure and cell-type specific functions. Epigenomic pro-filing have revealed that chromatin landscapes are widely altered in cancer cells. Genome-wide maps of histone modifications are conventionally obtained by Chro-matin ImmunoPrecipitation followed by sequencing (ChIP-seq). However, this method only yields an average snapshot of the modification status and doesn’t provide insight about intratumoral epigenetic heterogeneity. Rare subpopulations including drug-tolerant persister cells remain undetectable.Droplet-based microfluidics allow to use micro-metric monodisperse droplets as reaction vessels to perform high-throughput single-cell assays. In this thesis, I describe a single-cell ChIP-seq system combining droplet microfluidics with DNA barcoding technology that enables histone modifications mapping at single-cell resolution, from thousands of cells. Chromatin from individual cells is fragmented and barcoded in droplets prior immunoprecipitation and sequencing library prepa-ration. Sequencing reads deconvoluted by their barcode sequence attribute each sequence to their originating cells allowing reconstruction of single-cell chromatin profiles with an unprecedent coverage of up to 104 unique loci per cell.
Applied to profile chromatin marks associated with active transcription and re-pressed gene expression (H3K4me3 & H3K27me3) in mixed population of human B and T lymphocytes, scChIP-seq showed that >99% of the cells were correctly identified, defining distinct chromatin states of immune cells with high accuracy. In patient-derived xenograft (PDX) models of breast cancer with acquired drug resistance, the method identified rare populations of cells in the untreated, drug-sensitive tumors with a chromatin landscape similar to resistant cells after treat-ment. These results highlight the potential selection of cells with chromatin marks in response and resistance to cancer therapy.
Chapter 1
From chromatin modifications to
cell-type identity
A fundamental research question in biology is to understand how hundreds of dis-tinct cell types arise from identical genetic material in multicellular organisms. The many different cell types can’t be explained solely by genetics but rather by an additional information that can bridge phenotype to genotype. In 1942, Con-rad H. Waddington coined the term Epigenetics as ”the branch of biology which studies the causal interactions between genes and their products, which bring the phenotype into being” [Waddington 42].
Since then, studies have shown that differential patterns of gene expression un-derlie the diversity of phenotypes, with the two being closely related to the orga-nizational structure of DNA in the cell. In many instances, patterns of gene ex-pression and associated phenotypes are preserved through cellular division. Hence, epigenetics may be nowadays defined as the study of stable and ideally heritable changes in gene expression (or phenotype) without changes in the underlying DNA sequence.
Eukariotic genomes are organized within nucleus into chromatin, a complex nu-cleoprotein structure discovered as early as 1882 [Flemming 82]. The functions of the chromatin extend well beyond simple DNA compaction. An additional layer of ”epigenetic information” is stored in the form of chemical modifications impact-ing both DNA and histone proteins that constitute the chromatin. Epigenetic mechanisms through chromatin modifications regulate gene expression and shape specific chromatin landscapes, which allow predictions to be made about cell type and tissue identity [Bernstein 05, Barski 07].
1.1 Packaging DNA
1.1.1 The nucleosome: subunit of chromatin
“A eukaryotic chromosome made out of self-assembling 70 Å units, which could perhaps be made to crystallize, would necessitate rewriting our text-books on cytology and genetics! I have never read such a naive paper purporting to be of such fundamental significance. Definitely it should not be published anywhere!” a
aAnecdote reported by Donald E. Olins and Ada L. Olins in their review ”Chromatin
history: our view from the bridge” [Olins 03]
In these words, a reviewer from Nature rejected this new view of chromatin structure hypothesized as early as 1973 by Christopher L. Woodcock. Yet the partial digestion of nuclear DNA by micrococcal nuclease already revealed DNA fragments of a size multiple of 200 base pairs corresponding to the nucleosomal DNA [Hewish 73], but their first observation as particles was made by Donald and Ada Olins in 1974 using electron microscopy (see Fig. 1.1.1a) [Olins 74]. They showed that nucleosomes form the fundamental and repeated units of chromatin as ”beads on a string”.
Nucleosome structure
The same year, Kornberg and Thomas isolated and characterized the nucleosomes as being composed of an octamer of histone proteins around which DNA is wrapped (also called ”nucleosome core particle”, see Fig. 1.1.1b) [Kornberg 74]. Adjacent nucleosomes are separated by, on average, ~50 base pairs of linker DNA, whose length varies among species and cell types [Kornberg 77].
The structure of the nucleosome core particle comprises 147 base pairs of DNA coiled in a left-handed 1.65 turns around an octamer of histone proteins. This octamer is composed of equimolar amounts of four core histones (H3, H4, H2A and H2B) structured as follows: a central tetramer of H3:H4 heterodimers flanked by two H2A:H2B heterodimers [Luger 97].
Histone proteins
The core histones (H3, H4, H2A and H2B) are basic and relatively small pro-teins (11-15 kDa) but highly conserved in eukariotes. Electron microscopy and high-resolution cristal structures have shown a disk-shape arrangement of the core histones in the nucleosome core particle, except for their N- and C-terminal ends,
1.1 Packaging DNA
Figure 1.1.1: ”Beads on a string” structure of chromatin.
(a) Electron micrograph revealing the ”beads on a string” structure of chromatin. Nucleosomes are indicated by arrows. Scale bar is 30 nm. Reprinted from [Olins 74]. (b) Schematic representation of the elements forming the 11 nm fiber. Adapted from [Schones 08] protruding from the surface (also referred to as ”tails”). The histone tails account for 25-30% of the mass of the core histones and are largely unstructured [Luger 97]. In particular, N-terminal tails composed of ~30 amino acid residues are subject to post-translational modifications which play important roles in chromatin orga-nization as well as in the regulation of many biological processes (histone post-translational modifications are introduced in sub-section 1.2.2 and their functions in section 1.3).
Linker histones complete the nucleosome structure. They bind to the exterior of the nucleosome core particles at the entry/exit sites of DNA, but their exact posi-tion is still not well defined [Hergeth 15]. This family of histone proteins is much less conserved than the core histones, they exist in multiple subtypes and they are also subject to post-translational modifications. Linker histones are known to be involved in enhancing structural stability of nucleosomes and, to a larger extent, facilitate the folding of chromatin into higher-order structures [Fan 03]. Interestingly, linker histones are also suspected to be involved in gene regulation by preventing / recruiting transcriptional activators or repressors [Kim 13].
1.1.2 Higher order of chromatin organization
Genomic DNA in eukariotic cells is packaged into chromatin and forms higher order structure to compact DNA within nucleus (see Fig. 1.1.2).
men-tionned, DNA is wound around nucleosomes to form the chromatin primary struc-ture in the appearance of ”beads on a string” (also referred as the 11 nm fiber) [Olins 74, van Holde 89]. This structure shortens DNA sevenfold compared to naked DNA.
The chromatin secondary structure is formed by interactions between nucleo-somes and is stabilized by linker histones. Under physiological conditions, chro-matin compacts into its higher folded structure and forms a superhelical fiber of 30 nm in diameter [Hansen 89]. This fiber is further folded into higher order of chromatin organization until the final mitotic chromosome structure.
Figure 1.1.2: Packaging DNA.
Size and packing ratio obtained from [Pienta 84]. Reprinted from [Felsenfeld 03]
1.2 Chromatin modifications and their machineries
Chromatin remodeling, DNA methylation and histones post-translational modifi-cations are the main contributors to the epigenetic mechanisms. In the following introductory chapter, the discussion is limited to covalent chromatin modifications, with a main focus on histone modifications.
1.2 Chromatin modifications and their machineries
1.2.1 DNA methylation
Chemical modifications of DNA bases were identified in 1948 by chromatogra-phy [Hotchkiss 48]. Cytosine methylation (5-methylcytosine) is one of the most widely studied epigenetic modification in human and is sometimes referred as the ”fifth DNA base”. Methylation of cytosine occurs principally in repetitive genomic regions and within CpG dinucleotides (Cytosine followed by Guanine separated by a phosphate group). The latter tend to group together to form regions with high density of CpG dinucleotides called CpG islands [Bird 85]. In human, CpG are rare (~1%) but about 60% of gene promoters are composed of CpG islands [Bernstein 07].
DNA methylation is mediated by DNA methyltransferases family (DNMTs). It has been established that DNMT1 is responsible for maintaining DNA methylation pattern through cellular division [Li 92]. By contrast, DNMT3a and DNMT3b are known to establish de novo methylation sites, both enzymes being highly expressed in embryonic stem cells as opposed to differentiated cells.
Methylation of cytosine was long assumed as an irreversible and stable epige-netic mark. Recent work identified a new family of enzymes referred as TET (Ten-Eleven Translocation), which are able to modify 5-methylcytosine into reac-tion intermediates leading to the removal of the methyl group from the cytosine [Tahiliani 09, Ito 11].
One functional consequence of DNA methylation is the regulation of gene ex-pression [Razin 80, Bird 02]. In general, methylated CpG islands are correlated with gene repression. Two complementary modes of action have been described: (i) the methyl group prevents the binding of transcription factors [Watt 88] and (ii) the methyl group promotes the recruitment of repressor complexes through the binding of highly conserved proteins from the MBD family (Methyl-CpG Binding Domain) [Bird 99, Sarraf 04]. DNA methylation plays an important role in main-taining genome stability, regulating the transcription as well as in the inactivation of X-chromosome in female mammals [Reik 05, Hellman 07] and in the parent-of-origin allelic imprinting [Li 93].
1.2.2 Histone post-translational modifications
A pioneering work by Allfrey in 1964 led to the identification of the first histone post-translational modification [Allfrey 64]. Since then, more than hundreds dif-ferent histone post-translational modifications grouped in at least eight classes have been reported [Kouzarides 07]. All histones are subject to post-translational modifications occuring primarily within the N-terminal tails of the core histones.
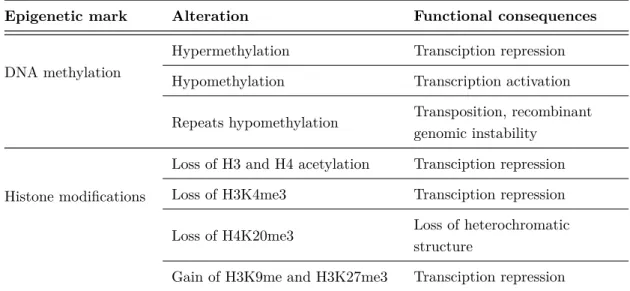
Acetylation, methylation and phosphorylation of histone tail residues are among the most widely studied histone modifications and have important roles in DNA-based biological processes (see Table 1.1 and section 1.3). A nomenclature is used to describe the large variety of histone modifications in order to unambiguously identify the histone, the modified amino acid (symbol and position) and the level of modification [Turner 05]. For example, the histone H3 trimethylated on its lysine 4 is noted H3K4me3. Here, the discussion is limited to acetylation and methylation, which have been studied in this thesis.
Modifications Residues modified Functions regulated
Acetylation K-ac Transcription, Repair, Replication, Condensation
Methylation K-me1, K-me2, K-me3 Transcription, Repair
Methylation R-me1, R-me2a, R-me2s Transcription
Phosphorylation S-ph, T-ph Transcription, Repair, Condensation
Ubiquitylation K-ub Transcription, Repair
Sumoylation K-su Transcription
ADP ribosylation E-ar Transcription
Deimination R > Cit Transcription
Proline isomerization P-cis > P-trans Transcription
Table 1.1: Classes of histone modifications. Reprinted from [Kouzarides 07]
Histone-modifying enzymes
Histone post-translational modifications are mediated by enzymes that are well characterized in the literature. Additions of modification are catalyzed by histone-modifying enzymes also referred to as writers. Chromatin marks being dynamic and reversible, erasers enzymes have been identified to catalyze the removal of histone modifications.
Writers
Acetylation has long been considered as a hallmark of transcriptionally active chromatin but the direct link was only established with the identification of the first Histone AcetylTransferases (HATs) in 1996 [Brownell 96b]. The acetylation
1.2 Chromatin modifications and their machineries involves the transfer of an acetyl group from the cofactor Acetyl-CoA to the lysine residues (K) of histone amino tails [Allfrey 64]. Since then, numerous HATs en-zymes have been identified and they are now classified with respect to their cellular localization and substrate specificity. Type-A HATs are localized in the nucleus and catalyze the acetylation of nucleosomal histones in the context of transcription regulation. Conversely, Type-B HATs are localized in the cytoplasm and catalize the acetylation of newly synthesized histones but don’t acetylate nucleosomal sub-strates already deposited into chromatin [Brownell 96a].
Histone methylation mainly occurs on lysine (K) and arginine (R) residues of histone amino-tails. Lysine residues may be mono-, di- or trimethylated whereas arginine residues may be mono- and dimethylated in a symmetric or asymmet-ric configuration [Bedford 09, Ng 09]. The first histone lysine methyltransferase (KMT) identified in 2002 targets H3K9 [Rea 00] but numerous KMTs have been identified so far. Almost all of them contain the so-called SET domain, a highly evolutionary conserved domain of ~120 amino acid residues, catalyzing the trans-fer of a methyl group from the cofactor S-adenosylmethionine (SAM) to the lysine residues (K) of histone amino tails [Tschiersch 94, Bannister 11]. Interestingly, the lysine position and the level of methylation have different impact on the regulation of the gene expression: methylation of H3K4 and H3K36 is generally associated with gene activation, whereas methylation of H3K9, H3K27 and H4K20 are com-mon sites for gene repression [Bernstein 07, Barski 07]. Methylation of arginine residues is catalyzed by enzymes belonging to the Protein Arginine MethylTrans-ferases family (PRMTs). Like the methylation of lysine, the arginine position and the level of methylation have different impact on the regulation of the gene expression: H4R3me2a, H3R2me2s, H3R17me2a and H3R26me2a are associated with gene activation, whereas H3R2me2a, H3R8me2a, H3R8me2s and H4R3me2s are associated with gene repression [Bedford 09, Blanc 17].
Erasers
Soon after the identification of HATs enzymes, Histone DeACetylases (HDACs) were reported in the literature. As expected, their activity was related to tran-scriptional repression [Taunton 96]. There are four classes of HDACs based on their function and homology with previously identified deacetylase complexes in yeast [Holbert 05].
For many years, erasers of methylated histones were not known and this modifi-cation was considered stable and static. A first class of lysine demethylase (Lysine-Specific Demethylase LSD) was identified but their mechanism of demethylation was only compatible with mono- and dimethylated lysines [Shi 04]. Soon after,
a second important class of demethylases was discovered, having certain enzymes capable of demethylating trimethylated lysines. The latter possess all a highly conserved catalytic Jumonji domain [Tsukada 06].
1.3 Functional consequences of histone
modifications
Two major modes of action have been described to explain the functional con-sequences of histone post-translational modifications: (i) histone modifications influence the overall structure of the chromatin and organize chromatin environ-ments, and (ii) histone modifications promote and stabilize the binding of chro-matin factors (also referred to as ”readers”) and orchestrate DNA-based biological processes.
1.3.1 Establishing global chromatin environments
From a chromatin structure point of view, eukariotic genomes can be roughly di-vided into two conformation states: euchromatin and heterochromatin. At the cytological level, euchromatin is only condensed during mitosis, whereas hete-rochromatin remains condensed throughout the cell cycle. Both regions have also been characterized at the molecular level: euchromatin is relatively relaxed and comprises most of the active portion of the genome. Conversely, because of its condensed organization, the heterochromatin is less accessible to the transcription machinery and therefore considered inactive.
Heterochromatin
Heterochromatin can be in turn divided into two distinct environments referred to as constitutive heterochromatin and facultative heterochromatin.
The first one defines genomic regions such as telomeres or centromeres and contains permanently silenced genes. For example, constitutive heterochromatin has been characterized by high level of trimethylated H3K9 and Heterochromatin Protein 1 (HP1) [Li 07].
On the other hand, facultative heterochromatin is constituted of genes that are expressed during the development and cellular differentiation and which then become silenced. The best example illustrating facultative heterochromatin is the inactivation of the chromosome in female mammals. The inactivated X-chromosome has been characterized by high level of H3K27me3 and Polycomb-group proteins (PcG). Polycomb repressive complex 2 (PRC2) can methylate H3K27 through its catalytic subunit EZH2 domain. Interestingly, H3K27me3 also
1.3 Functional consequences of histone modifications mediate PRC2 recruitment during DNA replication, thus maintaining facultative heterochromatin and contributing to the inheritance of chromatin modifications [Hansen 08].
Euchromatin
Euchromatin represents the majority of the genome regions (e.g. ~92% of the hu-man genome). Euchromatin is much more relaxed than heterochromatin so DNA has flexibility in the biological output (e.g. active or repressive gene expression). Transcriptionally active euchromatin has been characterized with high levels of acetylation and methylation at H3K4, H3K36 and H3K79. Conversely, inactive euchromatin has been characterized with low level of acetylation and methylation. However, it is important to note that one histone modification is not necessary specific to one chromatin state. For example, the entire body of an active gene is highly enriched in trimethylated H3K36, whereas H3K36me3 enrichment at the promoter is a common feature among repressed genes. A similar observation was made for methylation at H3K9 [Vakoc 05].
Histone modifications promote local and global structural perturbations Interactions between adjacent nucleosomes or between histones and DNA may be altered by histone modifications.
Acetylation of the lysine residues reduces the positive charge of the histones, which ”unfolds” chromatin and results in a less compact structure accessible for binding of transcription factors. Particularly, numerous lysine residues have the potential to be acetylated (e.g. H3K9, H3K14, H3K18, H4K5, H4K8, H4K12...), suggesting important effects on chromatin structure. Enhancers and promoters of active genes are hyper-acetylated, indicating again that acetylation facilitates accessibility [Wang 08]. This is difficult to observe in-vivo but, for example, it has been shown in-vitro that acetylation of H4K16 prevents the formation of the 30 nm fiber and higher order of chromatin organization [Shogren-Knaak 06]. Conversely, hypoacetylation leads to a more compact chromatin structure, thus reducing the DNA accessibility for transcription factors [Strahl 00].
Histone phosphorylation may also affect chromatin compaction by charge changes. There are fewer potential sites for phosphorylation compared to acetylation, but for example it has been established that genome-wide phosphorylation of H3S10 promotes chromatin condensation during mitosis [Wei 98].
1.3.2 Regulation of DNA-based processes
Histone modifications are involved in various DNA-based processes by serving as recognition sites for effector proteins capable of reading information and by sta-bilizing their binding to the chromatin. Numerous evolutionary highly conserved proteins (”readers”) have been identified and characterized to specifically interact with modified histones.
Bromodomain proteins recognized specifically acetylated lysines and such motif is mainly found in HATs and chromatin remodeling complexes [Hassan 02].
On the other hand, methylated lysines are bound by chromodomain proteins which can be associated with either active and repressive chromatin states. For example, ATP-dependent remodeling proteins from the Chromo Helicase DNA binding family (CHD) have been found to recruit transcription activating com-plexes through its binding to methylated H3K4 [Pray-Grant 05]. Conversely, chro-modomains are also linked to inactive gene expression. For example, transcription repression and condensed chromatin structure are associated with high levels of H3K27me3 and di-, trimethylated H3K9. The latter histone modifications are bound by Polycomb Group proteins (PcG) and Heterochromatin Protein 1 (HP1) respectively, which mediate the maintenance of the overall structure of heterochro-matin [Lachner 01, Cao 02].
1.3.3 Histone modifications interactions
As discussed in section 1.2.2, the large abundance of histone modifications enables a tight control of chromatin structure and a great flexibility in the regulation of DNA-based processes. However, this diversity leads to crosstalk between histones that can be modified at different sites simultaneously. Histone modifications can positively or negatively affect each other (Fig. 1.3.1). In addition, communication between histone modifications also exists with other chromatin modifications such as DNA methylation, which all participate to fine-tune the overall regulation of the biological functions (Fig. 1.3.2) [Du 15].
Histone modifications crosstalk
Histones can be modified at different sites simultaneously. Communications be-tween histone modifications may occur at different level: among different histones, among different tails of the same histone, among the same histone tail or even among the same site [Wang 08]. A set of positive and negative relations between modifications among the same histone is depicted in Fig. 1.3.1.
1.3 Functional consequences of histone modifications
Figure 1.3.1: Histone modifications interactions.
Histone modifications can influence each other in a positive (arrow-head) or negative (flat (arrow-head) effect. Reprinted from [Bannister 11] might be impacted by adjacent modifications: for example phosphorylated H3S10 disturb the binding of HP1 to methylated H3K9 [Fischle 05], but on the other hand, enhance the recognition of H3 lysines by acetyltransferases [Clements 03]. An antagonistic competition might also occur if mutually exclusive modifications target the same site. The best example is the lysine residue, which might be acetylated, methylated, ubiquitylated or even sumoylated [Kouzarides 07].
Interplay between histone modifications and DNA methylation
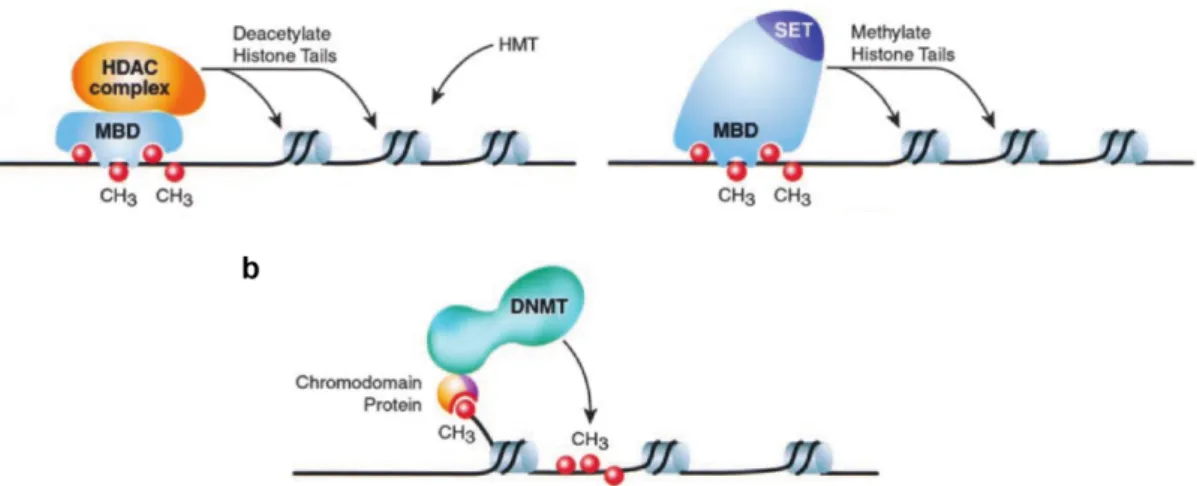
Histone modifications are not only influencing each other, they may also cooperate with DNA methylation. Examples of interplay between DNA methylation and histone modifications are shown in Fig. 1.3.2.
As previously discussed in sub-section 1.2.1, DNA methylation correlates with gene repression. Methylated CpG dinucleotides can recruit MBD proteins (e.g. MeCP2), which in turn recruit histone deacetylase complexes (HDACs), result-ing in chromatin remodelresult-ing and potential methylation of H3K9 by histone lysine methyltransferases [Nan 98]. An alternative pathway for direct methylation of H3K9 involving a lysine methyltransferase associated with MeCP2 was also de-scribed in the literature [Fuks 03] (Fig. 1.3.2a). On the other hand, histone modifications can direct DNA methylation. For instance, chromodomain proteins can bind to methylated H3K9 and mediate DNA methylation through DNMTs recruitment (Fig. 1.3.2b).
Figure 1.3.2: Interplay between DNA methylation and histone modifica-tions.
(a) Proteins from the MBD family may recruit HDACs complexes to deactylate histones and indirectly favor histone methylation via HMTs. Alternatively, HMTs containing a MBD domain may also di-rectly methylate histone tails. (b) Methylated histones may recruit DNMTs via a chromodomain protein to methylate DNA.
MBD: Methyl-CpG Binding Domain protein family; HDAC: Histone DeACetylase; HMT: Histone MethylTransferase; SET: catalytic do-main involves in histone methylation; DNMT: DNa MethylTrans-ferase. Adapted from [Zhang 01]
methylation suggest that one single chromatin modification doesn’t act on its own, but a combination of modifications may function cooperatively to regulate cellular biological functions.
1.4 Defining cell identity based on histone
modifications
1.4.1 Genome-wide mapping of histone modifications
Analysis of histone modifications mainly relies on Chromatin ImmunoPrecipitation technique (ChIP), in which an antibody is used to enrich genomic regions carrying a specific histone modification.
Originally, the presence or absence of a pre-defined regions in the immunoprecipi-tated DNA was determined by Polymerase Chain Reaction (PCR) but such studies were limited in the number of loci interrogated. The method rapidly evolved by
1.4 Defining cell identity based on histone modifications combining chromatin immunoprecipitation with DNA microarrays to profile chro-matin modifications over large genomic regions (ChIP-chip). However this tech-nique suffered from amplification bias and cross-hybridization. The emergence of sequencing technologies (and later Next-Generation Sequencing) contributed to the development of the Chromatin ImmunoPrecipitation followed by sequencing technique (ChIP-seq). ChIP-seq overcomes previous limitations as fewer amplifica-tion of immunoprecipitated DNA is required for sequencing and sequencing reads are directly aligned to the genome to create chromatin-state maps [Mikkelsen 07]. ChIP-seq is still considered today as the gold standard method for genome-wide analysis of histone modifications.
Chromatin ImmunoPrecipitation followed by sequencing (ChIP-seq)
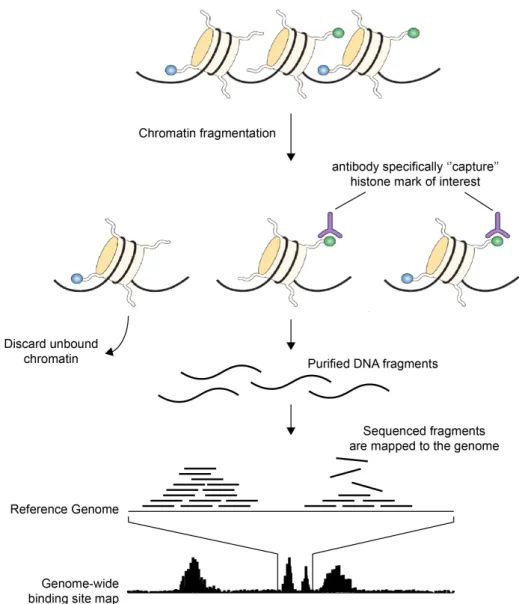
Briefly, chromatin is fragmented by microccocal nuclease (MNase). This enzyme is particularly adapted as it preferentially cuts linker DNA, generating principally mono-nucleosomes under optimized conditions. The fragmented chromatin is im-munoprecipitated with an antibody specific for the histone mark of interest. Un-bound chromatin is discarded, whereas immunoprecipitated DNA is purified and amplified before sequencing. The sequenced fragments are aligned to the refer-ence genome and yield genome-wide binding site maps. The number of sequencing reads detected at a genomic region correlates with the modification level of the region (see Fig. 1.4.1).
Alternatively, the enzymatic fragmentation of chromatin may be replaced by mechanical fragmentation (e.g. sonication). In this latter approach, chromatin is first crosslinked with formaldehyde and then sonicated. This second method offers the possibility to profile not only histone modifications but more generally DNA binding proteins and chromatin-modifying proteins. However, the crosslink-ing step may disrupt the target epitope, thus reduccrosslink-ing the immunoprecipitation efficiency.
The resolution of ChIP-seq is directly linked to the size of the chromatin frag-ments, as well as the sequencing depth. The optimization of chromatin digestion conditions is essential to ensure that most of the sequenced fragments originate from a single nucleosome [Barski 07].
Constraints of chromatin immunoprecipitation methods
Several constraints are inherent to the ChIP method and should be kept in mind before any experiments [Kidder 11].
• Highly specific antibodies are essentials to generate good quality results. Only well-characterized antibodies must be used to ensure high specificity
and good sensitivity to the target epitope.
• Different method of chromatin fragmentation might lead to different results. Both mechanical and enzymatic fragmentation introduce specific bias such as fragment length or selective digestion. In addition, the number of cells, the fixation conditions, the type of sonicator and sonicator settings are also source of variation in ChIP-seq results. Therefore, technical and biological replicates as well as input control (fraction of DNA not immunoprecipitated) are valuable to generate reliable data.
• ChIP-seq was requiring large number of cells (106 to 108 cells per
experi-ment), thus limiting the use of the technology to rare samples. Considerable efforts have been made recently to reduce the number of starting cells from millions down to tens cells [Ma 18]. However, the chromatin profiles obtained remain an average snapshot of the modification status, which could contain contributions from very heterogeneous modifications states of different cells.
1.4 Defining cell identity based on histone modifications
Figure 1.4.1: Genome-wide mapping of histone modifications by Chro-matin ImmunoPrecipitation followed by sequencing (ChIP-seq).
Chromatin is fragmented to generate preferentially mono-nucleosomes. Nucleosomes bearing a histone modification of interest are ”captured” by immunoprecipitation using an antibody that is specific to this particular modification. DNA fragments wound around those histones are purified, amplified and sequenced. Sequenced DNA fragments are mapped to the reference genome to generate genome-wide binding site maps in which peaks correlate with regions carrying the target modification. Adapted from [Schones 08]
1.4.2 Epigenomic signatures define cell-type identity
Systematic genome-wide mapping of histone modifications (also referred to as epigenomic profiling) have revealed reproducible patterns in their distribution, allowing predictions to be made about transcriptionally active or repressive chro-matin states (see Fig. 1.4.2) [Bernstein 05, Barski 07, Ram 11].
Figure 1.4.2: Chromatin states define cell identity
Active chromatin states are associated with high level of H3K4me3 in promoter regions and H3K27ac in enhancer regions. CpG islands are demethylated. Conversely, repressive chromatin states are associated with high level of H3K27me3 and H3K9me3. CpGs are methylated. Histone-modifying enzymes (HATs: Histone AcetylTransferases; HDAC: Histone DeACetylase; KMTs: Lysine MethylTransferase; LSD: Lysine Specific Demethylase; KDMs: Lysine DeMethylase containing Jumonji catalytic domain); DNMTs: DNa Methyl-Transferases; TETs: Ten-Eleven Translocation. Adapted from [Flavahan 17]
A core set of histone modifications has been attributed to specific genomic reg-ulatory elements and chromatin domains. Active chromatin states are associated with high level of H3K4me3 in promoters, H3K4me1 and H3K27ac in enhancers
1.4 Defining cell identity based on histone modifications and H3K36me3 in the body of transcribed genes. Conversely, transcriptionally in-active chromatin state including heterochromatin regions, have been characterized with high levels of H3K27me3 and HK9me3 [Epigenomics 15].
These histone modifications contribute to the definition of epigenomic signa-tures within distinct chromatin states, which are highly indicative of cell type and tissue identity. The genome-wide profiling of these marks can be leveraged to understand the global landscape of genome regulation and then, for example, distinguish epigenomic differences in the context of normal and disease cell states [Epigenomics 15]. However the current state of the chromatin profiling technolo-gies doesn’t allow studying cellular heterogeneity nor detect cell-to-cell variation in chromatin states.
Chapter 2
Droplet-based microfluidics for
single-cell epigenomic profiling
Cellular heterogeneity is a universal property of multicellular organisms, which contain diverse cell types originally classified on the basis of their phenotypic char-acteristics (location in the organism, morphology...). The definition of these cell types has started to evolve with the investigation of molecular characteristics (such as DNA, RNA, proteins, metabolites) but bulk analyses of tissues and cell popu-lations only represent an average snapshot of the cellular components.
Recently, advances in cellular profiling has enabled the characterisation of the molecular heterogeneity at single-cell resolution, revealing a large diversity of cell ”states” among similar phenotypes. Single-cell RNA-seq is at the forefront on the development of single-cell methods and provides in-depth analysis of gene expression profiles. However, quantifying gene expression in individual cells is challenging and limited by technical issues (e.g. capture and amplification of low amount of mRNA) as well as the stochasticity inherent in biological processes [Elowitz 02, Li 11a].
In order to reduce the impact of the noise present in single-cell measurements, two strategies have driven the technological development: (i) the increase of the number of variables measured, and (ii) the increase of the number of cells profiled [Prakadan 17]. The first strategy relies on the intuitive idea that the expression of a single gene might not be reliable of a cell state, but the co-variation of a set of genes is less impacted by noise. Similarly, increasing the number of cells contributes to a more effective characterisation of cell subpopulations that compose the sample. An illustration of the dramatic increase over the last decade in the number of cells profiled per single-cell RNA-seq experiment is shown in Fig. 2.0.1 (for review
[Angerer 17, Svensson 18]).
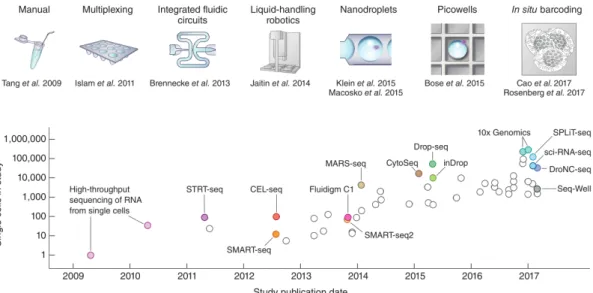
Figure 2.0.1: Evolution of the number of cells profiled in single-cell RNA-seq experiments.
Sequencing the whole transcriptome of one single-cell was first de-scribed by Tang et al in 2009 [Tang 09]. The number of cells assayed increased to ~100 with sample multiplexing, ~1,000 with the devel-opment of robotics and ~10,000 with the use of microfluidic devices. Recently, combinatorial in-situ barcoding methods have been devel-oped to simultaneously process ~100,000 single-cells. Reprinted from [Svensson 18]
Tang et al sequenced for the first time in 2009 the whole transcriptome of a sin-gle cell [Tang 09]. In the following years, the method has been adapted on plate to allow multiplexing and sequencing of hundreds cells [Islam 11] and thousands cells with the use of robotics [Jaitin 14]. The development of microfluidic devices al-lowed a jump in throughput from hundreds [Brennecke 13] to thousands [Klein 15] and tens of thousands cells [Macosko 15, Bose 15]. Recently, combinatorial in-situ barcoding methods have been used to profiled hundred of thousands cells in par-allel, opening doors for large scale studies [Cao 17, Rosenberg 18].
In this introductory chapter the scope of the discussion is limited to microfluidic systems with a focus on the droplets format as a method of choice to profile molecular states at single-cell resolution.
2.1 Scaling by shrinking
2.1 Scaling by shrinking
Opportunities offered by the microfluidic systems for single-cell analysis Microfluidics is by definition the study of flows in micrometric systems [Tabeling 05]. The manipulation of liquid at the micrometric scale is of great interest in biology and offers the following advantages:
• Volumes: reduction by 106-fold compared to conventional assays in tubes
(from milliliters to picoliters). Such volumes are on the same scale as indi-vidual mammalian cells.
• Compartmentalization: objects can be confined and isolated from each other in micrometric compartments. In the case of single-cell analysis, cells are captured, lysed and their components retained in the compartment for fur-ther processing.
• High-throughput: reduction in volume allows a massive increase in the num-ber of experiments performed in parallel as illustrated in Fig. 2.0.1.
• Cost-efficiency: reduction of reagents, consumables and time [Agresti 10] • Sensitivity: detection of small amount of analytes is enhanced due to their
high concentration in small volume [Najah 12]
Microfluidic confinement strategies for single-cell analysis
Three main types of microfluidic devices have been developed to isolate objects and are used for single-cell analysis purposes: (i) valve-based microfluidic devices, (ii) nano- and picowells and (iii) droplet-based microfluidic devices (see Fig. 2.1.1, for review [Prakadan 17]).
Valve-based microfluidic devices are the first major method developed and prob-ably the most sophisticated. Microfluidic channels are coupled with pressure-controlled valves (see Fig. 2.1.1a; for review on operation of valve-based microflu-idics [Unger 00, Thorsen 02, Hong 03]). Opening and closing of valves create walls and isolate objects in nanoliter chambers. The channels and valves can be arrayed and controlled simultaneously on microfluidic devices allowing a broad range of operations such as adding and mixing reagents, incubation... [Fan 11]. The main limitations are the throughput (hundred of cells in parallel) and the complex de-sign/fabrication of the devices.
Figure 2.1.1: Microfluidic confinement strategies for single-cell analysis. (a) In valve-based microfluidics single-cells can be trapped by apply-ing a pressure on channels perpendicular to the flow channel. The pressure applied deforms the channels and creates reversible ”walls” that confine single-cells in microfluidic chambers. (b) Cells can be iso-lated into nanoliter or picoliter wells by gravity, which can be sealed with a glass slide. (c) Droplet-based microfluidics consist in isolating single-cells in small aqueous droplets dispersed in a continuous oil phase. Adapted from [Prakadan 17]
Arrays of tens of thousands microfabricated wells are a much simpler method to isolate single-cells than valve-based microfluidic systems, whose wells volume can range from nanoliter [Love 06, Gierahn 17] to picoliter [Bose 15] (see Fig. 2.1.1b). Cells can be simply loaded into the wells by gravity, but must be diluted to avoid multiple cells into the same well (see section 2.2.3 for loading occupancy and Pois-son statistics). As a result, the number of cells processed in parallel can be scaled up to ten thousands [Bose 15]. In addition to the simplicity, one major advantage is the fixed spatial location of each well allowing multiplexed measurements and kinetic studies.
Alternatively, individual cells can be isolated in small aqueous droplets dispersed in a continuous oil phase (Fig. 2.1.1c). Droplets, whose volume span from nano-liters to femtonano-liters (10-9to 10-15litres), are stabilized by a surfactant and function
as independent biocompatible microreactor. Droplet-based microfluidics have been utilized in this thesis, the opportunities and constraints offered by the droplets and their utility in single-cell analysis are discussed in the following sections.
2.2 Droplet-based microfluidics
2.2 Droplet-based microfluidics
Droplet-based microfluidics is a domain of microfluidics, in which aqueous droplets dispersed in a continuous oil phase are used as independent microreactor (sub-section 2.2.1). On-chip microfluidic modules allow droplets generation and ma-nipulation at kHz frequencies and throughput can easily reach millions of drops per hour (sub-section 2.2.2). Droplet microfluidics have been used in a broad range of applications such as the high-throughput phenotypic screening of viruses [Chaipan 17], bacteria [Baret 09], yeast [Agresti 10, Beneyton 17], filamentous fungi [Beneyton 16] and mammalian cells [Clausell-Tormos 08], allowing for ex-ample highly efficient directed evolution [Agresti 10, Obexer 17] or the study of immune response dynamics at the single-cell level [Eyer 17]. Recently, droplet-based microfluidic systems combined with DNA barcoding and Next-Generation Sequencing (NGS) have enabled high-throughput single-cell genomics, transcrip-tomics and epigenomics analysis (discussed in section 2.3 of this introductory Chapter).
2.2.1 Key features of droplet-based microfluidics
Quantitative measurementAn important feature of droplet-based microfluidics is the generation of highly monodisperse droplets [Thorsen 01]. The initial concentration of each reagent is similar between droplets and a slight variation can be directly related to the ac-tivity of the encapsulated compounds. For this purpose, fluorophores are available and can be used in microfluidic workflows. For example, fluorogenic substrates are used in enzymatic reactions to measure the catalytic activity of an enzyme as a fluorescence readout. Production and analysis of droplets are generally operated on dedicated microfluidic instruments: each droplet is scanned by a laser beam as they pass in front of a detection point and the fluorescence signals are analysed in real-time [Mazutis 13].
Biocompatibility
Micro-fabrication techniques, such as soft-lithography [Xia 98], contributed to the development of prototype microfluidic device. Those microfluidic chips are easily made of polydimethylsiloxane (PDMS) with micrometric channels imprinted and bound on glass slides. PDMS is a material of choice for producing microfluidic chip as it is inexpensive, optically transparent, gas permeable and importantly, inert to chemical and biological reactions. In addition, oil and water can be injected in the PDMS chips to generate droplets by the shearing of the aqueous phase by the
oil phase [Anna 03].
The continuous oil phase is generally composed of perfluorinated oils which have the advantage to be hydrophobic, lipophobic and inert to biochemical reactions. Those properties are particularly important in droplet-based microfluidics as the solubility of organic molecules is reduced, thus retaining biological compounds in-side the droplets. In addition, the high gas solubility in perfluorinated oils enables cellular respiration in droplets [Lowe 98, Mahler 15].
Finally, aqueous droplets are stable after production only if they are stabilized by a surfactant (lowering interfacial tension at the surface of the droplets). Sur-factants are organic compounds that are amphiphilic, meaning that they contain both a hydrophilic group (head) and a hydrophobic group (tail). For this purpose, biocompatible surfactants composed of fluorophile perfluoro-tails coupled to hy-drophyilic PEG head groups have been developed which enable for example the thermocycling of emulsions while preserving droplets integrity [Hindson 11]. High-throughput
Manipulating liquids at the micro-metric scale reduces the volume of reagents per assay. Droplet-based microfluidics outperform the other categories of microfluidic systems presented in 2.1 with respect to throughput. The frequency of the droplets production and analysis depends on the channels geometry and flow conditions, but a range from 0.1 to 30 kHz has been reported in the literature [Sciambi 15].
2.2.2 Manipulating droplets
Microfluidic devices allow the high-throughput generation of highly monodisperse aqueous droplets. Those droplets can be manipulated using a broad range of microfluidic modules, which can be assembled into fully integrated microfluidic chips (examples of microfluidic modules for manipulating droplets are shown in Fig. 2.2.1).
• Emulsions are made of an aqueous phase dispersed in an oil continuous phase and stabilized by a surfactant. Droplets volume span from nano-liter [Zilionis 17] to femtonano-liter [Leman 15] and can be produced using dif-ferent channel designs and geometries [Thorsen 01, Anna 03, Cramer 04, Abate 09a, Li 11b, Li 15].
• Aqueous phases mix rapidly inside droplets by diffusion but microfluidic modules can be added to speed up the mixing of two or more phases [Tice 03, Bo Zheng 04].
2.2 Droplet-based microfluidics • Droplet populations can be merged passively [Tan 04, Niu 08], or actively us-ing a triggered electric field [Mazutis 09b, Niu 09, Zagnoni 09a, Zagnoni 09b]. • Droplets can be incubated on-chip as a single-file in delay lines (seconds), while preserving droplet order [Frenz 09]. Droplets can also be incubated for longer time (minutes) or in stationary chambers but in this case droplets order is not maintained [Courtois 08].
• Droplets fluorescence can be detected and measured in real-time as the droplets passed a laser beam. [Baret 09].
• Droplets of interest can be sorted out based on their physical properties in passive hydrodynamic selection [Chabert 08, Mazutis 09c]. Also, droplets can be actively sorted using external forces such as dielectric forces [Ahn 06, Sciambi 15] or acoustic waves [Franke 09].
• Droplets can be splitted symmetrically or asymmetrically in different ratios depending on the microfluidic channels geometry [Link 04, Abate 11]. Active splitting using a triggered electric field can also be used to divide droplets into smaller ones [Link 06].
• Droplets can be collected and incubated off-chip before being re-injected into a dedicated microfluidic device [Mazutis 09a].
The microfluidic modules illustrated in Fig. 2.2.1 are examples of high-throughput operations that can be performed in droplet-based microfluidics. It is tempting to combine these modules on integrated workflows and, for example, simultaneously generate droplets, measure their fluorescence, and sort the droplets that display the desired properties. However, the hydrodynamic resistance is inversely propor-tional to the volume of a rectangular microfluidic channel [Fuerstman 07]. Also, multiplying the number of microfluidic modules on the same device increases the hydrodynamic resistance and can make the device difficult to control.
Complex microfluidic workflows are usually performed using different microflu-idic devices. However, emulsions are fragile and manipulating droplets in several microfluidic chips implies the collection and re-injection of the droplets, which can potentially induce coalescence. As a result, droplets might not be monodisperse which is problematic to precisely control the droplets inside the channels but also to compare them as identical independent microreactor. Again, the number of microfluidic operations that can be performed sequentially is limited.
Figure 2.2.1: Examples of microfluidic modules for manipulating droplets. (a) droplet generation, (b) mixing two aqueous phases in droplets after generation, (c) active fusion between two droplets by electroco-alescence, (d) incubating droplets (seconds) without loosing droplets order, (e) incubating droplets (minutes to hours) or stationary stor-age, (f) measurement of droplet fluorescence, (g) fluorescence acti-vated droplet sorting, (h) re-injection of droplets, (i) passive droplet splitting, and (j) off-chip incubation of droplets. Reprinted from
2.3 Single-cell -omics in droplets
2.2.3 Predicting cell compartmentalization
Compartmentalization of non-interacting discrete objects in droplets follows a Poisson distribution [Shapiro 03], which describes the probability of finding a mean number ⁄ of x objects per droplet (Fig. 2.2.2). The random encapsulation of cells requires diluting the samples to ensure at most one cell per droplet, resulting in a large majority of empty droplets [Köster 08, Clausell-Tormos 08, Huebner 08]. With a mean number of cell per droplet in the range of ⁄ = 0.1 - 0.3, 90% to 74% of the droplets are empty. Some microfluidic devices were also developed to re-duce the impact of the Poisson distribution, for example by sorting out empty droplets or ordering the cells in the microfluidic channel before encapsulation [Edd 08, Collins 15].
Figure 2.2.2: Predicting the number of cells per droplets. Distribution of the number of cells per droplets for different ⁄ values. Reprinted from [Mazutis 13]
2.3 Single-cell -omics in droplets
2.3.1 Droplets barcoding
Why barcoding?
Barcoding refers to the need of multiplexing and analyzing multiple cells at once. RNA or DNA are present in minute amount in single cell and such quantities are by
far too low to be sequenced without prior amplification [Tang 09]. Adaptors were used to capture and drive amplification of nucleic acids from individual cell but they rapidly evolved to incorporate unique sequence specific to each cell isolated in well plates [Islam 11, Hashimshony 12, Jaitin 14]. With the emergence of high-throughput techniques such as the random encapsulation of cells in droplets, larger barcode libraries were needed to avoid the barcoding of two distinct cells with the same sequence.
General barcoding constraints
The barcoding strategy should be carefully designed to fullfil requirements and specificity of each application, notably in terms of number of cells multiplexed per assay. Two major methods have been described to generate large barcode li-braries for single-cell analysis in droplets: (i) the combination of multiple barcode sequences and (ii) the synthesis of random barcode sequences [Svensson 18].
Combinatorial synthesis method was first described for the solid-phase synthesis of peptides in 1963 and immediately adopted to generate quickly large number of compounds [Merrifield 63]. This approach was adapted to measure gene expres-sion of thousands single hematopoietic cells in a microwell array in which beads functionalized with oligonucleotide primers for mRNA capture were loaded in each well [Fan 15]. The oligonucleotide primers comprised a DNA barcode generated by combinatorial split-pool synthesis method. Briefly, beads were distributed into a 96-well plate with each well containing a different short DNA barcode that is added by ligation to the beads. The beads were then pooled and splitted again in a second 96-well plate. By repeating this split-pool three times, a library of 963
combinations is created (884,736 possible barcodes).
Similarly, Klein et al developed the InDrop method [Klein 15] by using hydrogel beads grafted with barcoded primers generated with 2 rounds of split-pool from 384-well plates. The diversity of the barcode library is reduced by a factor 6 resulting in 147,456 combinations. The authors estimated the maximum number of cells that can be sequenced to limit to 1% the probability of having 2 cells with the same barcode. They presented the problem as analogous to the ”birthday paradox”, with the total number of barcodes assimilated to the days of the year and the number of cells assimilated to the group of persons. In other words, the problem is to sample, without replacement, n elements among N. They defined the number of observed barcodes nobs when sampling n elements by the following relation:
2.3 Single-cell -omics in droplets Considering that the barcoding error is the fraction of cells with the same bar-code:
error ¥ 1 ≠ nobs n
In practice, the number of encapsulated cells is much smaller than the total number of barcode combinations (n << N). The equation can be simplified:
error¥ 2Nn (2.3.1)
Applying the equation (2.3.1) to limit to 1% the probability of having 2 cells with the same barcode:
ncells = 0.01 x 2 x 3842 = 2, 949 cells
Increasing the length of the barcode or the number of split-pool cycles would automatically increase the number of cells than can be multiplexed. Alternatively, a second method consisting of split-pool single-based DNA synthesis on beads has been used to dramatically increase the diversity of the barcode library (12 split-pool rounds generating 412 ~16.7 million combinations). Such method has been
reported in Drop-seq [Macosko 15] to explore mouse retinal tissues and identify ~40 transcriptionally distinct cell populations from ~44k cells.
How delivering barcodes in droplets?
In Drop-seq [Macosko 15] and InDrop [Klein 15] methods, barcodes are delivered in droplets by co-encapsulation of cells and barcoded beads. However, in Drop-seq, barcoded beads are small microparticles that follow a distinct Poisson distribution compared to the cells. As a result, the probability to find both one cell and one bead in the same droplet is defined by the product of the probability of finding one cell and the probability of finding one bead. Considering a typical mean number of cell per droplet of ⁄ = 0.3 (22.2% of single cell), the mean number of bead should also be ⁄ = 0.3 to ensure at most one bead per droplet (22.2% of single bead), resulting in only ~5% of droplets containing both one cell and one bead. The majority of the cells (~4/5) won’t be co-encapsulated with a barcoded bead, leading to important loss of information which might be an issue when processing limited cell numbers.
Klein et al used hydrogel beads instead of solid microparticles in InDrop method. Hydrogel beads have the particularity to be deformable [Kim 07] and can be closely packed in a single-file as they approach the droplet generation junction. By syn-chronizing the regular flow of hydrogel beads with the periodicity of the droplets
formation, Abate et al demonstrated nearly 100% hydrogel droplet occupancy [Abate 09b]. As droplets must contain one cell and one bead to produce a se-quencing library, Klein et al limited cell loss with the use of those hydrogel beads. In other applications requiring enzymatic DNA digestion such as in single-cell epigenomics studies, barcodes can’t be loaded directly with the cells in droplets and as to be delivered a posteriori. For this purpose, alternative strategies have been developed. Droplet-based libraries of oligonucleotide barcodes have been first described by Rotem et al for single-cell RNA-seq [Rotem 15b] and later adapted for single-cell ChIP-seq [Rotem 15a]. Oligonucleotides are directly emulsified from 2 x 384-well plates and collected through a single output. The barcode-containing droplets are then fused with cell-containing droplets. The low complexity of the barcode library (1,152 possible barcode combinations) limits the collection of ~100 cells to ensure 95% of the barcodes are unique to a single-cell. This issue can be mitigated by collecting multiple samples and adding a second sample-specific barcode during sequencing library preparation.
To overcome this limitation, single-molecule amplification in droplets [Zhang 12] has been used to generate droplet-based libraries of barcodes [Lan 16, Lan 17]. The barcodes are generated by diluting oligonucleotides in accordance with Poisson statistics so that ~1 in 10 droplets contains a single molecule. Oligonucleotides are encapsulated with PCR reagents in droplets for amplification and generating a clonal population of the single molecule. This method is efficient to generate large libraries of million combinations but leads to a majority of empty droplets due to the Poisson distribution as previously described.
2.3.2 State of the art in single-cell -omics using droplet-based
microfluidics workflows
Single-cell analysis is a rapidly evolving field of research and development. The flexibility of the droplets format can be leveraged to investigate different molecular layers of individual cells (and hence cell identity and function). Striking examples with respect to genomic, transcriptomic and epigenomic profiling of single cells using droplet-based workflows are discussed in this sub-section.
Interrogating genome complexity at single-cell resolution
The development of single-cell genomics in droplet microfluidics is hampered by technical challenges in isolating, purifying and amplifying genomic DNA from single-cells and by the high read coverage necessary to cover the entire genome.