HAL Id: hal-02155398
https://hal.archives-ouvertes.fr/hal-02155398
Submitted on 14 Oct 2019HAL is a multi-disciplinary open access archive for the deposit and dissemination of sci-entific research documents, whether they are pub-lished or not. The documents may come from teaching and research institutions in France or abroad, or from public or private research centers.
L’archive ouverte pluridisciplinaire HAL, est destinée au dépôt et à la diffusion de documents scientifiques de niveau recherche, publiés ou non, émanant des établissements d’enseignement et de recherche français ou étrangers, des laboratoires publics ou privés.
Comprehensive Thermodynamic Study of the Calcium
Sulfate–Water Vapor System. Part 1: Experimental
Measurements and Phase Equilibria
João G. D. Preturlan, Laetitia Vieille, Sara Quiligotti, Loïc Favergeon
To cite this version:
João G. D. Preturlan, Laetitia Vieille, Sara Quiligotti, Loïc Favergeon. Comprehensive Thermody-namic Study of the Calcium Sulfate–Water Vapor System. Part 1: Experimental Measurements and Phase Equilibria. Industrial and engineering chemistry research, American Chemical Society, 2019, 58 (22), pp.9596 à 9606. �10.1021/acs.iecr.9b00856�. �hal-02155398�
Comprehensive thermodynamic study of the calcium
sulfate-water vapor system. Part 1: Experimental
measurements and phase equilibria.
João G. D. Preturlan±,†, Laetitia Vieille±, Sara Quiligotti†, Loïc Favergeon±,*
±Mines Etienne, Univ Lyon, CNRS, UMR 5307 LGF, Centre SPIN, F - 42023
Saint-Etienne France
†Saint-Gobain Research Paris, 39 quai Lucien Lefranc, F-93000 Aubervilliers France
ABSTRACT
The calcium sulfate-water vapor system is of great scientific and technological importance due to its applications in several fields such as the construction materials industry, geology, and planetary sciences. While much effort has been consecrated during the past decades in characterizing the crystallographic structure of the different calcium sulfate polymorphs, some questions concerning their thermodynamic aspects as phase equilibria and their capability to increase their overall water content continuously beyond structural water content seem to have been left aside. Nevertheless, the comprehension of these aspects is of the utmost importance if we want to understand this chemical system fully. The present two-part work investigates these phenomena experimentally and by a thermodynamic modeling approach. In this first part, we develop a rigorous experimental protocol by thermogravimetric analysis under controlled temperature and water vapor partial pressure. We use this protocol to obtain thermodynamic equilibrium values for the overall water content of calcium sulfate hydrates. To ensure that the equilibrium was reached, we verified that these values could be obtained by distinct thermodynamic paths. With the equilibrium data, we were able to propose an updated equilibrium curve between phases AIII-CaSO% and CaSO%⋅ 0.5H+O and estimate the thermodynamic parameters Δ-H° = (35.5 ± 1.0) kJ ⋅ mol;< and Δ-S° =
(80.0 ± 2.8) J ⋅ mol;<⋅ K;<. After that, we were able to quantify the extent of water adsorption
as a function of @T, PDEFG, and we observed that it could represent a significant part of the overall
water content of calcium sulfates.
KEYWORDS
1. Introduction
The chemical system composed by calcium sulfate and water is of paramount relevance for several industrial, technological, and scientific domains. Gypsum, the mineralogical term for the material mainly constituted of calcium sulfate dihydrate (DH, CaSO%⋅ 2H+O), has extensive annual production and is mostly used in plaster (material mainly constituted of calcium sulfate hemihydrate, HH, CaSO%⋅ 0.5H+O), and cement industries.1–3 Apart from that, due to the high
abundance of calcium sulfate on Earth’s crust, calcium sulfates transformations are linked to several geological processes.4,5 Recent discoveries of calcium sulfate in Mars also inspired
research about the transformations within the CaSO%-H+O system.6–9
One recurrent area in CaSO%-H+O system research concerns the quantity of water contained by calcium sulfates obtained from the dehydration reaction of gypsum and the determination of their structural water content. A considerably large amount of work has been dedicated to these issues. Many authors wrote extensive reviews on these points as, for example, Bezou10, Freyer and
Voigt11, Christensen et al.12,13, Ballirano14, and Schmidt et al.15. Calcium sulfate dihydrate
dehydrates to hemihydrate or anhydrite (CaSO%) depending on temperature and humidity
conditions. The hemihydrate prepared by this technique is normally referred to as β-hemihydrate (β-HH). There is also another kind of hemihydrate normally obtained by hydrothermal conditions and identified as α-hemihydrate (α-HH). These forms of hemihydrate show some differences in their properties due to their microstructure, but they are considered to be chemically identical due to their similar X-ray powder diffraction pattern.1,16,17 The hemihydrate has also been reported to
increase its structural water content to form a higher hydrate of the form CaSO%⋅ 0.625H+O (0.625-H).15 Three kinds of anhydrites have been reported: soluble anhydrite (AIII-CaSO
%),
and hydrate back to hemihydrate under atmospheric conditions. AII-CaSO% is produced by placing AIII-CaSO% under temperature conditions superior to 350℃ and takes a long time to hydrate back to DH when mixed with liquid water. AI-CaSO% is less present in the literature and was reported to be stable for temperature values superior to 1180℃.18,19
However, for a long time the phases HH, AIII-CaSO% and 0.625-H were thought to belong to the
same crystalline phase, and the system was thought to be bivariant. That is, the crystalline water content of the compounds could vary continuously with temperature and water vapor pressure without any change in their crystalline system (e.g., this effect was recently observed for MgSO%
hydrates.)20 Discussions about the accuracy of this interpretation of the CaSO
%-H+O system is
found in several works as, for instance, the reviews presented by Posnjak21 or Ramsdell and
Partridge22. We can also find the works from Gardet et al.23 and Soustelle et al.24 that reported
calcium sulfate hydrates of the form CaSO%⋅ εH+O for which the water content would vary in the interval 0 ≤ ε ≤ 0.67 depending on two intensive parameters: temperature and water vapor pressure. According to their interpretation of crystallographic data, they concluded that this variation in water content would take place without any change in the crystalline phase and that the system was bivariant. Bunn25 also measured the overall water content in calcium sulfate
hydrates up to ε = 0.67. Water vapor sorption studies carried out by Gregg and Willing26 also
showed a change in water retention of calcium sulfate hydrates with temperature and relative humidity. Published works from Bezou et al.10, Christensen et al.12, Weiss and Bräu27, and Schmidt
et al.15 list a series of studies for which calcium sulfates can show water contents in the interval of
0 ≤ ε ≤ 0.8. Currently, however, after an extensive number of studies in the characterization of calcium sulfate polymorphs, the existence of at least six distinct calcium sulfate polymorphs seems to be acknowledged in the scientific literature: dihydrate (DH, CaSO%⋅ 2H+O), hemihydrate (α-
and β-HH are identical), soluble anhydrite (AIII-CaSO%), insoluble anhydrite (AII-CaSO%), anhydrite I (AI-CaSO%) and a higher hydrate “0.625-hydrate” (0.625-H, CaSO%⋅ 0.625H+O). Therefore, the structural or crystalline water content of calcium sulfate obtained from gypsum calcination can be 0, 0.5, or 0.625 mol H+O mol CaSO⁄ %.15,27–30 Moreover, the transitions between
these forms were shown to be univariant, and Bezou et al. reported thermogravimetric curves showing considerable overall water content variation in calcium sulfates (beyond the crystalline water content) caused by water vapor adsorption.29,31
Overall, we can retain that a considerable amount of effort has been dedicated to the identification of the crystallographic forms of calcium sulfate hydrates so far. As a consequence, one can find considerably reliable data regarding the nature of the crystalline phases of these compounds. On the other hand, to the authors’ knowledge, no rigorous quantitative analysis of the water vapor adsorption on calcium sulfate hydrates has yet been published to complement the current state-of-the-art knowledge of crystalline forms of calcium sulfate. The unawareness of the extent of the water adsorption phenomenon can be problematic for several applications. For example, measuring the mass of a calcium sulfate without taking into account the adsorbed water content, this could bring important errors depending on the magnitude of the adsorption phenomenon. Moreover, simple operations such as storing calcium sulfate hydrates for later use can also compromise the nature of the material if parameters such as temperature and water vapor pressure are not controlled.15,32,33
In this context, the present work aims at providing a quantitative investigation concerning the behavior of water vapor adsorption on calcium sulfates polymorphs obtained from the dehydration of synthetic and highly pure CaSO%⋅ 2H+O. For this reason, we separated the work in two parts. The first part presents an experimental technique to study water sorption by the use of isothermal
and isobaric thermogravimetric analysis. We employed this method at atmospheric pressure to verify the extent of the water adsorption phenomenon and to quantify the adsorbed water content for calcium sulfate hydrates. We also discuss the thermodynamic variance of the system and perform phase equilibrium calculation. The second part of the present study is dedicated to the thermodynamic modeling of the water adsorption phenomenon.
2. Materials and Methods
The source of calcium sulfate for this work was a synthetic calcium sulfate dihydrate powder with high purity (Sigma-Aldrich, reagent grade, purity > 99.9%). We sieved this material and retained the fraction between 20 µm- and 50 µm-mesh.
2.1. Phase and chemical composition analyses. Powder X-ray Diffraction (XRD) pattern for
the initial sample was measured in the range 5° ≤ 2θ ≤ 40° using a diffractometer (Bruker-Siemens D5000) with monochromatic Cu − KW radiation (λ = 1.5406 Å) and a scan time of 2.5 s.
The experimental diffraction pattern was compared to the calcium sulfate dihydrate pattern (JCPDS 33-0311) to verify the phase purity of the initial sample.
The elemental composition of the initial sample was also evaluated to verify the purity of the sample by Inductive Coupled Plasma Mass Spectrometry (ICP-MS, JY 138 Ultrace, ISA Jobin Yvon).
2.2. Thermogravimetric analysis (TGA) protocols. To investigate the interaction between
water vapor and calcium sulfate, we performed thermo- gravimetric analysis (TGA) experiments under isothermal and isobaric conditions. We used a high- performance symmetrical thermobalance (TAG 16, Setaram) instrumented for low-temperature experiments. We carried out the experiments under atmospheric pressure with a constant flowing mixture of dry Helium and
water vapor (50 cm3/min). The thermobalance has two parallel furnaces in which we place at the
same time and under the same conditions one empty crucible (reference) and another crucible filled with the sample. Therefore, this dual furnace apparatus prevents buoyancy effect perturbations and the total carrier gas flow rate is divided equally between these two furnaces (25 cm3/min each).
The choice of working with a Helium- atmosphere is due to the advantageous thermal properties of this gas (such as the thermal conductibility that is about eight times superior to the value for Argon and about six times superior to the values for nitrogen and air34). This significantly reduces
perturbations in the mass signal during the temperature program. We controlled the humidity of the gas stream by connecting an automated humidity generator (Wetsys, Setaram) to the entry of the thermobalance. The water vapor pressure in this work is represented by 𝑃\E] and corresponds to water vapor partial pressure values. The thermobalance’s precision is of 10−3 mg. We used
quantities between 5 and 12 mg of powder for the experiments. The sample holder was a quartz crucible with a diameter of 9 mm and with a fritted glass bottom. The fritted glass bottom is porous and lets the gas both pass through and be in contact with the lower part of the powder bed. The quantity of powder was sufficiently reduced so that the sample was dispersed in the crucible’s fritted bottom without the formation of a thick layer, minimizing the impact of heat and mass transfer.
We employed two experimental protocols to obtain thermodynamic equilibrium points for different water vapor partial pressure (PDEF) and temperature (T) conditions. The first employed protocol consisted of keeping a constant value of T and using stepwise PDEF values.
Figure 1(a) shows one example of this protocol for increasing values of PDEF. We also employed decreasing stepwise values of PDEF in some experiments. The second protocol consisted of
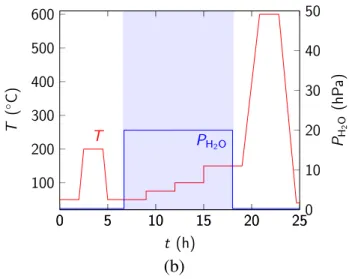
Figure 1(b) shows an example of this protocol using increasing T values. Similarly as for the first protocol, we also performed experiments for decreasing stepwise T. Therefore, we can consider experiments carried out under constant T and stepwise PDEF as obtained by protocol (a), and experiments carried out under constant PDEF and stepwise T as obtained by protocol (b). For
both protocols, the samples of calcium sulfate dihydrate were initially fully dehydrated towards the AIII-CaSO% phase at 200℃ at dry carrier gas conditions to establish a repeatable initial state for the experiments. To determine whether the equilibrium was reached, we waited until the stabilization of the mass signal for each pair @T, PDEFG. The use of different protocols with different
thermodynamic paths has the objective to ensure these mass values corresponded to the equilibrium values. The equilibrium was then reached by different thermodynamic paths, and the obtained mass values were compared. The experiments were carried for 5 hPa ≤ PDEF ≤ 60 hPa and for 34℃ ≤ T ≤ 250℃. However, due to water condensation limitations (due to the existence of cold spots within the experimental apparatus), it was not possible to obtain mass values at equilibrium conditions for the highest PDEF and the lowest T values combined.
(a) 0 5 10 15 20 25 100 200 300 400 500 600 T t (h) T ( C) 0 5 10 15 20 250 10 20 30 40 50 PH2O PH 2 O (h P a)
(b)
Figure 1. Schematic representation of the experimental protocols for (a) stepwise water vapor
partial pressure and (b) stepwise temperature.
2.3. Characterization of samples textural properties. The textural properties of three sets of
samples were analyzed. The first set was composed by the initial sample. The second set was prepared by dehydrating this sample at 200℃ (to repeat the first dehydration step employed for the TGA protocol) under dry Argon stream (10 L/h) using a horizontal tubular furnace (Carbolite). The third set was prepared in two steps: (i) dehydration of the initial calcium sulfate powder at 200℃ under dry Argon stream (10 L/h) and (ii) hydration of the powder at 50℃ and humid Argon stream (10 L/h, 10 hPa ≤ PDEF ≤ 60 hPa). These three sets of samples were prepared using a tubular horizontal furnace (Carbolite) instrumented with an automated humidity generator (Wetsys, Setaram).
The specific surface area of samples and their pore size distribution were estimated by nitrogen adsorption data at 77 K using an automated sorption system (ASAP 2020, Micromeritics). We obtained the adsorption data for the relative pressure range between 0.01 and 0.99. We employed the Brunauer-Emmet-Teller (BET) theory to estimate the surface area of samples.35 We estimated
0 5 10 15 20 25 100 200 300 400 500 600 T t (h) T ( C) 0 5 10 15 20 250 10 20 30 40 50 PH2O PH 2 O (h P a)
the pore size distribution and the total pore volume using the method by Barret, Joyner, and Halenda (BJH method).36 We verified the presence of micropores for the second and third sets of
samples by using the t-plot method of Lippens and de Boer.37–39 We observed the general aspect
and the texture of the sample before and after dehydration using scanning electron microscopy (FEG Zeiss SUPRA 44VP).
2.4. In-situ XRD experiments. Powder X-ray patterns of the sample under different @T, PDEFG conditions were measured with a diffractometer (Bruker D8 Advance) with monochromatic Cu − KW radiation (λ = 1.5406 Å). For this, we placed the samples in a closed chamber, and we
instrumented the diffractometer with an automated humidity generator (Wetsys, Setaram). The patterns were obtained for the interval 13° ≤ 2θ ≤ 30° with a scan time of 2 s. We compared the results to the patterns of calcium sulfate dihydrate (JCPDS 33-0311), hemihydrate (JCPDS 41-0224) and AIII-CaSO% (JCPDS 45-0157).
3. Results and discussion
3.1. Initial sample composition. Figure 2 shows the diffractogram obtained for the initial
sample compared to the powder diffraction file for calcium sulfate dihydrate (JCPDS 33-0311). No other crystalline phase apart from CaSO%⋅ 2H+O was detected. The concentration of elements
was measured by ICP-MS as shown in Table 1. The proportions of Ca and S are very close to the stoichiometric quantities in calcium sulfate dihydrate (23.3% and 18.6%, respectively) and other elements are present as traces. These analyses confirmed the high purity of the sample used for the experiments.
Figure 2. XRD diffractogram of the calcium sulfate dihydrate powder sample.
Table 1. Concentration of elements in the calcium sulfate dihydrate sample by ICP-MS Elements Concentration (wt.%) Ca 22.7 S 19.8 K 0.4 Na 0.2 Si 0.01
3.2. Thermogravimetric analysis results. Figure 3(a) shows an example of a curve obtained
by TGA for an experiment carried out at constant PDEF and stepwise T, i.e., protocol (a). The sample mass (represented by md) is shown as a function of time, T, and PDEF. Firstly, the initial sample of DH was fully dehydrated towards the form AIII-CaSO% at 200℃ under a dry Helium stream. The percentage of mass loss measured was of (20.74 ± 0.01)%, that corresponds approximately to the stoichiometric value of 20.9% for complete dehydration of DH. This initial dehydration step was carried to set a repeatable starting point for all the experiments. After that,
the temperature was reduced, and the carrier gas was inserted with controlled humidity. In this middle part of the experiment, PDEF was kept constant, and increasing T plateaus were performed throughout the experiment. The @T, PDEFG conditions were maintained until stabilization of the mass signal. We observe an almost instantaneous 8% mass uptake with the insertion of humid gas (the mass of the sample increases from 4.20 mg to 4.54 mg). Afterward, we observe that for each increasing T step, the sample loses mass and md reaches a new equilibrium value. This systematic behavior can be observed in the areas identified as zones 1 and 2, better shown in Figure 3(b) and Figure 3(c), respectively. According to @T, PDEFG, the overall mass md of the sample can increase or decrease by hydration or dehydration processes. This behavior can be identified as bivariant, as the equilibrium values of md depend on both intensive parameters of the system, T and PDEF (two degrees of freedom).
The average mass at equilibrium md@T, PDEFG is then computed by averaging the mass md values
over about one hour after the stabilization of the mass signal. This treatment of the TGA data also allows the determination of a standard deviation value for the calculated average mass at equilibrium. In the end, the sample is fully calcined at 600℃ to produce an anhydrous reference mass (represented by mfD). The observed difference between md and mfD during the experiments were attributed to the water content of the sample at given @T, PDEFG conditions. Therefore, the overall water content of the sample ε (considering both structural and adsorbed water) at equilibrium for each set of conditions T and PDEF is then calculated as
ε =nDEF@T, PDEFG
nhijFk =
lmd@T, PDEFG − mfDm Mn DEF
mfD⁄MhijFk (1)
where:
• nhijFk is the quantity of anhydrous calcium sulfate in moles in the sample (calculated
from mfD),
• MDEF and MhijFk represent the molar mass of water and calcium sulfate respectively (MDEF = 18.015 g ⋅ mol;< and M
hijFk = 136.14 g ⋅ mol;<).
Figure 3. (a) TGA curve of dehydration-hydration using measurement protocol (a) (stepwise
increasing T and constant PDEF). The two highlighted zones show mass signal stabilization: (b) zoomed portion zone 1; (c) zoomed portion zone 2. The mass signal from 5 to 9 hours for the
beginning of zone 1 is not considered to have reached equilibrium (not stable) and is disregarded in further calculations.
As previously stated in the experimental section, we also performed TGA experiments using protocol (b) (under constant T and stepwise PDEF) as shown in Figure 4(a). Again, the initial sample is fully dehydrated towards the form AIII-CaSO% at 200℃ under a dry Helium stream to ensure a repeatable starting point for the experiments. Afterward, the temperature was reduced and kept constant at 50℃. Humid gas was then introduced with increasing PDEF values according to the protocol shown in Figure 4(c). Similarly to the last protocol results, we observe that md increases
for each change in PDEF. However, for this protocol, the sample undergoes hydration. That is, its
mass increases and this variation is obtained by increasing PDEF. Figure 4(b) shows the region for which we observe the bivariant behavior of md for easier visualization. Again, we observed that
the sample shows a bivariant behavior and the equilibrium values of md depend on both T and PDEF. At the end of the experiment, similarly to the previously shown protocol, the sample is fully calcined at 600℃ to obtain an anhydrous reference mass, and the overall water content ε of the sample is calculated using (1.
Figure 4. (a) TGA curve for the dehydration-hydration using protocol (b) (stepwise increase in
PDEF and constant T). (b) The highlighted zone indicates mass signal stabilization. (c) Stepwise increase in PDEF values.
We thoroughly verified whether the calculated values of ε for each set of conditions @T, PDEFG corresponded to equilibrium values. We performed these verifications by carrying out systematic repetitions of experiments and by attaining equilibrium conditions through different T and PDEF paths. For instance, Figure 3 and Figure 4 show examples of how the equilibrium was reached by using different experimental protocols. Figure 5 shows the summary of results obtained for ε after
conditions and with different protocols. The equilibrium values of ε obtained for different pairs @T, PDEFG are compared. The vertical axis corresponds to the values obtained under stepwise T and constant PDEF (protocol (a)) and the horizontal axis corresponds to the values under stepwise PDEF and constant T (protocol (b)). The experiments were then considered to reach equilibrium due to the observed correspondence of ε values for both protocols.
Figure 5. Values of equilibrium of the overall water content ε obtained under 50℃, 100℃, and 150℃ by protocols (a) and (b): isobaric and stepwise isothermal measurements and isothermal and stepwise isobaric measurements, respectively.
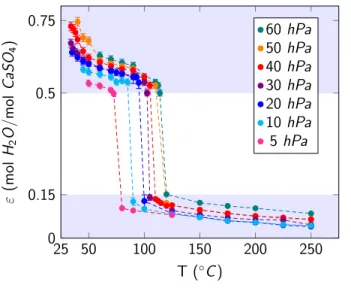
The equilibrium values of ε for each @T, PDEFG conditions were then obtained for several experiments for the experimental ranges of 5 hPa ≤ PDEF ≤ 60 hPa and 34℃ ≤ T ≤ 250℃. Figure 6 shows the corresponding results by representing the measured overall water content values of ε as a function of @T, PDEFG (see Table S1 in the Supporting Information for data points).
Three zones can be highlighted in this graph. The lower (0 < ε < 0.15) and the upper (ε > 0.5) zones are characterized by a continuous change in ε with temperature. On the other hand, in the middle zone (0.15 < ε < 0.5), there are no equilibrium points, and the isobar is step-shaped
0.50 0.55 0.60 0.65 0.70 0.50 0.55 0.60 0.65 0.70 0.0 0.1 0.2 0.3 0.4 0.5 0.6 0.7 0.0 0.1 0.2 0.3 0.4 0.5 0.6 0.7 0.00 0.05 0.10 0.15 0.00 0.05 0.10 0.15 50 hPa 40 hPa 30 hPa 10 hPa 20 hPa e b y s te pwi se T (m ol H2 O/m ol CaSO 4 )
5 hPa water vapor partial pressure 50°C 45° 100°C 40 hPa 30 hPa 10 hPa 20 hPa e by stepwise PH 2O
(mol H2O/mol CaSO4) water vapor partial pressure 45° 40 hPa 30 hPa 10 hPa 20 hPa water vapor partial pressure 150°C 45°
indicating that the temperature of the hydration/dehydration transition in this zone is a function of the water vapor pressure.
Figure 6. Isobars showing the overall water content ε of the calcium sulfate sample as a function of the temperature T and the water vapor partial pressure PDEF. For a 3-D representation of the
ε-PDEF-T curves, see Figure S4 in the Supporting Information.
This observed behavior can be interpreted by the existence of one univariant zone (in the middle part of the diagram) and two bivariant zones (identified as the lower and the upper parts of the diagram). The univariant zone represents the univariant transition between phases AIII-CaSO% and β-HH. It allows the determination of precise @T, PDEFG values for which this hydration/dehydration transition between these two phases takes place. The lower bivariant zone (0 < ε < 0.15), can be interpreted as the stability domain for the phase AIII-CaSO% and the evolution of ε in this zone can
be interpreted as caused by water vapor adsorption. The upper bivariant zone (ε > 0.5) can be referred to as the stability domain for the phase β-HH. The variation in its water content can also be associated with water vapor adsorption.
25 50 100 150 200 250 0 0.15 0.5 0.75 T ( C ) " (m ol H2 O /mol Ca S O4 ) 60 hPa50 hPa 40 hPa 30 hPa 20 hPa 10 hPa 5 hPa
Therefore, we can represent the overall water content ε measured by TGA for calcium sulfate compounds as produced by two contributions: structural (or crystalline) water and adsorbed water. This can be expressed by the following expression
ε = nqr-strs-u + niwqx-yrdxz
where nqr-strs-u and niwqx-yrdxz correspond to the structural and adsorbed water contents, respectively. For our study, nqr-strs-u = 0 or 0.5 mol H+O mol CaSO⁄ % according to the calcium sulfate phase (i.e., AIII-CaSO% or β-HH, respectively).
Finally, as a matter of comparison, these two bivariant zones in Figure 6 are similar to zone 1 and 2 in Figure 3. Zone 1 corresponds to the upper bivariant zone caused by the water vapor adsorption on β-HH. Zone 2, on the other hand, corresponds to the lower bivariant zone that is related to water vapor adsorption on AIII-CaSO%.
Overall, these observations confirm the univariant nature of the transition between distinct phases AIII-CaSO% and β-HH.27,29 From these observations, it is possible to determine for which
T and PDEF conditions this transition takes place and then use these data to perform phase equilibrium calculation. Furthermore, we can also complement these observations by verifying the crystalline phase in the lower and upper bivariant zones by in-situ XRD experiments. Both these aspects, phase equilibrium calculation and in-situ XRD experiments, are treated in the following sections.
Concerning the quantification of the adsorption phenomena, we observe that the quantities of adsorbed water are capable of changing the overall water content of the calcium sulfate sample considerably depending on the thermodynamic state @T, PDEFG of the system. For the experimental conditions in this work, we showed that β-HH can adsorb up to 0.25 mol H+O mol CaSO⁄ % beyond its crystalline water content of 0.5 mol H+O mol CaSO⁄ %. That is, a β-HH sample could present a
quantity of adsorbed water that represents 50% of the crystalline water content. We also showed that AIII-CaSO% can adsorb water up to 0.15 mol H+O mol CaSO⁄ %. These quantities are fairly significant and represent a challenge for the elaboration of gypsum products. For example, depending on the ambient temperature and humidity conditions, the water content in plasters due to adsorption may be more or less significant. However, it is known that the proportion of the adsorption phenomenon varies according to the textural properties of materials (specific surface area and porosity). Therefore, the adsorbed water quantity may also vary depending on the texture of a given material.
3.3. In-situ XRD study under isothermal and isobaric conditions. Figure 7 shows the results
of an in-situ XRD study under controlled @T, PDEFG conditions. This study was performed to complement the results presented in the previous section. We checked the crystalline phase composition for some points in the diagram presented in Figure 6.
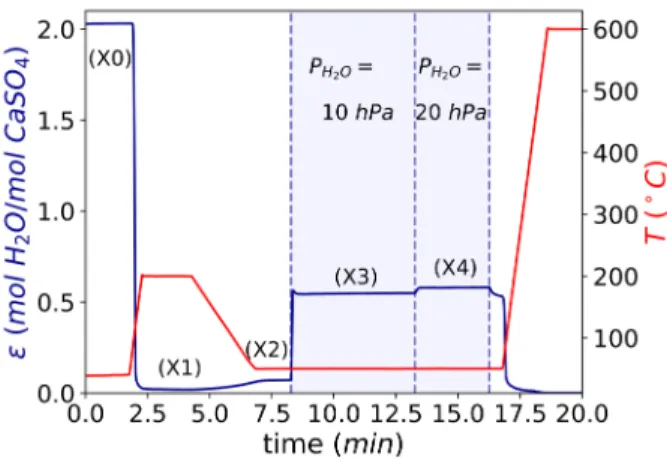
Figure 8 shows a TGA curve to illustrate the evolution of the overall water content ε of the sample throughout one experiment where the sample undergoes dehydration and hydration at different @T, PDEFG conditions. We observe that for the initial point X0, the sample corresponds to calcium sulfate dihydrate (ε = 2). After complete dehydration at 200℃ (under dry Helium flow) and cool-down to 50℃, points X1 and X2 should correspond to phase AIII-CaSO_4 (ε ≈ 0). Finally, after the introduction of the humid gas stream with PDEF values of 10 hPa and 20 hPa, the
sample should be composed by β-hemihydrate (ε ≈ 0.5).
Figure 7(a) shows the XRD diffractograms obtained for a similar sequence of @T, PDEFG
conditions. Diffractogram X0 was obtained at the beginning of the experiment, at room temperature (RT) conditions. As expected, the sample showed the calcium sulfate dihydrate
pattern. After the initial dehydration at 200℃ with dry Helium as a carrier gas, we verify that diffractogram X1 corresponds to AIII-CaSO% pattern. Diffractogram X2, obtained when the sample was cooled down to 50℃ also shows a profile corresponding to the AIII-CaSO% pattern. Finally, as the PDEF value was set to 10 hPa and after to 20 hPa, we obtained diffractograms X3 and X4,
respectively. Both of these diffractograms showed profiles corresponding to the phase CaSO%⋅ 0.5H+O. To better visualize the differences between the diffractograms X1 and X2 compared to X3 and X4, we can zoom and superpose some of the peaks and compare them with the patterns. Figure 7(b) shows the comparison for the peaks appearing in the range 25° ≤ 2θ ≤ 26.5° for diffractograms X1 to X4. (Figure S5 in the supporting information document shows the comparison for other peaks in the ranges 14° ≤ 2θ ≤ 15.5° and 29° ≤ 2θ ≤ 30°.) Hence, we verified the former premises: diffractograms X1 and X2 do correspond to the AIII-CaSO% patterns;
Figure 7. (a) Sequence of in-situ XRD diffractograms at controlled @T, PDEFG for calcium sulfate
under different conditions. (b) Zoomed peaks at 25° ≤ 2θ ≤ 26.5°.
10 15 20 25 30 0 430 860 12900 160 320 4800 160 320 4800 99 198 2970 100 200 300 10 15 20 25 30 X0 2θ (°) X1 X3 X2 X4
(a)
50°C, <1 hPa In te n si ty ( a .u .) RT 200°C, <1 hPa 50°C, 10 hPa 50°C, 20 hPa CaSO4·2H2O AIII-CaSO4 CaSO4·0.5H2O 25.0 25.2 25.4 25.6 25.8 26.0 26.2 26.4 0 100 200 AIII-CaSO4 CaSO4·0.5H2O In te n si ty ( a .u .) 2θ (°) 200°C, < 1hPa X1 50°C, < 1 hPa X2 50°C, 10 hPa X3 50°C, 20 hPa X4(b)
Figure 8. TGA curve corresponding to the in-situ XRD experiment shown in Figure 7.
3.4. Evolution of the sample textural properties. As water adsorption is a surface
phenomenon, we have interested ourselves in the textural properties of the calcium sulfate samples at different moments of the TGA protocol. For this reason, three sets of samples were prepared. The first set was composed by the initial sample. The second set was prepared after the full dehydration of the initial sample at 200℃ to represent the AIII-CaSO% phase. The third and last set of samples was prepared by the dehydration of the initial sample at 200℃ and its subsequent hydration at 50℃ and at different PDEF values with the objective of representing the β-HH phase
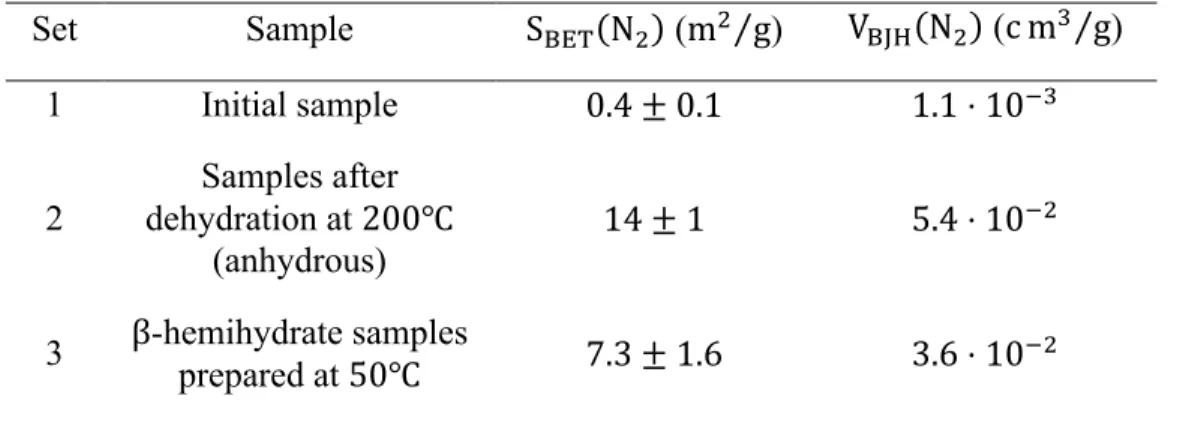
(15 hPa ≤ PDEF ≤ 60 hPa). The nitrogen adsorption and desorption isotherms, the pore size distribution curves, and the t-plot (only for the second and third sets of samples) are shown in the supporting information document (cf. Figures S1-S3) Table 2 lists the BET specific surface areas S}~•(N+) and the BJH pore volume V}•D(N+) calculated from the nitrogen adsorption isotherms.
We observe that the dehydration reaction at 200℃ increases the BET specific surface area of the sample by 35 times and the BJH pore volume more than 50 times. This increase in the textural properties of a sample has been previously observed for dehydration reactions.40,41 The departure
of the water molecules from the initial sample creates a network of pores and cracks that are responsible for increasing the specific surface area of the sample. However, once the material
undergoes hydration, the crystallographic structure of the material changes and part of the pores are occupied by the water molecules. Therefore, the surface and pores of the hydrated material are less accessible to nitrogen molecules, and the calculated values S}~•(N+) and V}•D(N+) for
textural properties decrease. In terms of the general aspects of the powder before and after the dehydration process, we made observations by SEM (cf. Figure 9). Figure 9(a)-(b) shows the smooth overall aspect of the initial powder and Figure 9(c)-(d) shows the creation of pores and cracks with the dehydration process. Overall, the creation of surface and pores that are available for adsorption is expected considering the results presented in Figure 6.
Table 2. BET specific surface areas S}~•(N+) and BJH pore volume V}•D(N+) calculated from
nitrogen adsorption data at 77 K
Set Sample S}~•(N+) (m+⁄ ) g V }•D(N+) (c mƒ⁄ ) g 1 Initial sample 0.4 ± 0.1 1.1 ⋅ 10;ƒ 2 Samples after dehydration at 200℃ (anhydrous) 14 ± 1 5.4 ⋅ 10;+
Figure 9. SEM images of the powder: (a) general aspect of the initial powder, (b) texture of the
initial grains of powder, (c) powder grain after calcination at 200℃, and (d) powder grain after calcination at 200℃ and hydration at (100℃, 40 hPa).
3.5. Equilibrium between β-hemihydrate and soluble anhydrite. The univariant zone
highlighted in the middle part of Figure 6 allows the determination of the equilibrium conditions for the transition between phases AIII-CaSO% and β-HH. To propose a simplified thermodynamic
model of the equilibrium curve, the equilibrium equation between the two phases AIII-CaSO% and
β-HH can be represented as
β-CaSO%⋅ 0.5H+O(q) ⇌AIII-CaSO%(q)+ 0.5H+O(…) (2)
for which the equilibrium constant K† is expressed in terms of the van’t Hoff equation as follows ln K†= −Δ-G° RT = − Δ-H° RT + Δ-S° R (3)
where Δ-G°, Δ-H°, and Δ-S° are the changes in Gibbs free energy, enthalpy and entropy for the
dehydration reaction in (2 at standard conditions. The law of mass action allows expressing the equilibrium constant as K†= @PDEF⁄ GP° ‰.Š (P° is the standard pressure here taken as the unit pressure in atm.) Therefore, the van’t Hoff equation becomes
10 µm
10 µm 2 µm
10 µm
(a) (b)
ln ŒPDEF P° • = − 2Δ-H° RT + 2Δ-S° R (4)
For this approximation, Δ-H° and Δ-S° are assumed to be independent of T for the investigated experimental temperature range (van’t Hoff equation approximation.)42
To determine the transition conditions for the equilibrium in (2, we plotted the stability points for each phase onto the PDEF-T plane. Figure 10(a) shows these points in this PDEF-T phase diagram. According to our previous hypotheses, the experimental points for which ε ≥ 0.5 belong to the β-HH stability domain (red circles), and those for which ε < 0.5 belong to the AIII-CaSO% stability domain (red squares). The transition @T, PDEFG values can then be determined by
considering the limits of the stability domains for these phases. We marked these values as blue squares and plotted the equilibrium curve by considering the van’t Hoff plot in Figure 10(b) (and by applying Eq. 4). Moreover, the linear relationship shown in Figure 10(b) confirms the validity of the van’t Hoff equation to represent the equilibrium @T, PDEFG values for the transition between β-HH and AIII-CaSO%. Therefore, we can estimate the values Δ-H° = (35.5 ± 1.0) kJ ⋅ mol;< and
30 50 100 150 200 0 20 40 60 80 100 -CaSO4· 0.5H2O AIII-CaSO4 T ( C) PH 2 O (h P a)
AIII-CaSO4stability points
-CaSO4· 0.5H2O stability points
Equilibrium points Fitted equilibrium curve
H2O(`)*) H2O(g) (a) 2.55 2.6 2.65 2.7 2.75 2.8 2.85 2.9 · 10 3 5.5 5 4.5 4 3.5 3 2.5 R2= 0.9958 1/T (K 1) ln (P H2 O /P ) (b) 50 75 100 125 150 0 20 40 60 80 100 -CaSO4· 0.5 H2O AIII-CaSO4 T ( C) PH 2 O (h P a) This study Fitted equilibrium curve
P (Kelley at al.) U (Kelley at al.) W (Kelley at al.) LC (Kelley at al.) Oetzel at al. Clifton (c)
Figure 10. Pressure-Temperature phase diagrams for the equilibrium between β-HH and
AIII-CaSO%. (a) The stability points for phases AIII-CaSO% and β-CaSO%⋅ 0.5H+O and the transition equilibrium values are presented. The line passing through the latter was fitted using the van’t Hoff equation and represents the equilibrium line between these two phases. The dashed line on the top left-hand side represents the water vapor saturation line, and the liquid water stability domain is situated on the shaded area. (b) van’t Hoff plot of the equilibrium data. (c) Comparison for the equilibrium curve for the transition between β-HH and AIII-CaSO% obtained by the present study and natural gypsum samples obtained by Kelley et al. (P, U, W, and LC), Oetzel et al., and Clifton.43–45
The transition values were confronted with thermodynamic equilibrium data reported by Kelley et al. 43, Oetzel et al.44 and Clifton45, as shown in Figure 10(c). The first set of data for samples
identified as P, U, W, and LC were published by Kelley et al. and correspond to hemihydrate samples. P and U correspond to β-hemihydrate samples prepared by heating up natural gypsum in the form of selenite; W probably corresponds to a mixture of α- and β-hemihydrate; LC corresponds to a set of data obtained from previous work by Lescoeur46. We observe that the
equilibrium points almost superpose for T values up to 90℃. For higher T values though, we observe that there is a shift between the conditions obtained from this study. For the same PDEF value, data from Kelley et al. suggest that higher temperatures are necessary for the dehydration reaction onset. Although we cannot obtain specific information regarding the samples and methods employed by Kelley et al., we can list some hypotheses that might be at the cause of the differences obtained between this study and their results. At first, it is known that the presence of impurities can alter the thermodynamic activities of the components of a chemical system. Therefore, the observed differences could be linked to the purity of the samples. Moreover, as Kelley et al.
worked with dynamic vacuum conditions, some variations in water vapor pressure may occur throughout the experiment. As they have not shown their experimental errors for the pressure and temperature values, we cannot be sure of the real differences between all equilibrium points.
By employing the same methodology as for the experimental data from this study, we calculated values of Δ-H° and Δ-S° for Kelley et al. datasets in Figure 10(c). They are shown in Table 3 in comparison to the values calculated for the present study. As expected, some shifts are also observed for these values due to differences in the equilibrium points.
Other published PDEF-T diagrams for this reaction can also be found in the literature such as the ones from Oetzel et al. and Clifton also plotted in Figure 10(c). The results obtained by Oetzel et al. by in-situ XRD show higher transition values of T for the same values of PDEF compared to the data from the present work. This may be because they use flue-gas desulfurization (FGD) gypsum, obtained as a secondary product from coal-fired power stations, without specifying the impurities content of the material. For this reason, we calculated values of Δ-H° = (51.3 ± 1.6) kJ ⋅ mol;<
and Δ-S° = (117.9 ± 4.4) J ⋅ mol;<⋅ K;<, which are superior to the ones calculated for the
synthetic highly pure calcium sulfate dihydrate. The study by Clifton, on the other hand, used highly pure reagent grade calcium sulfate dihydrate for his experiments. However, as they determined the transition using a non-isothermal protocol, the proper determination of the transition temperature can be problematic due to kinetic effects. Moreover, they were not able to measure and estimate Δ-H° values by DSC due to experimental limitations. In Figure 10(c), only one data point from Clifton can be seen as it is the only experimental points within the considered T and PDEF ranges.
Table 3. Values for Δ-H° and Δ-S° for the equilibrium between β-HH and AIII-CaSO% Experimental data Δ-H° (kJ ⋅ mol;<) Δ-S° (J ⋅ mol;<⋅ K;<)
This study 35.5 ± 1.0 80.0 ± 2.8 Sample P 43 32.5 ± 0.6 70.4 ± 1.6 Sample U 43 31.7 ± 0.3 67.8 ± 0.9 Sample W 43 32.2 ± 0.2 69.4 ± 0.4 Sample LC 43 32.5 ± 2.1 70.7 ± 5.3 FGD gypsum 44 51.3 ± 1.6 117.9 ± 4.4 4. Conclusions
The present work is the first part of a study focusing on the thermodynamic aspects of the water vapor interaction phenomena on calcium sulfate compounds obtained from the dehydration of synthetic gypsum (highly pure CaSO%⋅ 2H+O). The objective of this study was to propose an
updated version of the phase diagram and quantify the water adsorption phenomena on calcium sulfate polymorphs as a function of @T, PDEFG.
The results showed that the adsorbed water content on AIII-CaSO% and β-HH can vary beyond the crystalline water content of these compounds. Moreover, they evolve continuously with temperature and water vapor partial pressure within their stability domains. In the presence of water vapor partial pressure ranging from 5 hPa to 60 hPa and temperature from 34℃ to 250℃, two bivariant zones were observed. We interpreted the lower bivariant zone (0 ≤ ε ≤ 0.15) as caused by water vapor adsorption on AIII-CaSO% and the upper bivariant zone (ε ≥ 0.5) as caused by water vapor adsorption on β-HH. We provided in-situ XRD data to support these hypotheses. The transition between these two phases was also verified to be univariant. We proposed an
updated pressure-temperature diagram and calculate the values Δ-H° = (35.5 ± 1.0) kJ ⋅ mol;<
and Δ-S° = (80.0 ± 2.8) J ⋅ mol;<⋅ K;<.
We compared our equilibrium points and thermodynamic parameter values to previously reported points in the literature, and we could find some differences. We have attributed this to the kind of material that is used and its chemical composition. The thermodynamic activity of a component can vary if the samples presents impurities. Therefore, we may expect shifts in the equilibrium diagram for these cases. Therefore, if one is to use a specific raw material for an application, a targeted thermodynamic study should also be performed to take account of the possible observed shifts and reduce uncertainties in terms of process conditions and formulation of products.
We observed that calcium sulfate polymorphs can show considerably higher overall amounts of water compared to their crystalline water contents. Water adsorption on AIII-CaSO% represented up to about 0.15 mol H+O mol CaSO⁄ %. For β-HH, this quantity represented up to 0.25 mol H+O mol CaSO⁄ % beyond the crystalline water content of 0.5 mol H+O mol CaSO⁄ %.
These amounts are indeed appreciable and should be considered in the formulation of gypsum products. However, the adsorbed water contents may change from sample to sample as a function of the textural properties of the material (specific surface and porosity).
Moreover, we also observed that the BET specific surface area and the BJH pore volume of calcium sulfate calculated from nitrogen adsorption data at 77 K increase with dehydration and decrease with hydration. This was associated with the departure and incorporation of water molecules. The initial departure of water molecules creates a pore network that is accessible by nitrogen. Once the material undergoes hydration, fewer pores are accessible to nitrogen adsorption.
In the second part of this work, we analyze the nature of the adsorbed water on AIII-CaSO% and β-HH by using adsorption thermodynamic models.
Supporting Information Additional experimental and characterization data. This information is available free of charge via the Internet at http://pubs.acs.org/.
ACKNOWLEDGMENT
The authors acknowledge Saint-Gobain for the funding of this work. NOMENCLATURE
T Temperature (℃)
PDEF Water vapor partial pressure (hPa)
P° Reference pressure (1 atm)
md Sample mass (mg)
md(T, PDEF) Average sample mass at @T, PDEFG (mg) nDEF@T, PDEFG Quantity of water molecules in moles
mfD Mass of anhydrous calcium sulfate anhydrite (mg)
S}~•(N+) BET area calculated from nitrogen adsorption data (m+⋅ g;<)
V}•D(N+) BJH pore volume calculated from nitrogen adsorption data (cmƒ ⋅ g;<)
nhijFk Quantity of anhydrous calcium sulfate in moles MDEF Molar mass of water (g ⋅ mol;<)
MhijFk Molar mass of calcium sulfate (g ⋅ mol;<)
K† Equilibrium constant
Δ-G° Change in Gibbs free energy of reaction (kJ ⋅ mol;<)
Δ-S° Change in entropy of reaction (J ⋅ mol;<⋅ K;<)
R Universal gas constant (= 8.314 J ⋅ mol;<⋅ K;<)
GREEK LETTERS
ε Overall water content in moles of water per mole of anhydrous calcium sulfate ABBREVIATIONS
DH Calcium sulfate dihydrate
HH Calcium sulfate hemihydrate
β-HH Calcium sulfate β-hemihydrate
XRD X-ray diffraction
ICP-MS Inductive coupled plasma mass spectrometry
TGA Thermogravimetric analysis
REFERENCES
(1) Kuntze, R. A. Gypsum: Connecting Science and Technology, 1st ed.; ASTM International: PA, USA, 2009.
(2) Crangle, R. D. Gypsum. Miner. Commod. Summ. 2017, No. 703, 76–77.
(3) Ramachandran, V. S.; Paroli, R. M.; Beaudoin, J. J.; Delgado, A. H. Handbook of Thermal Analysis of Construction Materials; Norwich, N.Y., U.S.A., 2002.
(4) Bedford, J.; Fusseis, F.; Leclère, H.; Wheeler, J.; Faulkner, D. A 4D View on the Evolution of Metamorphic Dehydration Reactions. Sci. Rep. 2017, 7 (1), 1–7.
(5) Llana-Fúnez, S.; Wheeler, J.; Faulkner, D. R. Metamorphic Reaction Rate Controlled by Fluid Pressure Not Confining Pressure: Implications of Dehydration Experiments with Gypsum. Contrib. to Mineral. Petrol. 2012, 164 (1), 69–79.
(6) Bish, D. L.; Blake, D. F.; Vaniman, D. T.; Chipera, S. J.; Morris, R. V.; Ming, D. W.; Treiman, A. H.; Sarrazin, P.; Morrison, S. M.; Downs, R. T.; et al. X-Ray Diffraction Results from Mars Science Laboratory: Mineralogy of Rocknest at Gale Crater. Science.
2013, 341, 12389321–12389325.
(7) Rapin, W.; Meslin, P. Y.; Maurice, S.; Vaniman, D.; Nachon, M.; Mangold, N.; Schröder, S.; Gasnault, O.; Forni, O.; Wiens, R. C.; et al. Hydration State of Calcium Sulfates in Gale Crater, Mars: Identification of Bassanite Veins. Earth Planet. Sci. Lett. 2016, 452, 197–205. (8) Gendrin, A.; Mangold, N.; Bibring, J. P.; Langevin, Y.; Gondet, B.; Poulet, F.; Bonello, G.; Quantin, C.; Mustard, J.; Arvidson, R.; et al. Sulfates in Martian Layered Terrains: The
OMEGA/Mars Express View. Science. 2005, 307, 1587–1591.
(9) Robertson, K. The Dehydration Kinetics of Gypsum: The Effect of Relative Humidity on Its Stability and Implications in the Martian Environment. Lunar Planet. Sci. XXXVIII 2007, 10–11.
(10) Bezou, C.; Nonat, A.; Mutin, J. C.; Nørlund Christensen, A.; Lehmann, M. S. Investigation of the Crystal Structure of γ-CaSO4, CaSO4· 0.5 H2O, and CaSO4· 0.6 H2O by Powder
Diffraction Methods. Journal of Solid State Chemistry. 1995, pp 165–176.
(11) Freyer, D.; Voigt, W. Crystallization and Phase Stability of CaSO4 and CaSO4-Based Salts.
Monatshefte fur Chemie 2003, 134 (5), 693–719.
(12) Christensen, A. N.; Olesen, M.; Cerenius, Y.; Jensen, T. R. Formation and Transformation of Five Different Phases in the CaSO4−H2O System: Crystal Structure of the Subhydrate
β-CaSO4·0.5H2O and Soluble Anhydrite CaSO4. Chem. Mater. 2008, 20 (6), 2124–2132.
(13) Christensen, A. N.; Jensen, T. R.; Nonat, A. A New Calcium Sulfate Hemi-Hydrate. Dalt. Trans. 2010, 39 (8), 2044.
(14) Ballirano, P.; Melis, E. Thermal Behaviour and Kinetics of Dehydration of Gypsum in Air from in Situ Real-Time Laboratory Parallel-Beam X-Ray Powder Diffraction. Phys. Chem. Miner. 2009, 36 (7), 391–402.
(15) Schmidt, H.; Paschke, I.; Freyer, D.; Voigt, W. Water Channel Structure of Bassanite at High Air Humidity: Crystal Structure of CaSO4·0.625 H2O. Acta Crystallogr. Sect. B Struct.
(16) Powell, D. A. The α- And β-Forms of Calcium Sulphate Hemihydrate. Nature 1960, 185 (4710), 375–376.
(17) Morris, R. J. X-Ray Diffraction Identification of the Alpha and Beta-Forms of Calcium Sulphate Hemihydrate. Nature 1963, 198, 1298–1299.
(18) Newman, E. S. Behavior of Calcium Sulfate at High Temperatures. J. Res. Natl. Bur. Stand. (1934). 1941, 27, 191–196.
(19) Kirfel, A.; Will, G. Charge Density in Anhydrite, CaSO4, from X-Ray and Neutron
Diffraction Measurements. Acta Crystallogr. Sect. B Struct. Crystallogr. Cryst. Chem.
1980, 36 (12), 2881–2890.
(20) Okhrimenko, L.; Favergeon, L.; Johannes, K.; Kuznik, F.; Pijolat, M. Thermodynamic Study of MgSO4–H2O System Dehydration at Low Pressure in View of Heat Storage.
Thermochim. Acta 2017, 656, 135–143.
(21) Posnjak, E. The System CaSO4-H2O. Am. J. Sci. 1938, 247–272.
(22) Ramsdell, L.; Partridge, E. The Crystal Forms of Calcium Sulphate. J. Mineral. Soc. Am. 59–74.
(23) Gardet, J. J.; Guilhot, B.; Soustelle, M. The Dehydration Kinetics of Calcium Sulfate Dihydrate Influence of the Gaseous Atmosphere and the Temperature. Cem. Concr. Res.
1976, 6, 697–706.
(24) Soustelle, M.; Guilhot, B.; Gardet, J. J.; Watelle-Marion, G.; Mutin, J. C. No 712. - Equilibres Divariants Entre La Vapeur d’eau et Les Hydrates Solides : Caractérisation de
La Nature de La Solution Solide, Limites Du Domaine de Divariance. Bull. Soc. Chim. Fr.
1972, 12, 4509–4514.
(25) Bunn, C. W. Some Applications of X-Ray Diffraction Methods in Industrial Chemistry. J. Sci. Instrum. 1941, 18 (5), 70–74.
(26) Gregg, S. J.; Willing, E. G. J. 647. The Dehydration of Gypsum. Part III. A Study of the Process of Dehydration and Rehydration of Gypsum by Adsorption Methods. J. Chem. Soc.
1951, 0, 2916–2920.
(27) Weiss, H.; Bräu, M. F. How Much Water Does Calcined Gypsum Contain? Angew. Chemie - Int. Ed. 2009, 48 (19), 3520–3524.
(28) Boeyens, J. C. A.; Ichharam, V. V. H. Redetermination of the Crystal Structure of Calcium Sulphate Dihydrate, CaSO4.2H2O. Zeitschrift fur Krist. 2002, 217, 9–19.
(29) Bezou, C.; Buisson, L.; Mutin, J.-C.; Nonat, A. Indentification Chimique et Radiocrystallographique de Deux Formes Sous-Hydratées Du Sulfate de Calcium : CaSO4, 0,5 H2O et CaSO4, 0,6 H2O. Comptes Rendus l’Académie des Sci. Série II 1990, 311, 1493–1498.
(30) Prieto-taboada, N.; Go, O.; Mart, I.; Madariaga, J. M. Raman Spectra of the Different Phases in the CaSO4-H2O System. Anal. Chem. 2014, 86, 10131–10137.
(31) Bezou, C. Etude Des Caracteristiques Cristallographiques, Thermodynamiques et Microstructurales Des Produits de Deshydratation Du Gypse, Ph.D. Dissertation, Université de Bourgogne, Dijon, 1991.
(32) Torrance, A.; Darvell, B. W. Effect of Humidity on Calcium Sulphate Hemihydrate. Aust. Dent. J. 1990, 35 (3), 230–235.
(33) Dunn, J. G.; Oliver, K.; Sills, I. Potential Errors in the Quantitative Determination of Hydrated Calcium Sulphates in Cement by Differential Scanning Calorimetry. Thermochim. Acta 1989, 153 (C), 93–104.
(34) Huber, M. L.; Harvey, A. H. Thermal Conductivity of Gases. In CRC Handbook of Chemistry and Physics; CRC-Press: Boca Raton, FL, USA, 2011.
(35) Brunauer, S.; Emmett, P. H.; Teller, E. Adsorption of Gases in Multimolecular Layers. J. Am. Chem. Soc. 1938, 60 (2), 309–319.
(36) Barrett, E. P.; Joyner, L. G.; Halenda, P. P. The Determination of Pore Volume and Area Distributions in Porous Substances. I. Computations from Nitrogen Isotherms. J. Am. Chem. Soc. 1951, 73 (1), 373–380.
(37) Lippens, B. C.; de Boer, J. H. Studies on Pore Systems in Catalysts V. The t Method. J. Catal. 1965, 4 (3), 319–323.
(38) Rouquerol, F.; Rouquerol, J.; Sing, K. Adsorption by Powder and Porous Solids: Principles, Methodology and Applications; Academic Press, 1999.
(39) Gregg, S.; Sing, K. Adsorption, Specific Surface and Porosity, 2nd ed.; Academic Press, 1991.
(40) Favergeon, L.; Pijolat, M. Influence of Water Vapor Pressure on the Induction Period during Li2SO4.H2O Single Crystals Dehydration. Thermochim. Acta 2011, 521 (1–2), 155–160.
(41) Fusseis, F.; Schrank, C.; Liu, J.; Karrech, A.; Llana-Fúnez, S.; Xiao, X.; Regenauer-Lieb, K. Pore Formation during Dehydration of a Polycrystalline Gypsum Sample Observed and Quantified in a Time-Series Synchrotron X-Ray Micro-Tomography Experiment. Solid Earth 2012, 3 (1), 71–86.
(42) Soustelle, M. Thermodynamics of Surfaces and Capillary Systems; ISTE Editions Ltd, 2016; Vol. 7.
(43) Kelley, K. K.; Southard, J. C.; Anderson, C. T. Thermodynamic Properties of Gypsum and Its Dehydration Products; 1941.
(44) Oetzel, M.; Heger, G.; Koslowski, T. Einfluss von Umgebungsfeuchte Uns Temperatur Auf Die Phasenumwandlungen Im System CaSO4-H2O. ZKG Int. 2000, 53 (6), 354–361.
(45) Clifton, J. R. Thermal Analysis of Calcium Sulfate Dihydrate and Supposed α and β Forms of Calcium Sulfate Hemihydrate from 25 to 500 °C. J. Res. Natl. Bur. Stand. - A. Phys. Chem. 1972, 76A, 41–49.
(46) Lescoeur, H. Recherches Sur La Dissociation Des Hydrates Salins et Des Composés Analogues. Ann. Chim. Phys. 1890, 21, 511.
For table of contents only 25 50 100 150 200 250 0 0.15 0.5 0.75 T ( C) " (mol H2 O/mol CaSO 4 ) PH2O 60 hPa 50 hPa 40 hPa 30 hPa 20 hPa 10 hPa 5 hPa CaSO4· " (T, PH2O) H2O
": Overall water content (structural + adsorbed) PH2O: Water vapor partial pressure