Université de Montréal
The Effect of Oral Appliance Therapy on Glycemic
Control in Type II Diabetic Patients with Obstructive Sleep
Apnea: A pilot Randomized Controlled Trial
par Emily Santini
Département de santé buccale, section d’orthodontie Faculté de médecine dentaire
Mémoire présenté à la Faculté des études supérieures en vue de l’obtention du grade de maîtrise
en médecine dentaire option orthodontie
Juin, 2019
© Emily Santini, 2019
Université de Montréal Faculté des études supérieures
Ce mémoire intitulé:
« The Effect of Oral Appliance Therapy on Glycemic Control in Type II Diabetic Patients with Obstructive Sleep Apnea: A pilot Randomized Controlled Trial »
Présenté par : Emily Santini
A été évalué par un jury composé des personnes suivantes :
Président-rapporteur : Dr Patrick Arcache Directrice de recherche :
Dre Nelly Huynh Co-directrice de recherche :
Dre Andrée Montpetit Membre du jury : Dre Sushmita Pamidi
Abstract
Introduction: Obstructive sleep apnea (OSA) is a disorder that is highly prevalent among patients with type 2 diabetes mellitus (T2DM) and the literature supports a strong link between OSA and glucose dysregulation. However, current randomized trials assessing the effect of OSA treatment on metabolic outcomes have been limited to continuous positive airway pressure (CPAP) therapy, and one of the main limitations of these studies is poor compliance. A mandibular advancement device (MAD) is an alternative treatment option for OSA that is generally better tolerated and accepted by patients than CPAP. Objectives: The main objective of this study is to evaluate if 3 months of treatment with a MAD will improve glycemic control in patients with OSA and T2DM as compared to a Placebo Device. Secondary objectives will be: 1) to evaluate the feasibility of a MAD to treat sleep apnea in a diabetic population, 2) to compare subjective side effects of the MAD and Placebo Device, 3) to compare subjective changes in quality of life and sleep with both devices, and 4) to compare subjective and objective compliance in both groups. Methods: 17 patients participated in this randomized controlled pilot study, comparing treatment of OSA using a MAD (Somnodentâ, n=7) and a placebo device (mandibular Essixâ, n=10). Blood samples measuring glycemic control by glycated hemoglobin levels were collected before and after treatment. Three polysomnographies were performed (at baseline, after a 2-month titration period and after a 3-month treatment period). All patients answered a side-effects questionnaire after the titration period, and the following questionnaires were compared before (V1), during (V4) and after treatment (V6): Epworth Sleepiness Scale (ESS), the Functional Outcomes of Sleep Questionnaire (FOSQ), the Pittsburg Sleep Quality Index (PSQI), and the Hospital Anxiety and Depression Scale. Patients recorded subjective compliance in a daily journal, and objective compliance was measured by a microchip. Results: No significant difference was found in glycated hemoglobin levels between groups (p=0.75). The MAD group showed a significant decrease in OSA as measured by the Apnea-Hypopnea Index (p=0.02) and the Oxygen Desaturation Index (p=0.02). No significant difference was found when comparing Side Effects Questionnaires between groups, more specifically for discomfort in jaws (p=0.15) and changes in occlusion (p=0.41). Frequency of complications were low in both groups and showed no significant differences (p=1.00). Overall patient satisfaction was high in both groups and showed no significant differences (p=1.00). Both groups showed significant improvements in FOSQ scores (p=0.004 between V1-4, and p=0.026 between V1-6), significant decreases in ESS (p= 0.023 between V1-4), significant decreases in Anxiety scores (p=0.003 between V1-4, and p=0.041 between V1-6), as well as a significant decrease in Depression scores (p=0.025 between V1-6). Patients in the MAD group significantly over-reported their subjective compliance as compared to the objective compliance measured by a microchip (p=0.02). Conclusion: MAD is a feasible treatment for OSA in patients with T2DM as it was able to significantly improve OSA while demonstrating high overall satisfaction and minimal complications. A strong “placebo effect” was noted with the Placebo Device and reinforces the importance of randomized and controlled studies in the field of OSA treatment. Microchips to measure objective compliance should be used as they offer more reliable data than subjective records. Further large-scale randomized and controlled trials are required, as well as future analyses of Continuous Glucose Monitoring Systems which may allow for more precise evaluation of glycemic outcomes; investigating possible metabolic phenotypes in patients which may respond better to OSA treatment will be important.
Keywords: obstructive sleep apnea, type II diabetes mellitus, glucose dysregulation, mandibular advancement device, placebo device, compliance.
Résumé
Introduction : Le syndrome de l’apnée obstructive du sommeil (SAOS) est un trouble très prévalent chez les
patients atteints du diabète de type 2 (DT2) et la littérature préconise un lien étroit entre le SAOS et la dysfonction glycémique. Cependant, les essais randomisés actuels évaluant le traitement du SAOS et les effets métaboliques chez les patients diabétiques sont limités au traitement par pression positive continue (PPC) – parcontre, une limitation majeure de ces études est une faible compliance. L’orthèse d’avancée mandibulaire (OAM) est une option de traitement alternative pour le SAOS qui est généralement mieux tolérée et acceptée par les patients que la PPC.
Objectifs : L’objectif principal de cette étude est d’évaluer si un traitement de 3 mois avec une OAM améliore le
contrôle glycémique chez les patients atteints du SAOS et le DT2 comparé à celui avec un appareil placébo. Les objectifs secondaires sont : 1) d’évaluer la faisabilité d’une OAM comme traitement du SAOS chez une population diabétique, 2) comparer les effets secondaires subjectifs ressentis lors du port de l’OAM ou de l’appareil placébo, 3) comparer les changements subjectifs dans la qualité de vie et sommeil avec les deux appareils, 4) comparer la compliance subjective et objective dans les deux groupes. Méthodes : 17 patients ont participé à cette étude pilote contrôlée et randomisée comparant le traitement du SAOS à l'aide d’une OAM (Somnodent®, n=7) et d'un appareil placébo (appareil Essix® mandibulaire, n=10). Des échantillons de sang mesurant le contrôle glycémique par les taux d'hémoglobine glyquée ont été prélevés avant et après le traitement. Trois polysomnographies ont été réalisées (au départ, après une période de titration de 2 mois et après une période de traitement de 3 mois). Tous les patients ont répondu à un questionnaire sur les effets indésirables après la période de titration. Les questionnaires suivants ont été comparés avant (V1), pendant (V4) et après (V6) le traitement : échelle de somnolence d’Epworth (ESS), questionnaire sur les résultats fonctionnels du sommeil (FOSQ), indice de qualité du sommeil de Pittsburg (PSQI), et l'échelle hospitalière d'anxiété et de dépression (HADS). Les patients ont rapporté leur compliance subjective dans un journal quotidien, et la compliance objective a été mesurée par une micropuce. Résultats : Aucune différence significative n'a été observée pour l’hémoglobine glycquée après 3-mois de traitement entre les deux groupes (p =0.75). L’OAM a présenté une diminution significative du SAOS mesurée par l'indice d'apnée-hypopnée (p =0.02) et l'indice de désaturation en oxygène (p =0.02). Aucune différence significative n'a été constatée lors de la comparaison des questionnaires sur les effets secondaires entre les groupes, plus précisément pour l'inconfort au niveau des mâchoires (p =0.15) et des changements occlusaux (p =0.41). La fréquence des complications était faible dans les deux groupes et n'a montré aucune différence significative (p =1.00). La satisfaction globale des patients était élevée dans les deux groupes et ne montrait aucune différence significative (p =1.00). Les deux groupes ont présenté des améliorations significatives des scores FOSQ (p =0.004 entre V1-4 et p =0.026 entre V1-6), des diminutions significatives pour ESS (p =0.023 entre V1-4), des diminutions significatives des scores d'anxiété (p =0.003 entre V1-4 et p =0.041 entre V1-6), ainsi qu’une diminution significative des scores de dépression (p =0.025 entre V1-6). Les patients du groupe avec OAM ont sur-rapporté de façon significative leur compliance subjective par rapport à la compliance objective mesurée par les micropuces (p =0.02). Conclusion : L’OAM est un traitement faisable pour le traitement du SAOS chez les patients atteints du DT2 et a démontré des effets secondaires minimes et un taux de satisfaction élevé. Un « effet placébo » important a été observé avec l’appareil placébo, ce qui souligne l’importance des études randomisées et contrôlées dans le domaine du traitement du SAOS. Les micropuces utilisées pour mesurer la compliance objective offrent des données plus fiables que les rapports subjectifs des patients. D'autres essais randomisés et contrôlés à grande échelle sont nécessaires, et des analyses futures d’un système de mesure de glucose en continue pourrait être plus précis pour évaluer les effets de l’OAM sur le contrôle glycémique ; l’investigation de phénotypes métaboliques chez certains patients qui pourraient mieux répondre au traitement de leur SAOS serait aussi important.
Mots-clés : syndrome de l’apnée obstructive du sommeil, diabète de type II, dysfonction glycémique, appareil d’avancée mandibulaire, appareil placébo, compliance.
Table of content
Abstract ... 3 Résumé ... 4 Table of content ... 5 List of tables ... 8 List of figures ... 9 Abbreviations ... 10 Remerciements ... 13 Literature Review... 14Introduction: Obstructive Sleep Apnea ... 14
Upper Airway Anatomy ... 14
Breathing during sleep ... 16
Pathogenesis and Risk Factors ... 16
Diagnosis ... 18
Classification... 19
Prevalence ... 19
Consequences of Obstructive Sleep Apnea ... 20
Cardiovascular effects ... 21
Cognitive impairments ... 22
Effects on glycemic regulation ... 24
Definition of Diabetes Mellitus... 24
Classification of Diabetes Mellitus ... 24
Type 1 Diabetes Mellitus (T1DM) ... 24
Type 2 Diabetes Mellitus ... 24
Gestational Diabetes Mellitus (GDM) ... 25
Prediabetes ... 25
Risk factors for T2DM ... 25
The metabolic syndrome ... 26
Pathogenesis of T2DM ... 26
Prevalence of Diabetes Mellitus ... 27
Monitoring hyperglycemia ... 27
Management and current treatment of T2DM ... 31
The link between T2DM and OSA ... 31
Obstructive Sleep Apnea Treatment ... 35
Weight loss ... 35
Treatment with Positive Airway Pressure ... 36
Oral Appliance Therapy ... 38
Surgical treatment ... 39
Impact of treatment on patient health ... 40
Objectives and Hypothesis ... 42
Statement of problem ... 42 Hypothesis ... 43 Research hypothesis ... 43 Null hypothesis ... 43 Study objectives ... 43 Sub-study objectives... 43 Main-study objectives ... 44
Materials and methods ... 45
Study type ... 45 Study population ... 45 Inclusion criteria... 45 Exclusion criteria ... 46 Recruitment... 47 Ethical considerations ... 47 Interventions ... 48
Randomization and blinding ... 48
Study groups ... 48
Procedures ... 49
Screening ... 49
Study visits and data collection ... 50
... 54
Statistical analysis ... 55
Patient description ... 55 ... 56 ... 56 Sociodemographic data ... 57 Polysomnographic data ... 60 Questionnaire data ... 61 Compliance data ... 64
Patient satisfaction and frequency of complications ... 66
Appliance side effects ... 68
Glycated hemoglobin ... 68
Discussion... 69
Conclusion ... 75
Bibliography ... 78
Annexe 1: Ethics Committee approvals ... 85
Annexe 2: Information consent forms... 89
Annexe 3: Questionnaires ...ii
Annexe 4: Flyers ... xix
Annexe 5: Material given to patient ... xx
List of tables
Table 1: Severity classification of OSA in accordance with the AHI. ... 19
Table 2: Prevalence of OSA in American men and women ages 30-49 and 50-70 with moderate to severe OSA. ... 20
Table 3: Various methods used to assess glucose metabolism by the American Thoracic Society. ... 29
Table 4: Different tests and results required for the diagnosis of prediabetes. ... 29
Table 5: Different tests and results required for the diagnosis of DM. ... 30
Table 6: Average initial study sample characteristics. ... 58
Table 7: Facial and oral characteristics. ... 59
Table 8A: Effects of appliance use on sleep variables. ... 60
Table 8B: Difference in AHI pre- and post-appliance. ... 60
Table 9: Effect of appliance use on sleep and quality of life questionnaires. ... 62
Table 10: Effect of appliance use on sleep and quality of life questionnaires. ... 63
Table 11: Comparison of objective and subjective compliance. ... 65
Table 12: Descriptive data for patient satisfaction and frequency of complications. ... 66
Table 13: Comparison of side effects felt with use of both devices. ... 68
List of figures
Figure 1. Anatomy of the upper airway. ... 15
Figure 2. The development of insulin resistance. ... 26
Figure 3. A – Airway collapse during sleep. B – Airway maintained open by positive pressure via nasal passage. ... 37
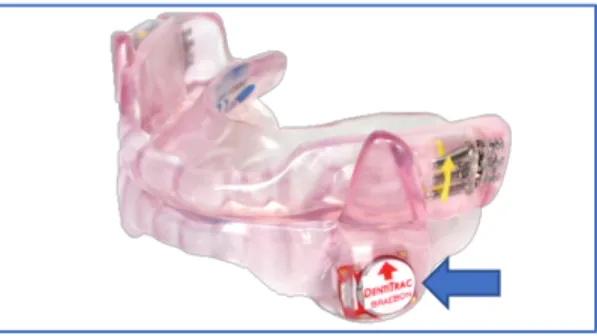
Figure 4. SomnoDent FlexÔ device with embedded DentitracÒ microchip. ... 48
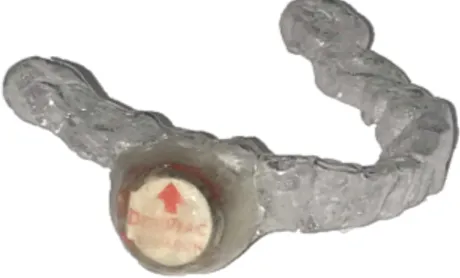
Figure 5. Mandibular Placebo device (EssixÒ with DentitracÒ microchip)... 49
Figure 6. Overview of the study visits. ... 54
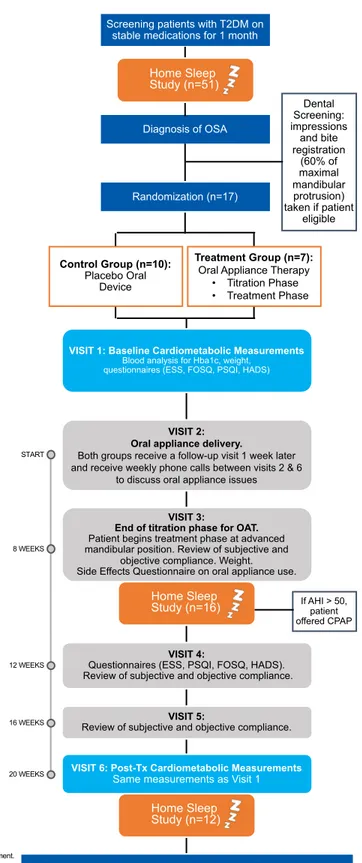
Figure 7. Patient flow chart. ... 56
Figure 8. Changes in mean AHI and ODI throughout Visits 1, 4, 6. ... 61
Abbreviations
AHI: Apnea-Hypopnea Index
APAP: Autotitrating Positive Airway Pressure BPAP: Bilevel Positive Airway Pressure
CGMS: Continuous Glucose Monitoring System CO2: Carbon dioxide
CPAP: Continuous Positive Airway Pressure CSA: Central Sleep Apnea
DM: Diabetes Mellitus
EDS: Excessive Daytime Sleepiness ESS: Epworth Sleep Scale
FOSQ: Function Outcome of Sleep Questionnaire FPG: Fasting Plasma Glucose
FSI: Fasting Serum Insulin
HADS: Hospital Anxiety and Depression Scale HbA1c: Hemoglobin A1c (glycated hemoglobin) HOMA: Homeostatic Model Assessment
HPA: Hypothalamic Pituitary Adrenal HTN: Hypertension
IFG: Impaired Fasting Glucose IGT: Impaired Glucose Tolerance IL: Interleukin
IR: Insulin resistance
MAD: Mandibular advancement device
NF-KB: Nuclear Factor Kappa-light-chain-enhancer of activated B cells O2: Oxygen
ODI: Oxygen Desaturation Index OGTT: Oral Glucose Tolerance Test OSA: Obstructive Sleep Apnea PAP: Positive Airway Pressure PG: Plasma Glucose
PSG: Polysomnography
PSQI: Pittsburgh Sleep Quality Index
RAAS: Renin Angiotensin Aldosterone System RCT: Randomized Controlled Trial
REM: Rapid Eye Movement SAO2: Oxyhemoglobin Saturation
SpO2: Peripheral oxygen saturation
SCD1: Stearoyl Coenzyme A Desaturase 1 SDB: Sleep-Disordered Breathing
T2DM: Type II Diabetes Mellitus TMJ: Temporo-Mandibular Joint TNF-a: Tumor Necrosis Factor alpha VLDL: Very Low-Density Lipoprotein
Pour mes parents; merci pour votre soutien remarquable pendant tout mon parcours. Pour ma sœur; merci pour tes constants encouragements et conseils. Et pour mon copain Jordan; merci pour ta patience durant mes dernières années d’études. Sans vous, ce travail n’aurait pu être possible.
Remerciements
J’aimerais remercier ma directrice de recherche, Dre Nelly Huynh, pour son expertise dans le domaine de l’apnée du sommeil, pour son temps précieux, ses conseils, et pour m’avoir si bien guidée à travers ces trois dernières années de recherche. Je tiens aussi à remercier ma co-directrice, Dre Andrée Montpetit, qui était toujours disponible pour offrir son aide et ses connaissances pour répondre à mes questions théoriques tant que cliniques.
Un gros merci au Dre Sushmita Pamidi, pneumologue au Centre Universitaire de Santé McGill, pour son dévouement à la recherche clinique et de vouloir m’offrir la chance de travailler sur ce projet. Merci à madame Geneviève Tremblay pour tous ses efforts pour faire avancer ce projet de recherche et aussi pour son sens de l’organisation qui a pu faciliter la tâche.
Merci à madame Nathalie Bouloute et monsieur David Oliver pour le recrutement des patients. Merci à Monsieur Pierre Rompré pour son aide et sa patience lors de toutes les analyses statistiques pour mon projet.
Merci à tous les membres du jury pour vos conseils et le temps que vous aviez pris pour réviser mon mémoire. Surtout au Dr Patrick Arcache, qui a si gentiment pris son temps pour m’expliquer le fonctionnement des orthèses d’avancée mandibulaire, et qui était toujours disponible pour répondre à mes nombreuses questions cliniques.
J’aimerais également remercier le Dr Claude Remise, sa passion et son dévouement pour la profession de l’orthodontie nous inspire à chaque jour. Merci à tous les professeurs qui ont su rendre cette formation une des meilleures expériences professionnelles et personnelles de mon parcours scolaire. Merci à mes deux collègues de classe, Annie Roy et Olivier Roca, pour tout votre support et les bons souvenirs que nous avions pu vivre ensemble pendant ces trois dernières années.
Literature Review
Introduction: Obstructive Sleep Apnea
Upper Airway Anatomy
The upper airway, starting at the nares and lips and extending down to the oesophagus and larynx, serves as more than just a passage for food, air and water. As it is surrounded by a complex anatomy of muscle, cartilage and soft tissue, it plays a crucial role in breathing, speech, and gastrointestinal functions (1). The pharynx is divided into three subdivisions: the nasopharynx, the oropharynx, and the hypopharynx (2).
The nasopharynx begins at the nasal conchae and ends at the soft palate. A site of airway resistance can sometimes be found in the anterior portion of the nose, affected by the alae nasi muscles. Airway size in this area can also be affected by the thickness of the nasal mucosa, vascular congestion, as well as nasal bone structure itself (1).
The oropharynx extends from the soft palate all the way down to the epiglottis. Airway resistance in this zone can be affected by the structure of the facial bones, specifically of the maxilla and the mandible. Muscle activity, size of the lymphoid tissue and of the tongue, as well as fatty deposits in the walls of the airway can also affect resistance in this area (1).
The hypopharynx extends from the epiglottis to the beginning of the larynx. The combined space of the oropharynx and the hypopharynx makeup what is called the retroglossal space. The position of the mandible and the activity of the biggest airway dilator muscle, the genioglossus, will be the main determinates of resistance and anteroposterior dimension of this part of the pharynx (1).
The airway is not supported by any bony structure, with exception of the posterior wall of the pharynx. Due to this lack of bony support, the airway is susceptible to collapse when negative pressure during inspiration occurs. Amongst other functions, some muscles surrounding the upper airway work to maintain airway patency (3). Three major muscle groups of airway dilators exist: The palatal muscles (levator veli palatini, tensor veli palatini, muscularis
uvulae, the palatoglossus and the palatopharyngeus) work to keep airway muscle tonicity and shape intact at the retropalatal area; these muscles determine the position of the soft palate and can alter the size of the airway in this area. The genioglossus, the largest dilator muscle of the upper airway which is attached to the mandible, will work to open the retroglossal space by moving the tongue anteriorly. Finally, the hyoid muscles (mainly the geniohyoid and the sternohyoid (1), but also including the stylohyoid, mylohyoid, and thyrohyoid) determine hyoid bone position and are important in swallowing; if activated simultaneously, they will contribute to opening the airway (3) and stabilize the anterior portion of the hypopharynx (1). Pharyngeal constrictors (superior, middle and inferior) will also serve to close the airway during swallowing. Refer to Figure 1, adapted from Jordan and White for images of upper airway anatomy (3).
Figure 1. Anatomy of the upper airway. Adapted from Jordan and White (3).
Breathing during sleep
During sleep in the supine position, certain changes occur in the airway simply due to the force of gravity. The mandible and hypopharyngeal structures are pushed back, collapsing the size of the airway, and blood flow increases to the nasal mucosa (1).
The airway and its muscles no longer receive the same input as they did in a state of wakefulness (4). When awake, muscles of the airway are under both voluntary and involuntary control; however, when asleep, involuntary control takes over. Because of this, airway muscle activity drops and there is a decrease in muscle chemosensitivity to oxygen (O2) and carbon
dioxide (CO2). As muscle activity and tonicity fall, a small increase in both airway resistance
and negative pressure occurs and leads to a gradual rise in CO2. This prompts a compensation
mechanism by certain dilator muscles, specifically the genioglossus, to increase their muscle activity and open the airway (3). However, this normal function of the airway during sleep may be disrupted in some people (1) and certain populations may be at higher risk of developing obstructive sleep apnea (OSA) (5).
Pathogenesis and Risk Factors
OSA is a complex disorder with multiple risk factors and various causes. These factors may interact and contribute to the disease in different ways amongst individuals and also vary according to the severity of their OSA (6). Anatomical issues such as airway anatomy and collapsibility are the predominant factors affecting OSA. In fact, the normal decrease in airway muscle activity during sleep paired with anatomical anomalies can make the airway susceptible to collapse. Non-anatomical factors may also exist and include low arousal threshold (mild pharyngeal narrowing leading to premature awakening), impaired function of airway dilator muscles and unstable ventilatory control (high loop gain) (7).
Anatomical issues of the pharynx such as a narrow airway, specific variations in airway shape and longer airway length are also often associated to airway collapsibility (7). Airway size may differ greatly between patients, but it has been demonstrated in several studies that OSA patients usually have smaller size airways than control subjects. A relationship was also
found to exist between OSA severity and the cross-sectional area of the airway, showing people with severe OSA having smaller sized lumen versus those with mild to moderate OSA (6).
Airway collapsibility may also vary amongst patients with different levels of OSA severity (6). For example, airway collapse can occur at one or several sites (7) ; Patients with mild OSA were found to have collapse in the retropalatal area, whereas patients with severe OSA were found to have collapse in both the retroglossal and retropalatal areas; the amount of collapse was also more important in these patients. Knowing that the site of collapse is not always the same in patients with different levels of OSA severity may be important in treatment selection when trying to target certain anatomical abnormalities (6).
Other airway structures have been compared between OSA patients and healthy controls. OSA patients were found to have increased tongue size with higher fat content, enlarged soft palates, and an increased thickness in the lateral walls of the pharynx. Also, when compared to patients with mild to moderate OSA, patients with severe OSA had lower hyoid bone placement, increased length of pharyngeal airway, increased thickness in soft palates, and longer lengths between the mandibular plane and hyoid bone (6). Several studies also identify certain craniofacial characteristics as being associated with OSA as they may affect upper airway anatomy, such as a narrow maxilla, a small and retrusive maxilla or mandible, vertical growth pattern and a clockwise rotation of the mandibular plane (8).
Another important risk factor for OSA is obesity. An increase in fatty deposits in structures surrounding the airway could directly affect its anatomy and increase its susceptibility to collapse. For example, increased amounts of fat in the tongue which have been found during imaging exams may potentially impair genioglossus function. Being male is also a risk factor for OSA, however the reason why is less understood. A possibility explaining this may be that men usually have a more central pattern of weight gain then women do and larger amounts of fat may be stored in the abdomen and in the surrounding structures of the upper airway. On the other hand, certain studies have also shown that men tend to have larger or same size cross-sectional areas of the airway than women, and an increase in fatty deposits surrounding the area may not have a significant impact on the airway collapsibility. Other studies explain the male sex risk factor for OSA being related to the fact that airway length is often longer in men than in women, increasing its susceptibility to collapse. However, interestingly, the prevalence of
OSA is similar in men and post-menopausal women who have not undergone hormone replacement therapy (9). Increasing age is also another risk factor for OSA as elastic recoil in the lungs may decrease. The airway may also be more prone to collapsing due to a loss of collagen and a decrease in the efficiency of upper airway dilator muscles (10).
Diagnosis
The diagnostic test of choice for OSA is a Level 1 polysomnography (PSG) in an overnight laboratory setting, measuring the number of apnea and hypopnea events per hour of sleep: the apnea-hypopnea index (AHI) (10). A level 1 PSG is supervised by a technician (11) and can collect a minimum of seven data channels and will monitor both respiration and sleep, providing a comprehensive overview of the patient’s night (12). Sleep and wake states will be monitored by an electroencephalogram, right and left electrooculograms and a chin electromyogram. Respiration will be monitored by recording breathing effort using plethysmography bands around the thorax and abdomen, airflow by measuring nasal air pressure, temperature, as well as arterial oxygen saturation. An electrocardiogram will monitor heart activity, limb movements can be monitored by electromyography of the anterior tibialis, and body position can also be assessed (10). However, laboratory PSGs may have certain inconveniences such as long wait-times and high costs, while other diagnostic options such as home sleep studies exist (12).
The commonly used Level 3 portable home sleep study is an appropriate alternative for diagnosing OSA and may be less expensive and more accessible than a laboratory PSG. It collects a minimum of 3 data channels such as airflow, oxygen saturation and breathing effort, but may also evaluate snoring, heart rate and body position (11). It however will not monitor sleep-wake states, sleep duration, or other sleep disorders that are non-breathing-related (12). Its specificity (test accurately identifies those who do not have OSA) and sensitivity (correctly identifies those who do have OSA) levels are high, however, as OSA severity increases, its specificity improves but its sensitivity decreases (12) and as many as 17% can be false negatives (11). It therefore may not be the diagnostic test indicated for all patients.
Laboratory PSG still remains the gold standard test for OSA and its use is important when testing patients with comorbidities such as cardiopulmonary issues (e.g.: congestive heart
failure and lung disease) neurological or neuromuscular diseases, risks of hypoventilation, or a risk of having central sleep apnea (CSA). Also, considering the higher rate of technical failures and false negatives associated with home-sleep studies, a laboratory PSG should be used when a home-sleep study yields a negative result for a patient in whom the treating physician still has high clinical suspicions of OSA (11).
Classification
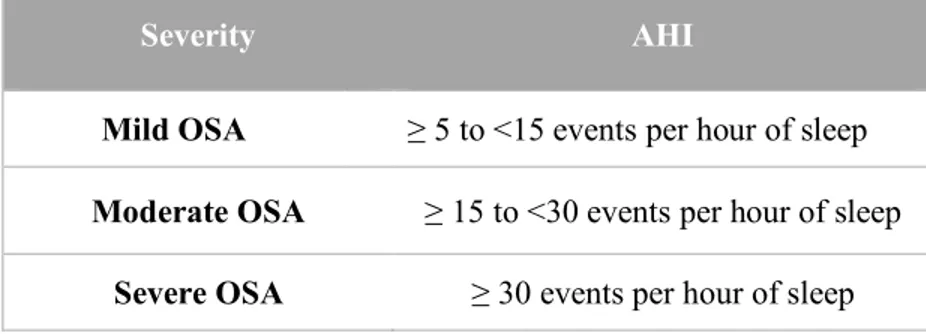
The classification of OSA severity is described in Table 1 (11); classification is based on the AHI once the appropriate diagnostic test is performed (level I PSG or home sleep study).
Severity AHI
Mild OSA ≥ 5 to <15 events per hour of sleep
Moderate OSA ≥ 15 to <30 events per hour of sleep
Severe OSA ≥ 30 events per hour of sleep
Table 1: Severity classification of OSA in accordance with the AHI.
Prevalence
With the rise of the obesity epidemic and considering the important link between obesity and OSA, the prevalence for OSA has greatly increased over the past 20 years in the general population. Prevalence differs upon age category and AHI severity. Described in Table 2, information was taken from the Wisconsin Sleep Cohort Study of 2007-2010 to identify the prevalence of OSA in the age groups of 30 to 49 years old, and 50 to 70 years old for American men and women with moderate to severe OSA (AHI ≥ 15). The prevalence of mild OSA (AHI ≥ 5 and <15) associated to daytime sleepiness was also estimated to be 14% of men and 5% of women (13).
Table 2: Prevalence of OSA in American men and women ages 30-49 and 50-70 with moderate to severe OSA.
When comparing results of the Wisconsin Cohort Sleep Study done in 1988-1994, the increase in prevalence ranges from 14% to 55% depending on the age group studied. Considering the important cardiovascular, endocrinological and neurological comorbidities associated to OSA, this rise in prevalence is alarming (13). When the prevalence of OSA was estimated in the type 2 diabetes mellitus (T2DM) population based on the average of findings from five different studies on nearly 1200 patients, the overall prevalence of OSA was found to be 71% (14).
Consequences of Obstructive Sleep Apnea
Several studies have shown strong associations between OSA and major health issues such as cardiovascular disease, hypertension, cognitive impairment, insulin resistance and T2DM ((15), (16)). The fundamental mechanisms linking these debilitating diseases to OSA remain to be fully understood and further research is needed (15). It is hypothesized that the repeated episodes of sleep fragmentation, intermittent hypoxia and micro-arousals in OSA cause an increase in systemic inflammatory markers, endothelial dysfunction and an increase in activity of the sympathetic nervous system. These systemic abnormalities which have a role to play in the pathophysiology of many diseases are thought to be at cause (17).
Age (years) Gender Prevalence
30-49 Male 10%
50-70 Male 17%
30-49 Female 3%
Cardiovascular effects
Cardiovascular disease is thought to be mainly caused by the cumulative effects of intermittent hypoxia in patients with OSA. Observations in mice experiencing intermittent hypoxia have shown that atherosclerotic effects such as formation of fatty deposits and mature plaques in parts of the aorta and an increase in size of atherosclerotic plaques occurred when other risk factors for atherosclerosis, such as a fatty diet, were present. This somewhat parallels the reality of most clinical situations in humans, as atherosclerosis is a multifactorial disease (15).
Intermittent hypoxia has also been linked to dyslipidemia, increasing circulating levels of unhealthy cholesterol in the blood. Upregulation of stearoyl coenzyme A desaturase 1 (SCD1), a lipid-synthesizing liver enzyme, has been observed during intermittent hypoxia and is in turn linked to an increase in very low-density lipoprotein (VLDL) levels, an unhealthy type of cholesterol. In fact, a direct correlation was observed in patients with higher levels of nocturnal hypoxia with OSA and increasing levels of SCD1 and VLDL. Intermittent hypoxia has also been suggested to decrease the capacity for lipoprotein clearance, another contributing factor to the development of dyslipidemia. One human study found a direct relation between increasing severity of OSA and a decrease in lipoprotein lipase activity, a major enzyme in lipoprotein metabolism (15).
Several studies have also found associations between intermittent hypoxia, oxidative stress (18) and endothelial dysfunction with increased markers of systemic inflammation in patients with OSA, such as interleukin (IL)-6, IL-8, C-reactive protein, Tumor necrosis factor-a (TNF-factor-a) factor-and others; these mfactor-arkers factor-also plfactor-ay factor-a role in the development of factor-atherosclerosis (15).
Well known risk factors for OSA such as obesity and increasing age are also predisposing factors to many cardiovascular diseases. It can therefore be difficult to separate these confounding factors and find independent correlations between them. However, research has shown that independent associations between OSA and many of these diseases do exist, including heart failure, cerebrovascular disease, cardiac arrhythmias and ischemic heart disease. A higher frequency of potentially deadly cardiovascular events during sleep have also been
noted, such as myocardial infarction, angina and arrhythmias leading to sudden cardiac death, potentially due to catecholamine surge during sleep (18).
Several studies also demonstrate a strong link between OSA and hypertension (18). The causal mechanism linking these together still requires further research, as it is complex and depends on several factors such as endothelial dysfunction, sympathetic activity, disturbances in baroreceptor reflexes and the renin-angiotensin-aldosterone system. Repetitive apneic events linked to acute sympathetic activity and cardiopulmonary issues can cause diurnal hypertension. Intermittent hypoxia stimulates carotid body chemoreceptors, which will cause a reflex stimulation of the sympathetic medullary cardiorespiratory centers. A catecholamine surge and an increase in heart rate and blood pressure will manifest, and can be more important during post-apneic hyperventilation, sometimes reaching levels as high as 240/130mmHg. Another study demonstrated that the effects of intermittent hypoxia during sleep also increased daytime ambulatory blood pressure. It also found that exposure to intermittent hypoxia increased muscle sympathetic nerve activity and decreased baroreflex inhibition, potentially contributing to an increase in blood pressure. Intermittent hypoxia has also been shown to potentially increase activity of the renin-angiotensin aldosterone system (RAAS). Periods of hypoxia could likely increase expression of Angiotensin I and also stimulation of the angiotensin II receptor in the carotid; increases in renin and aldosterone were also seen in animal studies. A meta-analysis comparing 13 studies also found that OSA patients, relative to healthy controls had increased levels of Angiotensin II, and that OSA patients with hypertension (HTN) were also found to have higher levels of aldosterone than OSA patients without HTN. Following treatment with CPAP, a decrease in blood pressure was seen, along with a decline in both markers (18). Studies have also found CPAP and oral appliance therapy to be effective in reducing both systolic and diastolic blood pressure (19) and also inflammatory markers such as C-reactive protein and IL-6 (15).
Cognitive impairments
Excessive daytime sleepiness (EDS) is a common characteristic of patients with OSA, however, it is not experienced by everyone, and nor is it proportional to the severity of OSA based on AHI. It can be a serious and debilitating issue caused by sleep fragmentation, micro
arousals and repetitive interruption of normal sleep architecture. Other neurological and cognitive effects have been related to EDS, such as loss of memory, a lesser ability to concentrate, psychosis, changes in mood, decreased libido and irritability. These impairments can possibly affect quality of life and may explain why some patients with EDS also have a higher incidence of depression. In fact, the comorbidity of OSA and depression may also indicate that both diseases share certain neurobiological factors. The serotoninergic system has an important role in regulating mood and controlling airway muscle tone during sleep. A decrease in serotoninergic neurotransmission can be seen in depression and is usually a cause for sleep alteration. On the other hand, serotonin reuptake inhibitors, a commonly prescribed antidepressant, can also be used to help improve OSA as it may act on muscle tone during sleep (16).
The importance of identifying signs of depression in the OSA population is crucial as it can have a significant impact on patient well-being. Commonly used questionnaires such as the Beck Depression Inventory (measuring depression level) and the Epworth Sleepiness Scale (ESS) (measuring daytime sleepiness) can be used to asses this. In a recent controlled study by Yosunkaya et al. (16), there was no significant difference found between BDI scores in patients with and without OSA. However, a positive correlation was found between higher scores in the BDI, ESS, and the amount of time spent under 90% arterial oxyhemoglobin saturation (SaO2)
in patients with OSA. The study therefore concluded that patients with OSA who spent a large portion of the night under 90% SaO2 experienced more EDS and were more likely to express
symptoms of depression. They do also state that symptoms of depression and EDS were not related to the severity of OSA based on the AHI, as some patients with very severe OSA did not experience EDS. The authors however mention a study performed by Klonoff et al. (20), where symptoms of depression in the OSA population were not more frequent than in those with other chronic illnesses. It can therefore not be stated that OSA causes depression, however the importance of screening OSA patients for depression should be noted (16).
Effects on glycemic regulation
A large number of studies have linked OSA to the development of T2DM, insulin resistance, and altered glucose metabolism. Before exploring the mechanisms linking OSA to these health issues, an overview of Diabetes Mellitus (DM) will be presented.
Definition of Diabetes Mellitus
DM being one of the most common endocrine disorders (21) is a metabolic condition affecting the regulation of blood glucose leading to hyperglycemia. A lack of insulin secretion, defective insulin action, or a combination of both of these issues can be the cause of hyperglycemia (22).
Classification of Diabetes Mellitus
Several types of DM exist based on different causal factors. Types 1 and 2 will differ in terms of management and it is therefore important to differentiate between these types (22).
Type 1 Diabetes Mellitus (T1DM)
The major cause of T1DM is pancreatic β-cell destruction often caused by an autoimmune process or due to an unknown cause (22). Certain environmental and genetic factors may also be involved (23). Onset usually occurs at a much younger age than T2DM (24) and patients may be more prone to ketoacidosis (22), a severe and acute complication resulting from insulin deficiency, lipid breakdown and the accumulation of ketones, leading to potentially fatal acidosis of the blood (25).
Type 2 Diabetes Mellitus
T2DM is a chronic endocrine condition with major contributing factors such as obesity, excessive caloric intake and insufficient physical activity (14). It presents a range of issues from major insulin resistance with relative insulin deficiency to an important problem with insulin secretion with insulin resistance (22).
Gestational Diabetes Mellitus (GDM)
GDM occurs when glucose intolerance appears for the first time during pregnancy (22). If left untreated, it may lead to an increased risk in maternal and perinatal morbidity (26).
Prediabetes
The term prediabetes can be used to indicate people who have a higher risk of developing DM and is characterized by having an impaired glucose tolerance, an impaired fasting glucose, or a glycated hemoglobin of 6.0 to 6.4%. Not everyone with prediabetes will develop DM and it is possible for someone with impaired fasting glucose (IFG) or impaired glucose tolerance (IGT) to even revert back to normal glycemic levels. People with prediabetes do not have a higher risk of developing microvascular disease like people with DM do, however, they are at higher risk of developing cardiovascular disease. A stronger link was found between IGT and cardiovascular disease than with IFG, and people diagnosed with both IFG and IGT have a greater risk of developing DM and cardiovascular disease (22).
Risk factors for T2DM
Risk factors for developing T2DM include being over the age of 40 years, having a family history of T2DM (such as a relative of first degree) and having a high-risk ethnic background (African, Asian, Aboriginal, Hispanic or South-Asian). Having a history of prediabetes, GDM, or giving birth to a child with a significantly high birth weight (macrosomic infant) are also predisposing factors to developing T2DM. Patients with certain vascular issues may also be at risk of developing T2DM, such as an high-density-lipoprotein (HDL) cholesterol level <1.3 mmol/L in females and <1.0 mmol/L in males, triglyceride levels ³1.7 mmol/L, having a diagnosis of hypertension, being overweight, or presenting abdominal obesity as measured by waist circumference. Patients also taking certain medications such as glucocorticoids, atypical antipsychotics or highly active antiretroviral therapy for HIV may also be at risk of developing T2DM (23).
The metabolic syndrome
The metabolic syndrome is known as a cluster of conditions predisposing the patient to an increased risk of developing cardiovascular disease. A minimum of three of the following conditions are required for its diagnosis: abdominal obesity, dyslipidemia, hypertension and increased blood glucose levels. Patients with prediabetes and T2DM often have the metabolic syndrome, and patients with the metabolic syndrome that do not yet have diabetes are at high risk of developing it. Research suggests that an aggressive approach should be taken to promptly diagnose and treat people with the metabolic syndrome in order to reduce cardiovascular morbidity and mortality (22).
Pathogenesis of T2DM
Figure 2. The development of insulin resistance. Adapted from Kahn et al (27).
In healthy patients, a feedback mechanism exists in order to maintain proper glucose homeostasis in the body. Figure 2A: Pancreatic β-cells release insulin, a hormone which mediates proper uptake of glucose, amino acids and fatty acids by specific insulin-sensitive organs such as muscles and adipose tissues. Insulin also has an effect on the liver and inhibits further glucose production. The quantity of insulin that is secreted to maintain glucose homeostasis depends on the amount of insulin required from these tissues and the level of insulin sensitivity. Figure 2B: As often seen in obese patients, insulin resistance can develop in these insulin-sensitive tissues and consequently, β-cells increase their insulin secretion in order to
maintain normal glycemic levels and a normal glucose tolerant state. Figure 2C: As insulin resistance persists, the β-cells can no longer keep up and are unable to increase insulin secretion; plasma glucose levels begin to rise and the system is in a state of impaired glucose tolerance. With time, as pancreatic β-cells continue to malfunction, glycemic levels continue to increase and diabetes ultimately develops (27). T2DM is therefore a process which involves two steps: insulin resistance and impaired insulin secretion; the impact it will have on patient health can be serious and is associated with many life-long complications, such as cardiovascular disease, retinopathy, nephropathy and issues with the nervous system (14).
Prevalence of Diabetes Mellitus
In the year 2000, an estimated 150 million people world-wide were diagnosed with diabetes; in 2012, that number rose to 371 million people, and by 2030, that number is expect to increase to 552 million or can be viewed as a diagnosis of DM for 1 in every 10 adults. The estimated prevalence in Canada in 2009 was about 6.8% of the population or 2.4 million people. By 2019, the projected estimate is supposed to increase to 3.7 million Canadians (28).
The prevalence of T2DM in the OSA population has also been investigated in several studies. Cross-sectional analyses of current research show that a higher prevalence of T2DM is found in people with OSA versus those without it. The estimated prevalence ranges from 15-30% and varies due to factors such as the studied patient population, the T2DM diagnostic method and the definition used for OSA severity. Whether OSA may cause T2DM over time still requires further investigation (14).
Monitoring hyperglycemia
Some of the most common methods used to measure glucose tolerance, insulin sensitivity and insulin secretion are described in Table 3 (14):
Method assessing glucose metabolism
Description
Fasting Plasma Glucose (FPG) and Fasting Serum Insulin (FSI)
- After fasting, plasma glucose and serum insulin levels are measured - A diagnosis for IFG can be given if FPG levels are between 100-125 mg/dl
Hemoglobin A1c (HbA1c) - Used in the clinical management of DM and is the primary target for glycemic control
- Measure taken in one blood sample and indicates glucose control over the past 2-3 months
Homeostatic model assessment index (HOMA-index)
- Index confirmed as a reliable estimate of insulin resistance - Follows a formula:
(Fasting serum insulin x FPG) ÷ 22.5
- The higher the value, the higher the level of insulin resistance
Oral Glucose Tolerance Test ((OGTT) - 2h plasma glucose (PG)
in a 75g OGTT))
- One of the clinical tests used to diagnose T2DM
- Requires the consumption of 75g of glucose, then assesses glucose tolerance by measuring levels of glucose and insulin in blood samples every 30 minutes, for 2 hours.
Continuous Glucose Monitoring System
- Test used to assess daily glucose fluctuations, specifically post-prandial and nocturnal glycemic levels
- Subcutaneous sensor used to measure glucose concentrations in the interstitial fluid.
- Continuous monitoring records levels every 5 minutes (total of 288 readings in 24h)
Hyperinsulinemic euglycemic clamp
- Insulin sensitivity is determined and quantified by the rate of intravenous glucose infusion
Intravenous glucose tolerance test - Mathematic model and confirmed test to verify glucose tolerance,
β-cell responsiveness and insulin sensitivity
- Measures glucose and insulin concentrations while fasting and then after intravenous glucose injections at different intervals for 4 hours
Table 3: Various methods used to assess glucose metabolism by the American Thoracic Society.
Diagnostic criteria
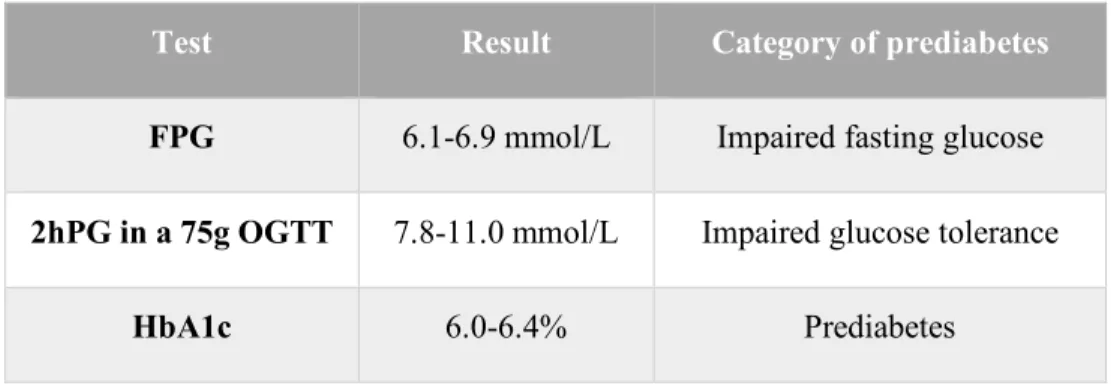
Criteria used for the diagnosis of prediabetes and DM are shown in Table 4 and Tale 5 respectively (22):
Test Result Category of prediabetes
FPG 6.1-6.9 mmol/L Impaired fasting glucose
2hPG in a 75g OGTT 7.8-11.0 mmol/L Impaired glucose tolerance
HbA1c 6.0-6.4% Prediabetes
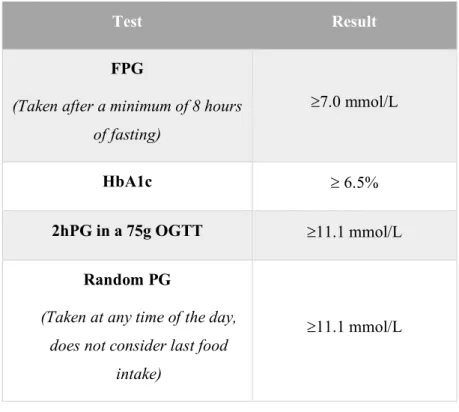
Test Result
FPG
(Taken after a minimum of 8 hours of fasting)
³7.0 mmol/L
HbA1c ³ 6.5%
2hPG in a 75g OGTT ³11.1 mmol/L
Random PG
(Taken at any time of the day, does not consider last food
intake)
³11.1 mmol/L
Table 5: Different tests and results required for the diagnosis of DM.
Each test may have different advantages and disadvantages and selection is left up to the discretion of the clinician in charge. If only one test is performed and results are in the diagnostic range of diabetes and the patient does not present any symptoms of hyperglycemia, a second test on another day must be performed to confirm the diagnosis of DM. When confirming this, it is ideal to repeat the same test, unless a random PG was performed, in which case another diagnostic test should be chosen to finalise the diagnosis. Once two separate tests confirm the results are above normal levels, a diagnosis of DM can be confirmed. If ever the results of these tests are conflicting, the test with the positive result for DM should be repeated. In cases where patients present symptoms of hyperglycemia, the diagnosis can be made and a confirmation test is not necessary before beginning treatment. Also, a confirmation test should not delay treatment in patients with T1DM who are often younger, lean or present symptoms of hyperglycemia (22).
Management and current treatment of T2DM
A multitude of different pharmacological treatments are currently available to help manage and treat T2DM. Treatment regimens and therapeutic goals must be customized for each patient as so many factors can affect the success and outcome of any therapy. The severity of the patient’s hyperglycemia, the possibility of inducing hypoglycemia, the effectiveness of alleviating associated micro and macrovascular complications of T2DM, encountered side effects and any pre-existing medical conditions must all be considered by the treating physician. Also, as β-cell function is likely to decrease over time and glycemic levels may become worse, T2DM therapy must be re-evaluated and may require a different approach with time (29).
Certain recommendations have been listed for the clinical management of hyperglycemia in T2DM. When HbA1c is under 8.5%, weight loss therapy and lifestyle management should be initiated immediately. If the glycemic target is not achieved after 2-3 months of doing this, treatment with an antihyperglycemic agent should begin and Metformin is the recommended drug for initial use in patients who are overweight. The treating physician may also decide to begin Metformin immediately (29).
When HbA1c is ³8.5%, an antihyperglycemic agent should be started immediately and the use of two different agents should be considered; one of the agents may be insulin. Also, when a patient has symptomatic hyperglycemia, insulin should be a part of the patient’s initial therapeutic regime. Furthermore, different classes of antihyperglycemic agents will need to be combined to metformin and/or insulin if target HbA1c is not met after 3-6 months (29).
Research has shown that combining adequate lifestyle management and the use of metformin and other agents have been effective in decreasing the incidence of T2DM. Nonetheless, these forms of treatment become less effective over time and the disease remains an important economical and public health issue. Progress and development of new treatment modalities to help prevent or postpone the onset of T2DM are tremendously needed (14).
The link between T2DM and OSA
Insulin resistance can contribute to the development of T2DM and both are important risk factors for cardiovascular disease (30). The exact mechanism linking OSA and metabolic
dysfunction has yet to be fully elucidated, however substantial amounts of research indicate that intermittent hypoxia, a main component of OSA which is characterized by repeated episodes of desaturation and then re-oxygenation, plays a major role in its development. The mechanisms by which intermittent hypoxia (IH) affect glucose metabolism are numerous (31).
Both animal and human studies document the activation of the sympathetic nervous system in response to episodes of IH. Catecholamines are released and are known to reduce insulin sensitivity, insulin-mediated glucose absorption and also stimulate hepatic gluconeogenesis. Some studies have also found IH to have direct effects on the hypothalamic pituitary adrenal (HPA) axis, in turn increasing cortisol secretion. The effects of cortisol on glucose metabolism are also well documented, such as insulin resistance and inhibiting insulin secretion (31). Sleep fragmentation was also found to increase the activity of the HPA axis, increasing cortisol levels and inducing atypical glucose metabolism. Animal studies have also shown an association between sleep fragmentation and both glucose intolerance and insulin resistance (32).
IH has also been found to activate nuclear factor kappa-light-chain-enhancer of activated B cells (NF-kB). NF-kB is a key regulator of the inflammatory response and unravels a strong production of inflammatory mediators such as TNF-a, IL6, IL8, and monocyte chemoattractant protein (MCP1), which are known to decrease insulin sensitivity in the liver and fatty tissues. Excessive production of reactive oxygen species was also documented during periods of IH, increasing oxidative stress, which was shown to increase lipid peroxidation in liver and pancreatic β-cells, increasing β-cell dysfunction and decreasing insulin secretion (31). Other animal studies have also linked IH to decreased β-cell function, increasing levels of fasting glucose and developing insulin resistance (32).
Strong evidence suggests the link between OSA, T2DM and insulin resistance in overweight and obese patients. Whether this link exists independently of obesity and other confounding factors is possible, however, needs further examination. A recent study by Pamidi et al. investigated glucose metabolism in non-overweight men with and without OSA. Both groups were clear of cardiometabolic disease and other health issues, had normal systolic and diastolic blood pressures as well as fasting lipid measures. Using men between the ages of 18 and 30 with body mass indexes (BMI) ranging from 18 to 25 kg/m2, this is one of the first studies
to investigate the effects of OSA on glucose metabolism in healthy, young and lean men. OSA and control subjects were matched according to similar age, BMI, fitness level, family history of diabetes and diabetes risk based on ethnicity. After an oral glucose tolerance test, patients with OSA were found to have 27% lower insulin sensitivity and 37% higher levels of total insulin secretion than controls; however, glucose levels did not differ significantly. These signs of insulin resistance as well as increased levels of insulin secretion are compatible with T2DM’s natural progression, where initial stages involve insulin resistance, normal glycemic levels and compensatory hyperinsulinemia. The results also support the hypothesis that OSA may alter glucose metabolism at a young age, even in patients who are not obese and do not have any cardiovascular disease (33).
Results for fasting glucose and insulin levels as well as the insulin sensitivity index (the HOMA-IR, which is also based on fasting glucose and insulin levels) did not differ significantly between groups. In contrast, other previous studies had indeed found a link between OSA, its level of severity and the HOMA-IR; these studies were however conducted in a lean, middle-aged Asian population presenting health conditions for which they were already being treated, such as hypertension, dyslipidemia and T2DM (33).
One particularity of Pamidi’s study (33) on young lean men is its way of defining the AHI: calculating the total number of apneas and hypopneas per hour, however considering a hypopnea as a drop in nasal pressure of ³50% of its original value and associated with either a ³3% oxygen desaturation or an arousal. In certain larger population-based studies, hypopneas followed a stricter definition of reduced airflow with ³4% desaturation and without considering arousals in their criteria. When data was recalculated using the latter definition of a hypopnea (³4% desaturation, without considering arousals), the number of patients diagnosed with OSA (AHI>5) was significantly reduced. This suggests that when using only desaturation data and disregarding arousals, OSA may not be properly identified in the young and lean population (33). A previous study by Guilleminault et al. supports the relevance of arousal use in OSA diagnostic criteria in this specific population, since lean patients tend to desaturate less than obese patients. This is thought to be due to lean patients having better functional reserve capacities and less ventilation perfusion mismatch, leading them to have less important oxygen desaturation per hypopnea, however still presenting other key features of reduced airflow and
arousals. This is therefore an important consideration when diagnosing OSA in lean patients (34).
Another important point in Pamidi’s study (33) on young lean men is that most patients in the sample were found to have mild OSA and physiological events during sleep were essentially related to arousals, not extreme oxygen desaturation; this led to an increase in sleep fragmentation and less deep slow-wave sleep. Two previous studies ((35), (36)) also found similar results in healthy, young individuals when evaluating the effects of sleep fragmentation and reduced amounts of deep slow-wave sleep on glucose metabolism, where an approximate 25% reduction in insulin sensitivity was found. These two studies also showed that sleep fragmentation increased sympathetic nervous system activity, possibly explaining the mechanism linking insulin resistance to changes in sleep quality (33). Evidence in other studies also found that IH induced in heathy patients increased blood pressure via sympathetic nervous system activity and also decreased insulin sensitivity ((37),(38),(39)). Further research is required to assess if changes in insulin and glucose levels in patients with OSA may progress into long-term clinical T2DM, or if treatment of OSA may help reverse these negative effects (33).
A recent study by Seicean et al. (40) performed an analysis on a subset of data taken from The Sleep Heart Health Study (41), a multi-center cohort study from 1994 to 1999. Seicean et al. found an association between OSA and a greater prevalence of prediabetes and occult diabetes in the non-overweight but older population. Although the number of non-overweight patients in the study was limited, the results still demonstrated an independent link between sleep-disordered breathing (SDB) and distinct measures of impaired glucose metabolism (IFG, IGT, IFG+IGT and occult diabetes) in both overweight and non-overweight groups, independently of BMI or waist circumference. In fact, both overweight and normal weight groups showed similar strengths of association between SDB and glucose irregularities, supporting the hypothesis that the mechanism linking the two together is not dependent on adiposity. As previously stated, the effects of certain physiological events during OSA such as intermittent hypoxia, sleep fragmentation, hypercapnia and micro-arousals may be at cause (40). The study by Seicean et al. also found that occult diabetes and combined measures of IFG and IGT were found to be significantly more prevalent in patients with SDB than those
without it. The presence of combined IFG and IGT appears to have a significant clinical impact as data suggests that this issue may present more severe dysfunction in insulin secretion, action and endogenous glucose production relative to problems with IGT or IFG alone. It has also been shown that patients with combined IFG and IGT have a higher risk of rapid progression of cardiovascular disease, T2DM as well as premature death (40).
A correlation also seems to exist between higher OSA severity and poorer glucose control. A study by Aronsohn et al. in diabetic patients evaluated the relationship between untreated OSA and its level of severity with HbA1c levels, compared to patients without OSA and after controlling for confounding factors such as BMI, age, race, total number years with diabetes, total number of medications used for diabetes, sex, level of physical activity and total hours of sleep (42). Results showed that patients with mild OSA had levels of adjusted mean HbA1c that was increased by 1.49% versus patients without OSA. Patients having moderate OSA had an increase by 1.93%, and patients with severe OSA had an increase by 3.69%. A positive correlation was also found between increasing levels of HbA1c and measures of OSA severity, such as total AHI, rapid eye movement (REM) sleep-AHI, and ODI during total and REM sleep (42).
Obstructive Sleep Apnea Treatment
Over the past few decades, important progress in the field of sleep medicine has led to better diagnosis and treatment of OSA. Multidisciplinary management is often required, and several different treatment options exist, such as positive airway pressure therapy, oral appliance therapy, positional therapy, behaviour management, weight loss and bariatric surgery, a variety of surgical procedures of the upper airway and maxillomandibular advancement surgery (43). Several factors such as OSA severity, patient preference, airway anatomy and different health factors should all be considered before selecting the appropriate treatment option (44).
Weight loss
As previously discussed, studies have shown obesity to be an important risk factor for OSA as over 70% of OSA patients suffer from obesity. An important relationship exists between AHI and BMI and losing weight should be encouraged as a first form of treatment for all
overweight patients with OSA (43). Although weight loss may improve AHI, the cure rate by diet alone remains low and should be associated to another form of treatment for OSA. A sleep test should be performed after important weight loss (over 10% of body weight) to identify if treatment by positive airway pressure (PAP) – discussed below – is still required or if PAP levels need to be adjusted. Studies have also shown that bariatric surgery may improve or even eliminate OSA and may be indicated in people with severe obesity and with whom conventional weight-loss techniques were unsuccessful. Long-term follow-up remains important as the rate of remission for OSA is 40% two years post bariatric surgery (44).
Treatment with Positive Airway Pressure
Treatment with positive airway pressure was first introduced by Sullivan in 1981 and is currently the gold standard treatment for moderate to severe OSA (45). PAP is either delivered through the nasal passages, the oral cavity, or both, and acts as a pneumatic splint to prevent airway collapse during sleep (44). Refer to Figure 3, adapted from Gordon and Sanders for illustration (46). The amount of pressure needed to maintain patency differs amongst patients and OSA severity and must be increased above the airways’ “critical value” in order to prevent collapse from occurring (43). The ideal pressure level should be determined individually for each patient by either a full-night or split-night titration study. Other PAP systems exist for CPAP intolerant patients, such as the bilevel mode (BPAP), or the autotitrating mode (APAP). BPAP may be an alternative for patients requiring high PAP levels but find it difficult to exhale against the continuous and fixed pressure delivered by CPAP (44). APAP mode may provide more comfort and has a slightly better compliance rate than CPAP as it automatically titrates the pressure it delivers according to specific factors such as sleep stage, posture and nasal congestion (43).
Figure 3. A – Airway collapse during sleep. B – Airway maintained open by positive pressure via nasal passage.
Adapted from Gordon and Sanders (46).
In cases of mild OSA (AHI ³5 and <15), treatment by PAP is indicated if the patient presents symptoms affecting mood, excessive daytime sleepiness, cognitive dysfunction, or in the presence of comorbidities such as hypertension, coronary artery disease, or a past cerebrovascular accident. In the presence of moderate to severe OSA (AHI ³ 15), treatment by PAP is indicated as the first choice of treatment regardless of patient symptoms or associated comorbidities. Substantial amounts of research have shown the effectiveness of CPAP in controlling the symptoms and consequences of OSA, however, its efficacy is highly dependent on its continued use. Symptoms may recur only 1-3 days after stopping treatment, therefore patient compliance is of extreme importance (43). Certain unwanted side effects may diminish patient acceptance if they are not rapidly addressed. One of the most frequent reasons for abandoning CPAP treatment is mask discomfort. Other side effects include conjunctivitis and noise due to mask air leaks, nasal congestion, dryness of the mouth, skin irritation, swallowing air and bloating (47). Whether it is due to discomfort caused by side effects or the unwillingness to sleep while attached to the machine, adherence is a major problem and patient compliance with CPAP varies from 50% to 80% (43).
Oral Appliance Therapy
Although not as efficient in as many treatment outcomes as CPAP (44), oral appliance therapy has become increasingly popular over the past decade and is now recognized as an important alternative to CPAP treatment for patients with mild to moderate OSA, as well as patients with severe OSA who are intolerant to CPAP (43).
The most frequently used appliance is the mandibular advancement device (MAD), which anchors itself on both maxillary and mandibular dental arches and serves to advance and hold the lower jaw in an anterior position. In doing so, the base of the tongue also moves forward and pharyngeal fat pads move laterally away from the airway, allowing the upper airway to widen in its lateral aspect and also improves the function of dilator muscles, specifically the genioglossus. Airway collapsibility and the AHI are therefore reduced when MADs are used on appropriately selected patients. Some common but temporary side effects may include hypersalivation, gingival irritation or dry mouth. Other side effects may last longer and include pain in the TMJs, changes in occlusal relationship and tooth pain (43). Conversely, studies have shown the usefulness of mandibular exercises in reducing temporomandibular joint (TMJ) pain (48), as well as minimizing the effects of occlusal changes and improving bite force during MAD therapy (49).
Potential MAD candidates must be thoroughly examined by a qualified dental professional to evaluate the health of the teeth, soft tissues, periodontium and TMJ before receiving an appliance; all elements of the exam must be in good condition in order to support the MAD. Panoramic or intra-oral radiographs may also be taken, dental occlusion must be examined and the patient must have acceptable mandibular range of motion. Another oral appliance is the tongue retaining device which will only maintain the tongue in an anterior position without repositioning the lower jaw (44). These devices are more recent and although they show some promising results, further research is required before they become a recommended form of treatment for OSA (43).
Patients should also be closely monitored once mandibular advancement therapy begins in order to ensure patient compliance, comfort, proper activation of the appliance and manage any unwanted side effects or pain (44). A dependant relationship is generally observed between
progressive appliance activation and improvement in AHI (50). Once the appliance is fully adjusted and the patient is comfortable, patients should undergo a sleep study to evaluate treatment efficacy and its impact on AHI and oxyhemoglobin saturation; resolution of clinical signs and symptoms must also be assessed. Once proper titration, fit and efficiency of the device are obtained, a follow up every 6 months during the first year is suggested, after which annual check-ups are sufficient (44). Although the efficacy and success of MADs have been well demonstrated when used on appropriately selected patients, up to one third of patients still fail to respond to treatment. Younger non-obese women with milder and non-positional OSA seem to have better responses to MADs, however, predictive factors used to select patients best suited for MADs are still unclear, and further research is required to identify them (43). Obese patients (BMI > 24 kg/m2) with moderate OSA and Mallampati class 4 were found to be unlikely to
respond to MADs by one study (51), and certain investigators believe that a BMI > 35 kg/m2 is
a contraindication for MADs (52).
Although MADs were found to be less effective than CPAP on certain levels, many studies have shown better patient compliance and preference with oral devices (53). However, when comparing compliance data, results are not unanimous and research on patient preference in OSA treatment is lacking (52). Certain studies have even shown similar levels of preference between the two, or even more preference for the CPAP (43). A qualitative study showed that a patient’s experience with CPAP and MADs was not only based on physical aspects of the devices, but also depended on their lifestyle needs. Some of the most important factors that impacted treatment preference were device effectiveness, its ability to be transported, potential embarrassment with device use, and cost. Physicians should be considerate of patient’s preferences in order to select the most appropriate treatment option for them and hopefully increase their compliance (54).
Surgical treatment
Some of the first techniques developed to treat OSA involved surgery of the upper airway in order to provide a permanent solution for patients suffering from this condition (44). Surgical treatment looks to enlarge the width of the airway and eliminate the cause of obstruction in order to improve OSA. Various techniques exist and operate on different