Université de Montréal
Échantillonnage basé sur les Tuiles de Penrose
et applications en infographie
par
Charles Donohue
Département d’ informatique et de recherche opérationnelle
Faculté des arts et des sciences
Mémoire présenté à la Faculté des études supérieures
en vue de l’obtention du grade de
Maître ès sciences (M.Sc.)
en informatique
Août 2004
o
Université
(II
de Montréal
Direction des bibliothèques
AVIS
L’auteur a autorisé l’Université de Montréal à reproduire et diffuser, en totalité
ou en partie, par quelque moyen que ce soit et sur quelque support que ce
soit, et exclusivement à des fins non lucratives d’enseignement et de
recherche, des copies de ce mémoire ou de cette thèse.
L’auteur et les coauteurs le cas échéant conservent la propriété du droit
d’auteur et des droits moraux qui protègent ce document. Ni la thèse ou le
mémoire, ni des extraits substantiels de ce document, ne doivent être
imprimés ou autrement reproduits sans l’autorisation de l’auteur.
Afin
de
se
conformer
à
la
Loi
canadienne
sur
la
protection
des
renseignements personnels, quelques formulaires secondaires, coordonnées
ou signatures intégrées au texte ont pu être enlevés de ce document. Bien
que cela ait pu affecter la pagination, il n’y a aucun contenu manquant.
NOTICE
The author of this thesis or dissertation has granted a nonexclusive license
allowing Université de Montréal to reproduce and publish the document, in
part or in whole, and in any format, solely for noncommercial educational and
research purposes.
The author and co-authors if applicable retain copyright ownership and moral
rights in this document.
Neither the whole thesis or dissertation, nor
substantial extracts from it, may be printed or otherwise reproduced without
the author’s permission.
In compliance with the Canadian Privacy Act some supporting forms, contact
information or signatures may have been removed from the document. While
this may affect the document page count, it does not represent any loss of
content from the document.
Université de Montréal
Faculté des études supérieures
Ce mémoire intitulé
Échantillonnage basé sur les Tuiles de Penrose
et applications en infographie
présenté par
Charles Donohue
a été évalué par un jury composé des personnes suivantes:
Pierre Poulin, président du jury
Victor Ostromoukhov, directeur de recherche
Philippe Langlais, membre du jury
Mémoire accepté le
24 septemire 2004
iv
Sommaire
L’échantillonnage est un processus omniprésent dans le domaine de l’infographie. Notam
ment, il joue un rôle central dans l’estimation d’intégrales servant à générer des images de
synthèse. Il peut aussi servir dans le rendu en demi-ton, en traitement d’images, ainsi qu’en
modélisation géométrique. Il n’existe pas de méthode définitive qui assure les meilleurs résul
tats dans tous les cas; l’utilisation d’un échantillonnage régulier s’avère inefficace et souvent
détrimental, car il peut introduire un biais dans la solution qui se manifeste par exemple en
aliassage. Un échantillonnage purement stochastique comporte aussi ses problèmes, notamment
dans la variance des résultats. Plusieurs chercheurs se sont donc penchés sur le sujet, et il existe
d’ailleurs une multitude de stratégies d’échantillonnage utilisées en infographie.
Nos travaux de recherche portent sur l’utilisation des tuiles de Penrose pour aborder le
problème de l’échantillonnage. Il s’avère que ce jeu de tuiles comporte certaines propriétés qui
peuvent être exploitées dans ce contexte. Ce mémoire présente deux articles qui sont les fruits
de cette recherche.
Le premier article présenté, fast Hierarchicat Importance Sampling with Btue Noise Pro
perties, propose un système d’échantillonnage basé sur les tuiles de Penrose.
À
partir d’une
fonction de densité en deux dimensions, le système peut générer un ensemble de points d’échan
tillonnage avec une bonne distribution spatiale. Notre méthode donne des résultats d’une très
bonne qualité tout en se classant parmi les plus rapides.
Le second article, Fast TricmguÏated Importance Sainpted Point Sets,
propose un système
qui permet de générer un jeu de points tel que dans l’article précédent, mais augmenté d’une
triangulation Delaunay de ces points. Notre méthode exploite certaines propriétés de l’échan
tillonnage avec les tuiles de Penrose de façon à obtenir un temps de triangulation plus rapide
que les meilleures techniques existantes.
Mots Clés Échantillonnage, Bruit bleu, Tuiles de Penrose, Numérotation de Fibonacci, Rendu,
Cartes d’environnement, Triangulation de Delaunay.
V
Abstract
Sampling is a process that is omnipresent in computer graphics. Specifically, it plays an
important role in the estimation of integrals used in digital image synthesis. It is also used in
digital halftoning, image processing, as weii as geometric modelling. There is no definitive
sampling strategy that can ensure the best results in ail cases; regular sampling proves to be
inefficient and often detrimental to the quality of the resuits, because it can introduce a bias that
can manifest itself as aliasing. Pure stochastic sampling also has its problems, notably due to
the variance in the resuits. Many researchers have thus studied this problem, and there are many
sampling strategies used in computer graphics.
Our research focuses on using the Penrose tiles to address the sampling problem. It so
happens that this set of tues harbors certain properties that can be exploited
in
this context. This
thesis presents two contributions that stem from this research.
The first article presented, Fast HierarchicaÏ Importance Sampling with Blue Noise Proper
ties, proposes a sampling system based on Penrose tiles. Given an importance density function
in two dimensions, the system can generate a discrete sample distribution, in which the local
point density is proportional to the given function, with a local blue noise distribution. Our
technique is amongst the fastest, yet it is also amongst the best in terms of quality.
The second article presented, Fast Triangulated Importance SampÏed Point Sets,
proposes a
system that can flot oniy generate point sets as in the prior system, but can aiso build a Delaunay
triangulation of these points. Our method exploits certain properties of sampling with Penrose
tiles in order to obtain an efficiency greater than ah known Delaunay triangulation algorithms.
Keywords: Sampling, Blue noise, Penrose
tu,
Fibonacci numbers, Rendering, Environment
Table des matières
Remerciements
vii
1
Introduction
1
2
Articles
3
2.1
Fast Hierarchicat Importance
Sampting
with Btue Noise Properties
4
2.1.1
Résumé
4
2.1.2
L’Article
5
2.1.3
Discussion
13
2.1.4
Contribution Personnelle
13
2.1.5
Droits de publication
14
2.2
Fast TrianguÏated Importance Sampted Point Sets
15
2.2.1
Résumé
15
2.2.2
L’Article
16
2.2.3
Discussion
24
2.2.4
Contribution Personnelle
25
2.2.5
Droits de publication
25
3
Conclusion
26
Bibliographie
27
vi
Remerciements
Je tiens à remercier mon directeur de recherche, Victor Ostromoukhov. Non seulement
m’a-t-il convaincu de faire une maîtrise à l’Université de Montréal, il m’a aussi initié au monde de
la recherche et m’a donné l’opportunité d’explorer des sujets captivants. Je lui en serai toujours
reconnaissant.
Je tiens aussi à remercier Pierre Poulin et Neil Stewart, dont les conseils perspicaces m’ont
été indispensables, ainsi que Phillippe Langlais, Pierre-Marc Jodoin, et Kari Pulli. Merci au
CRSNG et au FCAR équipe pour leur soutien au laboratoire d’infographie.
Chapitre 1
Introduction
Introduction
Quand les pavages apériodiques de Penrose ont été introduits à la fin des années 1970, Roger
Penrose lui-même les catégorisait dans le domaine des mathématiques récréatives’.
À
part le
fait que ses tuiles aient inspiré la découverte d’une nouvelle classe de cristaux, les
quasicristaux,
elles ont toujours été considérées comme des curiosités.
Toutefois, certains parallèles ont déjà été observés entre ce genre de pavage et la théorie de
l’échantillonnage, ce qui porte à croire qu’il pourrait y avoir des applications utiles aux tuiles
de Penrose, mais cette piste n’avait pas encore été explorée pleinement. Dans les travaux de re
cherche présentés dans ce mémoire, nous avons entrepris de trouver et d’exploiter ces propriétés
des tuiles de Penrose, afin d’élaborer de nouveaux outils qui traitent de certains problèmes en
échantillonnage.
En infographie, on doit souvent faire appel à des techniques reliées à l’échantillonnage,
que ce soit en rendu, en traitement d’images, en traitement de géométrie, ou en vision. Il nous
semble donc clair que les méthodes qui sont présentées dans les articles suivants seront d’une
grande utilité pour le domaine de l’infographie.
CHAPITRE 1. INTRODUCTION
La
science ne consiste pas seutementà
savoir cequ
‘on doit ou peut faire, mais aussià
savoir ce qu
‘on pourrait
f
aire quand bien
même on
ne doit pas te
faire.
Chapitre 2
Articles
Ce mémoire de maîtrise est présenté sous la
forme
par article, et est composé de deux
travaux Le premier article, Fast Hiera rchi cal Importance Sampling with Bine Noise Properties,
introduit un système d’échantillonnage original basé sur les tuiles de Penrose. Le second article,
Fast Triangulated Importance SampÏed Point Sets, présente une extension au système précédent,
en s’attaquant au problème de la connectivité des échantillons, au sens de Delaunay.
Ces deux articles synthétisent bien l’axe principal de mes recherches avec le professeur
Ostromoukhov au long de ma maîtrise. Ces travaux sont le fruit d’un travail de longue haleine,
et nous espérons qu’ils seront bien reçus par la communauté scientifique en infographie.
CHAPITRE 2. ARTICLES
4
2.1
Fast Hierarchical Importance Sampling with Bine Noise Proper
ties
Ce premier article a été publié dans ACM SIGGRAPH 2004, et ses auteurs sont Victor
Ostromoukhov, Charles Donohue et Pierre-Marc Jodoin.
Une séquence vidéo qui accompagne l’article peut être téléchargée à partir du site suivant
http: //www.
iro .umontreal
.ca/ostrom/EmportanceSampiing
2.1.1
Résumé
Cet article présente une nouvelle méthode pour générer efficacement une bonne distribution
d’échantillons à partir d’une fonction de densité d’importance sur un domaine à deux dimen
sions. Un jeu de tuiles de Penrose est subdivisé hiérarchiquement de manière à générer un
nombre suffisamment important de points d’échantillonnage. Ces points sont comptés à l’aide
du système de numérotation de Fibonacci, et ces numéros servent à seuiller les échantillons
contre la valeur locale de la fonction de densité d’importance. Des vecteurs de correction
pré-calculés, obtenus par relaxation, sont utilisés afin d’améliorer le comportement spectral de la
distribution de points. La technique est déterministe et très rapide. Les temps d’échantillonnage
sont linéairement proportionnels au nombre d’échantillons exigés. Nous illustrons notre tech
nique avec le cas de l’échantillonnage de cartes d’environnement pour l’illumination de scènes
synthétiques, mais la technique se prête bien à une grande variété d’applications en infographie,
comme par exemple le traitement de géométrie, le rendu en demi-tons, ainsi qu’une variété
d’autres problèmes de rendu.
Mots Clés : Échantillonnage d’importance, Bruit bleu, Tuiles de Penrose, Numérotation Fi
bonacci, Rendu, Cartes d’environnement.
CHAPITRE 2. ARTICLES
2.1.2
L’Article
Fast Hierarchical Importance Sampling with Blue Noise Properties
5
Victor Ostromoukhov University of Montreal Charles Donohue University of Montreal Pierre-Marc Jodoin University of Montreal look 1393 seconds.Abstract
This paper presents a nouet method for efficiently generating a good sampling patiem given an importance density over u 2D domain. A Penrose tiling is hierarchically .subdixided creating a sufficiently large number of sampte points. These points are numbered us ing the Fibonacci number system, and these numbers are used10
threshold the samples against the local value of the importance des sity. Pre-computed correction vectors, obtained using relaxation, are used10improve the spectral characteristics of the sampling pat 1cm. The technique is determinislic and vety fast; the sampling lime grows linearly with the required number of samples. illus traie our technique with importance-based environment mapping, but the technique is versatile enough10be used in u large varicty
0fcomputer graphies applications, such as light transport calcula tions, digital halftoning, geometry processing, and various render ing techniques.
CR Categories: 1.3.3 [Picture/lmage Generation]: Anti-aliasing; I.3.m [Miscellaneous]: Sampling.
Keywords: Rendering, Importance Sampling, Deterministic Sam pling, Hierarchical Representation, Environment Mappïng, Digital Halfioning, Blue Noise. Lookup Tahlc-based Techniques, Penrose Tiling, Fibonacci Number System.
1
Introduction
Sampling is ubiquitous in computer graphies. Many researchers have studied how the properties0fsampling may affect the quaI ity of the achievcd results in applications such as ray tracing, Monte Carlo path tracing, motion blur, geometry processing, digi tal halftoning, etc. Nowadays, it is generally accepted that isotropic two-dimensional sampling with blue noise Fourier spectrum is well suited fora large range of applications—sec [Cook 1986], lulich
ney 1988], tShirley 1991], ]Mitchell 1991], [McCool and Fiume 1992], [Glassner 1995], tHiller et al. 2001], ]Kollig and Keller 2002], lKolIig and Keller 2003].
Oflen, these graphies applications need distributions of samples proportional 10 an importance that results from a prior treatment
(e.g.,BRDF of a surface, distribution of light energy, and geometri cal properties). The problem of 2D importance sampling with blue noise can be stated as follows:
• Given the importance density I on u domain D, as an ana lytical function or in the form0fan array of discrete values. Without loss0fgenerality, I can be normalized in such a way
thatO<I(x,y) <1 V(.v,v)E D.
• Find a set of discrete sansples, whose local density0fsam pIes (the number0fsamples per unit accu, calculated locally) is proportional to ilte importance density 1, and whosc Fourier spectrum exhibits the following properties: ta) low angular anisotropy, and tb) characteristic blue noise profile of the ra dial component, i.e., a 10w-magnitude disk around the DC term, a high-magnitude annulus that corresponds to the mean distance between the samples, and u surrounding medium magnitude background exterior to the annulus (sec more de tails in fUlichney 1987], ]Hiller et al. 2001]).
Many different techniques have becs developed in order to solve this problem. Some of them, known as relaxation techniques, can produce solutions of remarkable quality. In paeticular, Lloyd’s re laxation [Lloyd 1983] and its variants lead b centroidal Voronoi tessellations ]Du et aI, 1999]. Unfortunately, the price paid for this Figure I: A high dynamic range 1024x512 environment map [Debevec 98] sampled with 3000 point lights. In this image, importance density
is represented by the lightness of the background. It look 0.064 seconds on a 2.6 GHz P4 b generate this point set. Similar results using s hardware accelerated Lloyd relaxation ]Hoff et al. 1999] required I second, while Strttctu,-ed Importance Sampllng [Agarsval et al. 2003]
CHAPITRE 2. ARTICLES
6
quality is high: relaxation techniques arc fundamentaiiy slow be cause they have b solve, often iteratively, the probiem0fneighbor hood delermination of each point with respect to ail others. Even the tuost advanced and optimized impiernentations remain slow. The hardware-assisted implernentation of Lioyd’s relaxation [Hoff et ai. 1999] ix faster but is limited by the resolution of the frarne buffer. Sorne techniques use a form 0f stochastic sampling (dan throwing), such as the method proposed in McCooi and Fiurne 19921, where random points are added or rejected according to the proxirnity to previous points. Due to the 10w convergence rate0f
these rnethods, their running Urnes are at best in the same order as Lioyd’s. These methodsare.strictly descending and can be very sensitive b the initiai point set.
Other approaches emploed in digital haiftoning, known as error diffusion techniques (sec lUlichney 1987], ]Ostromoukhov 2001], ]Zhou and fang 2003]),areconsiderably faster because only u very limited neighborhood of each point is exantined. An exampte ofef ficient usage of enor-diffusion in gcometry processing bas been es ploited in [Alliez et al. 2002]. The main drawback oferror-diffusion is the discrete nature of the elements on which it operntes: they must be rectangular tiles with fixed spatial resolution. Ibis limita con siderably Ihe use of error-diffusion as a general-purpose sampling technique for computer graphies, where multi-resolution sampling is often needed. This drawback hua been explicitly mentioned in [Surazhsky et al. 2003] where Lloyd’s relaxation was preferred b error-diffusion.
Another fast sampling technique that could compare to ours in terms of running times would be to use u cumulative density func tion (CDF), generated from the probahility density, and to sample it with a stratified Monte-Carlo technique. Although such an ap proach can generate points that refiect the required local density, they do not folbow the desired blue-noise distribution, as showu in Figure 13. Recently, ]Secord et al. 2002] have used u similar ap proach, using sorne weH-known low-discrepancy sequences such as Halton and Sobol sequeuces (sec [Niederreiter 1992] combined with CDF, in order to distribute graphies primitives ut interactise rates, in an NPR context. Although this deterministic approach ix very promising, the convincing multi-purpose results have yet to be seeu (sec Figure 13).
In this paper, ave introduce a novel Penrose tiling-based importance sampling technique that presents certain advantages over existing techuiques. It bebongs to the family of point sampling, that is, each point ix processed independently of other points. The treatment for each point is simple and computationally inexpensive, which guarantecs the very high speed of our aigorithm. Moreover, thanks to off-une optimization and to a specially designed lookup table, the quality of the sampling ix high, approaching the quality0fcen troidal Voronoi tessellations. The size of the lookup table is reason ably srnall (typically, less than 1K of data). No data-dependent pre calculation is needed. Our technique is multi-resolution and can be successfully applied on high dynarnic range images (ave illustrate this in Section 5).
TUe test of the paper ix otganized us follows. In Section 2, ave recali some hisborical fuels and properties of Penrose tiling. in Section 3 we describe the core of our sampling system. In Section 4,ween rich the basic technique with an advanced relaxation that produces an almost perfect blue noise Fourier spectrum ut ail importance lev-cix. in Section 5,weapply, as a case study, the proposed technique
10importance-based environment mapping. Finally, in Sections 6 and 7. we discuss future work and draxv some conclusions.
2
Penrose Tiling
Figure 2: Left: Kepler’s drawing from Harmo,tice Muitdi published in 1619. This tiling inspired Roger Penrose to dixcover his ape riodic tiling composed of two marked rhombs (top right). Ttles from his original 1979 article containarrowsas matching ndes that force the aperiodicity of the tiling. Bottom right: Optical Fourier transform of the vertices of Penrose tiling obtained in 1982 by Alun Mackay.
In his book Harnton ire Mundi, he published an atlas of various tilings with regular polygons. One of them, shown in Figure 2 (left). excitcd the imagination of many mathematicians over u tong pèriod. Is il possible to tue the plane oniy with reguiar pentagons, decagons, and five-poinbedstars? According10Kepter’s draaving, it was possible if one permitted also strange peanut’shaped figures (“monsters”), such as the one visible underneath the label “Au”. In the early 1970s, u modem physicist and mathematician, Roger Penrose, avas mesmerized by Kepler’s drawing. He modified it in such u avay that he was able to tile the plane non-periodically with u similar set0ftiles. And he did much more: he found that intro ducing special matching rules such as marks on the edges of the tues avill preclude any periodic arrangements of the tues. StilI, the tiling shows a clearly identifiable local order. This tiling belongs to the fatxtiiy of aperiodicstructures, i.e.,structures wftose non periodicity is forced by the matching cules. Penrose publixhed u first account of his discovery in [Penrose 19741. Luter, Penrose pubiished a paper w’here he presented three different but tightly re bated aperiodic tiling systems avith matching rules [Penrose 1979]. One of them, shown in Figure 2 (top right), bas onlytwoextremeiy simple shapes, two different rhombs with matching rules. In 1977, Martin Gardner publtshed in his column inScienrific Anteriran,an enthusiastic account of Penrose’s discovery [Gardner 19771. After Gardner’s publication, Penrose Uhing became well-known10a large number of mathematicians, physicists, and chemists.
The Penrose tiling with rhombs xhown in Figure 2 (top right) and in Figure 3 (left) has atbracted special attention, due to its simplicity. In the eariy 1980s, Alan Mackay generalized tUe Penrose tiling to
•,4,;r;x
os, -‘
Figure 3: Left: Original Penrose biling wibh bwo kinds of rhombs. Right: An alternative representation of the same tiling, wheretUe
rhombs are split in two halves, and the pentagons of two kindsare
placed ut the vertices of tUe original fihing.
The history0fPenrose tiling ix fascinating. It 80es back to the work of]ohannes Kepler, u l7th-century astronomer and muthemutician.
CHAPITRE 2. ARTICLES
7
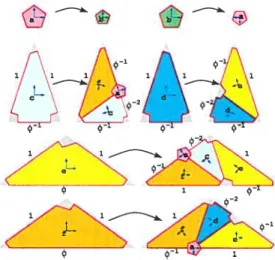
Figure 4: Subdivision rutes for modified Penrose tiling, as shown in Figure 3 (right). TheGolden Ratio
Ø
1.61803. Pairs0forthogonal vectors form the basis for eachtue.
three dimensions. He also performed an optical Fourier transform of the pattern of holes perforated at the vertices of Penrose tiling (sec Figure 2 (bottom righl), reproduced from [Mackay 19821). Ibis picture caused a sensation. In fact, it looks like a Bragg diffrac tion pattem, but it clearly violates a well-established principle, the so-called crystatiographic restriction, which states that a diffraction pattem of a crystal may have only a two-, three-, four-, or six-fold rotational symmeiry. The pattem obtained by Mackay in fact had ten-fotd rotalional symmetry! A new science0fquasicrystallogra phy was bom. In 1984, Shechtman and his colleagues synthesized a new matter, a quasicrystal, that had a diffraction pattern close to that predicted by Mackay. It was the flrst time in human history that a new kind0fmatter svas predicted and analyzed before being physically synthesized in the laboratory. Since then, hundreds0f
papers on quasicrystals have been publishcd. A corpus of funda mental papers on the physics and mathematics0fquasicrystals can be found in [Steinhardt and Ostlund 1987]. Grbnbaum and Shep hard, in their theory of tiling bible [Grhnbaum and Shephard 19861, devote a whole Section to Penrose tiling, svhere they provide a de tailed analysis.
Alternatively, Penrose tiling svith rhombs can be represented as a tiling with six shapes: both “fat” and “thin” rhombs are split into two triangular halves, as shown in Figure 3 (right). In addition, reg ular pentagons of two kinds, which we also eau “sampling tues” are placed at each vertex of the original Penrose rhombs. The pen tagons play the role of matching mies that enforce aperiodicity. The tiling can be achieved by applying on each tue the subdivision pro ccss as shown in Figure 4 (Grtunbaum and Shephard eau this sub division “inflations”). Geomettucal proportions for ail sides during the subdivision process are shown in Figure 4. Note that the size of the pentagons with respect to the triangles does flot matter. Without loss 0fgenerahty the pentagons can be taken to be infinitesimal, and the half-rhombs are triangular. The positions and Orientations
0f
tu,
schematicatly represented in Figure 4 by pairs of orthogo nal vectors that form the basis for each tue, are imporlant for our construction.Penrose tiling has attracted our attention for several reasons. First, it is obvious from a glance at Mackay’s optical Fourier transform
shown in Figure 2 (bottom right) that it is surprisingly close to the blue noise spectmm, a goal we fixed for our sampling system. In fact, annuli of spectral peaks around the DC term are ciearly visible. Second, it can be easily observed that the pentagons obtained atone level of subdivision are enriched by the pentagons0fthe next level, which are placed between the pentagons of the previous level (sec Figure 5).
Although another famous aperiodic tiling, Wang tiling, bas recently been successfuily exploited in computer graphies for the generation of Poisson distributions0fpoiflts ]Hiller et al. 2001], [Cohen et al. 2003], Penrose tiling has been used only in the context ofvisualiza tion of decorative properties of the tiling (sec for exampie [Glassner 1998]).
Leve1nLeve1n&rO1 Level e*1
‘ ..
2.
Figure 5: Two consecutive subdivision levels of Penrose tiling. Red dots mark sampling tues of lesel n, blue dots—that of level n+I.
3
Two-dimensional Penrose-based Hierar
chical Importance Sampling
Let us consider the Penrose subdivision process shown in Figure 4 as a recursive subdivision process. A speciai binary code called F-code is assigned to each tue. This subdivision process can be described by the following produclion mies:
—{hs} {a,} {Jjsi*.eto.ajo*} {e0.d1o}
f
—{eo*.dio*,foi*.aoi*},where x5 means a tile of type x having F-codey. The symbol ‘*‘
replaces the F-code of a tue before subdivision. Each subdivision left-concatenatestwosymbols to the curreni F-code. Thus, after n subdivisions, the code svili have the length of 2,i symbols. F-codes can be interpreted as integer numbers in the Fibonacci num ber system as described in [Knuth 1997] and [Graham et al. 1994]. Appendix B provides some basic facts about the Fibonacci number system, together svith the pseudo-code of the routine FIBOTODEc
IMALthat converts F-codes to the conventional decimal representa tion.
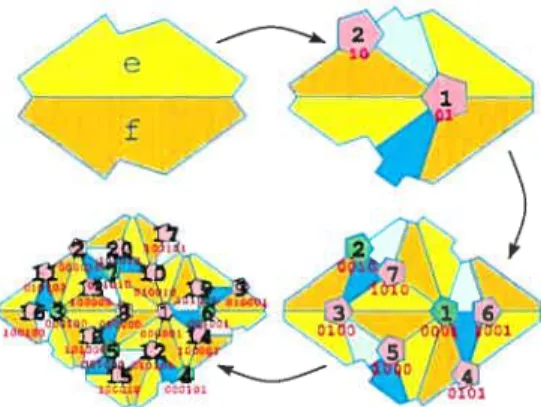
Figure 6 shows the flrst three subdivisions applied to a pair of tiles of type ‘e’ and ‘f’ (top left).
Three important observations can be made:
• Decimal numbers that correspond to F-codes assigned to pen tagonal sampling tues0ftype ‘a’ and ‘b’ are ail in the range [I..(F2(,_t)—I
)],
where n is the subdivision level0fthe initiaitues, and F are the Fibonacci numbers.
• Successive subdivisions enrich sampling poinis obtained with theprevious subdivisions, putting new sampling points in be
Pr,,rose :
CHAPITRE 2. ARTICLES
$
• Decimal numbers already assigned at a subdivision level n svill remain at the .same positions during ail further subdivi sions. The principle0fthis distribution is similar to that of Bayer’s dispcrsed-dot dither [Bayer 19731, [Foley et al. l990[ or that0frotated dispersed-dot dither [Ostromoukhov et al.
I 994].
This allows us to build an adaptive importance sampling sys tem based on the Penrose subdivision system with the production mIes (1). Our adaptive importance sampling system is simple. First, we cover the area of interest, where the importance is defined, with a pair of tues0ftype e’ and ‘f’, as shown in Figure 6 (top left). Then, we apply the recursive subdivisïon process according to the production rules (1). We stop subdividing when the required local subdivision level w is meached. In this case, we output the center0f
the ‘a’ and ‘b’ type tiles, if the local importance is greater than the decimal value of the F-code of the current tue. Pseudo-code for this algorithm is shown in Appendix A.
Importance density may be scaied by a factor
xnag,
constant for the entire importance density image, in order to obtain the desired number 0f points. This effect is illustrated in the companion video’. The required local level of subdivision w can be detemmined asw logr max(mag. (2)
where
fi
is the usual notation for ceiling,J(x.y)is the importance value at position (x,y), and is theGolden Ratio. The fac tor logg1 can be explained as the factor of self-similarity0fPenrose tiling. In fact, from one level of subdivision to the next, the area of Penrose tues diminishes by factor2•The value maxiitef.) can be achieved with standard scan-conversion on the triangle, for tiles of type ‘c’, ‘U’, ‘e’, and ‘f’ (no scan-conversion is needed for tiles0f
type ‘a’ and ‘b’ that are supposed to be infinitesimal). This scan conversion is opened to possible optimization. If less precision is required but speed is capital, the importance can be tested only at a few points within the tile.
4
Lookup Table-based Relaxation
To improve the spatial distribution of the sampling points, tve create a table of corrective vectors, which is used at run-time to relocate the sampling points. These corrective veclors, expressed in terms0f
Refore Relaxation Corrections After Relaxation
• • •. . . .. GO 0b0 • • •.
0e • . . •
• . • • e .. . • .
b • • • • .•
Figure 7: Lloyd’s relaxation apphed on sampling point set0f COfl
stant importance, produced with ocr Penrose tiling-based syslem. Small corrections are shown as yellow lines connecting the centers of uncorrected (blue) and corrected (red) sampling points.
;
8Io
)45 1D7I
.
Figure 8: Structural indices obtained by converting the 6 most significant bits of the F-code assigned to each tile to the conven tional decimal representation. Only sampling (pentagonal) tiles are considered. In this figure, we use identical colora for tiles of type ‘b’ and c, ‘U’ and ‘e’, to better visually identify the structure. No tice how the local neighborhoods around tiles with the same la bel are similar, after rotation. Highlighted are the neighborhoods around pentagons labeled with j0 5.
orthogonal basis proper to each tue, will have the effect of “relax ing” the point distribution. Sec Figure 7 and the companion video’. Unfortunately, even though there are only two different sampling tues, the fact that Penrose tiles 611 the plane aperiodically makes it impossible to account for every possible correction vector. Nev ertheless, the self-similar nature0fthe tiling can be hamessed to obtain u limited number of corrective vectors. To accomplish this, we relabel the sampling tiles with whatwecail a “structural index”, i., which is calculated from the flrst six bits of theirF-code (sec Fig ure 8). This gives a total of 21 different labels (the maximum value encoded with the F-systcm over 6 bits). Bach of these 21 labels bas a cormesponding corrective vector. This six-bit structural indexing has been found experimentally.
Because these corrective vectors have to be representative0fany importance density function, wc must optimize them with regards to different importance values. We chose to optimize the vectors overn importance values that are represented by what we call the “importance index”, j5. which is calculated as follows:
ii
Ln
.i(rrtag
.I(x,y))] (3)where
[J
is the usual notation for the800m,1(x.v) la the importance value at position (x,y) andw()maps a reat number onto the intemval[0.. 1]. We found Ihal withn=8 we gel rathem smooth gradations
across importance values.
The mesulting corrective vectors optimized over each importance Figure 6: Three subdivisions according10the production mules (I).
Only the F-codes of pentagonal sampling tiles are shown (in mcd), togethem with corresponding decimal values (in black).
‘Siggraph 2004 Full Conference DVD-ROM; also avaitable on the web site of the flrst author: wwsv.iro.umontreal.ca- ostromllmportanceSampling
CHAPITRE 2. ARTICLES
9
Levers 0f Subdaison
Figure 9: A typical importance map sampled with our system. Blue dots indicate the centers0fthe sampling tiles. Yellosv unes show lookup table-based corrections applied on sampling points. Red dots show the corrected sampling points. Please note seamtess tran sitions between zones of different levels of subdivision. valuearestored in a $ x 21 Iookup table where the first index is addressed by the importance index15 and the second dimension iv addressed by the structural indexi5.
The procedure used to generate the lookup table is the following. First, we initialize the lookup table with zero vectors. Then, for each importance index,ii,,we apply the following process.
1. With our sampling system, create a large patch of sampling points that correspond to the current importance, using the latest version0fthe lookup table for corrections as will be explained belosv.
2. Apply Lloyd’s relaxation on this set. Be careful to make pe ripheral points immovable. This is needed because the patch is finite. Sec Figure 7.
3. For each sampling point, calculate the difference between the unconected position and the relaxed position.
4. Calculate the mean value of correction vectors, for ail sam pling 111es with the same structural indexj5. Store the results in the table at position (i5.,i’).
5. Repeat sleps (I )-(4) until convergence is attained (typically 5
1010 iterations).
Considering the lookup table as a vector field, a 10w-pays filter iv then apphed to the vectors across importance indices. Then, the whole process is repcated until convergence is attained (typically 5 to 10 iterations). Thus, relaxation and 10w-pays filtering are applied alternatively.
At the end of the optimization, the corrected points closely match those obtained by truc Lloyd relaxation, for ail importance levels. The 10w-pays filtering between each iteration ensures that the points will be distributed adequately over gradients in non-constant impor tance density functions.
Figures 9, 13 (top), 10, and Il (top right) illustrate the results achieved with our system. Please note how our technique captures nuances0fimportance in aIl subranges of the dynamic range.
Irvpeetvnce Rodai Compoeeef
Figure 10: Fourier amplitude spectrum (DVT)0fa smooth impor tance density image samplcd with 2600 points, together with its the radial component and angular anisotropy of the spectrum. Please notice the typical blue noise profile of the radial component. Several examples of lookup tables of various sizes can be found ont. Please notice that the lookup table of size 8 x 21 described here is compact, yet still gives satisfactory resuits. Larger size lookup tables are applicable as well.
5
Case Study: Environment Map Sampling
One of many applications of our technique in computer graphics iv the sampling of HDR environment maps. The idea iv to reduce the environment map to a relatively small number of point light sources, thus speeding up the integration of the incoming illumi nation. We compare our sampling system with those used in ce-cent incarnations0fthe above idea, nolablyStructured importance Sampling [Agarwal et al. 2003] andLightGen [Cohen and Debevec 2001]. Sec the companion video
This problem essentially reduces to the k-centers problem, to which there iv no known polynomial-time solution. To achieve a fast so lution, an approximation must be used. [Agarwal et al. 20031 use the Hochbaum-Shmoys algorithm, and [Cohen and Debevec 20011 use k-means clustering; both are iterative searches. In [Kollig and Keller 2003], a modifed Lloyd’s relaxation scheme iv used to dis tribute the sampling points, which iv also an iterative process. In our system, the sampling points are deterministic and the lookup table iv pre-calculated; only a thresholding operation must be performed during the sampling. Thus, we can obtain an empirical linear time approximation (time on a 2.6 GHz P4 processor):
No. of points 236 343 455 690 930 1847 3006 Time in mv 6 9 12 17 22 42 64 The resulting sample distribution compares well with the other lechniques. The running times, though, are several orders0fmag nitude lower. In order to obtain running times similar to our system,
e sers . -, ... . . b .‘:‘.‘.:.‘.‘‘‘ . . C
Siggraph2004Full Conference DVD-ROM; also availabte on the web site of the Iirst author: wsvsv.iro.umontreal.cai- ostromllmportanceSampting
CHAPITRE 2. ARTICLES
10
one could use the cumulative importance density function sampted with a stratificd Monte-Carlo sampling patlern or low-discrepancy sequcnces, as shown in Figure 13. As mentioned before, the resuit ing sample points do flot exhibit a blue-noise distribution. Whether a blue-noise distribution of the lights in better in this context can be debated, but that in beyond the SCOP0fthis paper.
With the relative speed of our system, the boltteneck quickly be cornes the rendering process. With a rendering system that could handle a few hundred lights in realtime, it would be possible tu sim ulate distant illumination svith dynamic maps at interactive frame rates, using our sampling system.
Sec Figures I and Il and the companion video.
6
Discussion and Future Work
Several important notions are given in this paper without formaI proof. For example, the property of uniformity of point distribution introduced in Section 3 must be thoroughly studied and adequately presented. This in n considerable work that goes far beyond the scope of this paper. Adequate mathernatical tools for this study should be developed.
As we mentioned in Section 2, three-dimensional extension of Pen rose tiling was proposcd by Mackay more than twenty years ago; it played an important role in the discovery of quasicrystals. Con sequently, one may expect tu build a 3D construction, similar tu our construction in Section 3, svhich would result in isotropic 3D point distribution, modulated by 3D importance density functions.
Such hierarchical constructions would be useful in various com puter graphies applications. Moreover, u mulli-dimensional vari ant of our construction may exist as well. It would be helpful in varions light transport calculations where multi-dimensional impor tance density functions must be sampled (sec also [Veach 1997], [Kollig and Keller 20011, [Kollig and Keller 20021).
Sampling point sets produced svith our method are flot perfectly isotropic. One possible way tu improve our results would be study ing different available aperiodic tilings with the methodology intro duccd in this paper. Among the known aperiodic tilings that share varlous properties with Penrose tiling, sve are considering Am mann’s octagonal tiling [Grhnbaum and Shephard 1986], Socolar’s dodecagonal tiling [Socolar 19891, and Wang tiling [Grhnhaum and Shephard 1986], [Hiller et al. 2001], [Cohen et al. 20031. Another way b improve isotropy would be tu use our method as a starting point for some other methods, such as weighted Lloyd’s relaxation, which will then converge in mach fewer iterations.
7
Conclusions
Let us summarize the contributions0fthis paper.
First, we have proposcd an original method for sequentially num bering ail vertices0fPenrose tiling, based on the Fibonacci flamber system. The Penrose tiling is used as an underlying structure for a recursive subdivision. The numbers associated with the tiles are used as thresholds in the sampling process.
Second, we improve the above system with corrective vectors to
en-r)
r)
Figure Il: Galileo’s Tomb environment map, sampled withIeft: LighrGen, center: Structured Importance Samphng, and right: our system. The map size is 1024 x 512, the number of samples is 300. On a 2.6 GHz P4, sampling times were: left: 45 minutes, center: 25 seconds, right: 8 milliseconds.
CHAPITRE 2. ARTICLES
11
sure blue noise properties of the sampling point distribution. This lu achievedthrough anoff-une Lloyd relaxation scheme. The cor rective vectors obtained in the optimization are stored in atwo
dimensional Iookup table.
Our technique is very fast becausetherequired processing persam
pling point ix simple. The processing time grows linearly with the number of sampling points. Typical processing time for satupting a scene with thousands of sampltng points can he measured ïn mil liseconds. Because each tue b processed independently, thc pro posed systeni s parallelizable and therefore can be efficiently im plemented withhardware.
Because of ils speed, simplicity, and multi-resolution properties combined with good quality of point distribution, our importance sampting technique may be applied in alargevariety of graphical applications.
8
Acknowledgements
For the first author, this paper represents n culmination of a very long-term research project thatgoesback to his Ph.D. thesis some ten years ago. We would liRe to express our gratitude to many peo pue who were involved al different degrees in discussions related to the present paper. Thanks10Roger Hersch, lsaac Amidror, David Salesin, Branko Grtinbaum, Przemyslaw Prusinkiewicz, Craig Ka plan, Douglas Zongker, Cric Stollnitz. Daniel Wood, Julie Dorsev, Pierre Alliec, Mathieu Desbrun, Alexander Keller, lin Patera, Mark Grundiand, Pierre McKenzie, Jean Vaucher. and NeilStewart. Ve would like to thank the anonymous SIGGRAPH review ers for their constructive and pertinent comments.Veryspecial thanks to frédo Durand and Pierre Poulin for their unconditional support and help. Finally. weareindebted to our familles for their support during the hard days of the paper submission.
Refe ren ces
AGARWAL,S.. RAMSSIOORTHt,R.. BECONOtE,S., AND JENSEN, H. 2003. Stnictured importance sampting of ensironment mips. ACM Trcms. on Graphtc.t22,3 (July), 605—612.
ALLtEZ, P., MEYER, M., AND DESERUN,M. 2002. lntemctive geometiy
remeshing.ACMTraits.on Graphir.t 21,3,347—354.
BAYER, B. 1973, An optimum method for iwo-lesel rendjtion of continuons—tofle pictures. InJEEE In:. Conf on Comntuitirations,Il—
15.
COHEN, J., AND DEBEVEC, P. 2001. LighiGen, HDRS6op piugin. http:llwww.ict.usc.edu/’—jcohen/tightgen/lightgen.html.
CORON, M.,SHADE,J., HtLLER,S.,AND DEUSSEN,0. 2003. Wang
tites for mage anA texturegeneration. ACM Trans. on Graphies 22,3 (July), 287—294.
Coog, R. 1986. Stochasticsampling in computer graphies. ACM Traits. on Graphies 5,I(Jan.), SI—72.
DEBEVEC,p. 1998. Rendering syntiietic objects into real scenes: Bndging traditional and image.based graphies xvith global illumination anA high dynamic range photography. In Proc. SIGGRAFH ‘98, 189—198. DU.Q.,FADER, V.,AND GUNZBURGER,M. 999. Centroidal Voronoi
tesseltattons: Applications and algonithms. 5MAI Reeitsi’ 31, 4 (Dec.), 637—676.
F0LEY,J.,VAN DASI, A., FEtNER, S., ANDHUGFtES,J. 1990. Fttinputer Graphies, Priitcipie.ç aitd Practice, 2nd cd. Addison-Wesley.
GARD\ER, M. 977. Extraordinary nonperiodic tiling that entiches the theory oftiles. SeieitttflcAiiteriean 236.lIE—121.
GLASSNER,A. 1995. Principies of Digital Iniage Svntitesi.s. Morgan Kaufmann.
GLASSNER.A. 1998. Andrew Glassner’s notebook: Penrose tiling. IEEE computer Graphies & ,‘tppiteatson.c 18, 4, 78—86.
GRAHASI,R.,KNUTH,D.,AND PATASHNtK,0. 1994. Coitcrete Math entatics: a fi,utidation for Co,,tputer Science. 2nd cd. Chapter 6.6. Addison-Wesley.
GRONDAUM, B.,AND SHEPHSRD,G. 986. flhings a,td Patients. SV.H.
Freeman.
HtLLER, S., DEUSSEN,0.,ANDKELLER, A. 2001. Tited btue noise samptes. InFroc. Vision Modelutg aitd Uistialtzattott, 265—272, HorF, K.,CULVER, T., KEYSER,J., LtN,M.,AND MANOCHA, D. 999.
Fast computation of generalized voronoi diagrams using graphies hard ware. tu Froc. SIGGRAPH ‘99, 277—286.
KNUTH,D. 1997, TheArt ofCotitputer Progrctntnting, tR/ttttte 1, Ftntdci ntental Algoritltiits,3rdcd. page86. Addison-Wesley.
KOLLIG,T.,AND KELLER,A. 2001. Efficient bidirectional path tracing by randamized quasi-monte cartointegrauon. Niederreite K. Fait g, aitd E Hjckeniell, Eds., Moitie Caria aiid Quasi-MoitieCarltt Method,s 2000, 290-305.
KOLLtG,T.,AND KELLER, A.2002. Efficient mtitudimensional sampting. Ctsntptiter Graphies Fartait 21, 3, 557—564.
KOLLtG, T., AND KELLER, A. 2003. Efficient illumination by high dy
namic range images. In Etirographic.c S.t’ntposiuiit oit Reitderiitg: l4tlt Etirctgrapltics IVssrk.thstpoitRendertitg,45—51.
LLOYD,S. 1983. An optintization approach to retaxalion labeling algo nthms. Intage aitd Viciait Contputatg 1,2, 85—9t.
MACKAY. A. 982. Crystattography anddiePenrosepattent. Piiv.sica
114A,609—613.
MCCooc, M.,AND FiLME, E. 992. Hierarchicatpoisson disk sampting
diso’ibudons. InPrise. Grisjtltii’t Iitteiface ‘92, 94—105.
MtTcFtELL,D. 1991.Spectrallyoptintalsampting for distributed ray trac ing. In Piste. SIGGRAPH ‘91,vol. 25, 157—164.
NiEDERREtTER, H. 1992. Rsi,tdoitt NuiiiherGe,terarioit aitd Quasi-Moitie C’arlo ,Rletitods.Soc, for Industrial and Applted Mathematics. OSTROMOUKHOV, V., HER5cH, R.,ANDAMiDROR, I. 1994. Rotated
dispersion dither: a nccv technique for digital hatftoning. In Prt,c. 51G-GR.4PH ‘94, 123—130,
OSTRDMOUKHDV, V. 2001. Asimple and efficient error-diffusion algo
nithm. In Proc. SIGGRA PH 2001,567—572.
PENROSE,R. 1974. The rote of aesthetics in pure and applied mathematical research. Bali, Iii.st.Matit.& iiAppuis. 10, 266—271.
PENROSE, R. 1979. Pentaplexiiy,n class of non-petiodic tilings of die plane. Tue Mcithenictticai Iuteiiigeitcer 2, 32—37.
SECORD, A., HEiDRtCtS, W., AND STREIT, L. 2002. Rat primitive dis
tribution focillustration.InI3tit Etiretgrcipltics lYtsrksltopoitReitderiitg,
2 15—226.
SHtRLEY, p. 1991. Discrepancy as a quality measure for sampte distribu
tions, tu Froc. Ettrograplac’.s ‘91,183—194.
SOCOLAR, J. 1989. Simple octagonal and dodecagonat quasicrystals. Pits’s
icaiRei’ite B39,10519—10551.
STEiNHARDT, P.,AND OSTLUND,5. 1987. Tue Pltysics 0f Quasicrs’stais.
World Scienflfic.
SURAZHSKY, V., ALLIEZ. P., AND GOTSMAN,C. 2003. Isotropic remesh
in8 0f surfaces: a local paramemerization approach. InFroc,tifl2iIt lut.
MesitutgRottitdiahie.
L’LICHNEY. R. 1987.Digital Haifioitmg. MITPress.
ULiCHNEY, R. A. 1968. Ditheting with blur noise.Froc. oftiteIEEE 76, 56-79.
VEACH, E. 1997. Robait Mutile C’aritt Methtids for Light Trait.iport Sintu
iatiout. PhD thesis. Sianford University.
ZHDU, B., ANtI FANG, X. 2003. lnsproving mid-tone quatity of vatiabte coefficient rotor diffusion using threshotd modulation. ACMTraits,titi
CHAPITRE 2. ARTICLES
12
APPENDIX A: Pseudo-code ofthe Adaptive
Subdivision and Sampling
ADAPTIVESAMP(t of type lite)
t Structure litecontains the fields:
2 type: [a’..’f’]
3 > LOS: LevelofSubdivision
4 t’ vertices:center if a or ‘b’, triangle otherwise 5 > Fcode
6 > magand importanceareglobal variables 7 tocaLLOS—GETMAXLOSWITHINTILE(t)
8 ifr.LOS>tocatJOS
9 then Terminal: dont need more subdivisions
10 tocatimportance niaç GETLOCALIMPORTANCE(t) 11 if t.tvpe (‘e’ or ‘d’ or e’ or ‘f)
12 then return Nota “sampling tue”: do nothing
13 iftocaliniportance>Fi BOTODECtMAL(l.Fcode)
14 thenOLTt’LTSA.tpLE(t.center)
15 return
16 cIsc Need more subdivisions
17 {ti....i,j—SonoIVtDnUSINGPRODUCT]ONRULES(t)
18 return {ADAPT]VESAvtP(tt
),
...ADAPTtVESAMP(I)}k la worth mentioning that the routines GETMAXLOSWITHIN TtcE(r) and GETLOCALIMPORTANCE(t) play a very important, aven crucial role in the algorithm. 1f,for any reason (e.g.,because
of u singularity in the importance density), they fait to evaluate the local importance/max importance, it may resuit in locally erroneous
sampuing density.
APPENDIX B:
-and F- Number Systems
Details about g- and F- (Fibonacci) number systems can be found in ]Knuth 1997] and [Graham et aI. 19941.
The 9-system is a positional number system in base Ô, where
=J.5 is the Gotden Ratio. Any rational numberx can be cx
pressed in this systèm exactly as in our conventional binary or dcc imal systems, except that instead0fusing powers of two or tan, this system employs powers of.For example, the number (101.001
)
in base Q is
3.8541t0
The Ø-system is closely related b the F-system (the abbreviation for Fibonacci system). The f-system is also a positional sys tem. Any integer n can be presented in the F-system as a sum of Fibonacci numbers F multiplied by their positional coefficients, which may be Os or I ‘s. Thus, a number n can be expressed by its
F-code (b,0b_1...
n (b,,,b,,,_1...b3b2) n Lbj. (4) The first index in the summation is
j
=2because of the consentionused for Fibonacci numbers F3:
F0=0,F1=1,F,=].F3=2,F3=3,F5=5.F6=8.F7=13.... The representation of numbers is flot unique in the F-system, but it becomes unique if the mie ofnormalform is imposed: tsvo ad jacent I ‘s are not permitted. The procedure of conversion from an arbitrary sequence of Os and l’a to the normal form, along with many other technical details, can be found in [Graham et al. 1994]. Here are the first twelve integers expressed in the F-system in nor mal form:
Figure 13: A ramp importance density image sampled with (top) our system and the cumulative importance density function sampled svith (middle) a stratified Monte-Carlo pattem, or (bottom) Sobol low-discrepancy sequence.
I=(O0001),, 2=(000IO)F, 3 (OOlOO),
4=(OOIOI)F, S=(OI000)f, 6=(O100I)F 7=(0l010)F, S’(l0000)F. 9=(I000I)F. 10= (I00I0)F, il (l0l00)f, 12= (lOlOl)f. More examples of interpretation of such sequences of Os and I ‘s, which we shah call F-codes, as integer numbers, are shown in Fig ure 6,
The routine FIBOTODECIMAL converts F-codes to the conven tional decimal representation.
FtBOTODECtMAL(Fcode)
I accuntutator O
2 fort—0 to LENGTH(fcode)—
3 do
4 accunzulator accumutator + Fcode[i( F,_
5 returnaccumutalor
Function ‘P(.r) that maps a real positiveXonto interval [0.. l[, as shown in Figure 12, is defined as follows:
(log2
si.x)
mml I.It can be easily derived from the well-known Binet’s formula F,,=
where-lis the usuat notation for the,zint(Nearest Integer) function.
08 06 0.4 02
3 8 3 21 34 55 ‘44
CHAPITRE 2. ARTICLES
13
2.1.3
Discussion
Dans cet article, nous avons présenté une nouvelle technique d’échantillonnage basée sur
les tuiles de Penrose. Pour arriver à cette fin, nous avons trouvé une méthode nouvelle de numé
rotation séquentielle de tous les sommets du jeu de tuiles de Penrose, qui se base sur le système
de numérotation de Fibonacci. Les tuiles servent de structure sous-jacente à une subdivision
récursive, et les numéros aux sommets servent de seuils dans le processus d’échantillonnage.
De plus, nous avons introduit une technique pour améliorer la distribution des points d’échan
tillonnage, qui utilise un jeu de vecteurs de correction pré-calculés, et stockés dans une table.
Corrmie le procédé de traitement pour chaque échantillon est très simple, notre technique est
très rapide. Les temps de calcul augmentent linéairement avec le nombre de points. Les temps
d’exécution sur une fonction typique pour des milliers de points se compte en millisecondes.
De plus, comme le traitement de chaque point est indépendant de ses voisins, notre système se
paralléliserait bien, et se porterait bien à une implémentation matérielle.
Grâce à sa vitesse, sa simplicité, ses propriétés multi-résolution, ainsi qu’à la bonne qualité
de la distribution résultante, notre méthode d’échantillonnage pourrait ouvrir la porte à une
grande variété d’applications en infographie.
2.1.4
Contribution Personnelle
Les idées génératrices qui ont menées aux découvertes exposées dans cet article proviennent
de mon directeur, Victor Ostromoukhov. Elles sont le fruit d’une réflexion approfondie qui
s’étale sur plus de dix ans. Mon rôle principal dans ce travail, qui a occupé une proportion consi
dérable des deux années de ma maîtrise, a été d’assister mon directeur dans ses recherches. Mon
assistance a consisté en recensement de littérature, en exploration d’applications potentielles,
dans l’implémentation d’outils de recherche, et peut-être même au niveau du support moral.
Au niveau de l’article lui-même,j’ai implémenté l’algorithme de manière efficace, de façon
à en faire des analyses de performance. Il me revient Félaboration de l’étude de cas qui a servi
à illustrer le potentiel du système d’échantillonnage, ainsi que la rédaction de la section de
l’article qui y est dédiée. J’ai aussi monté la vidéo qui y est mentionnée, et qui a fait partie
intégrante de la soumission. Finalement, j’ai eu l’honneur de présenter ce travail à SIGGRAPH
2004.
CHAPITRE 2. ARTICLES
14
2.1.5
Droits de publication
Par leur signature ci-dessous, chaque coauteur de la publication ci-jointe,
Fast Hierarchicai
Importance Smn,iing with Bitte Noise Properties [ODJO4], accorde sa permission explicite pour
que l’article soit indu tel quel dans le présent mémoire. Aussi, il atteste que ma contribution à
l’article est effectivement telle que décrite dans le présent mémoire.
Selon l’article 2.5 de la politique de droits d’auteurs de l’ACM, l’oeuvre en question peut
être inclue dans le présent mémoire, à condition que la notice suivante soit affichée:
“SIGGRAPH ACM, 2004. This is the author’s version of the work. It is posted here by
permission of ACM for your personal use. Not for redistribution. The definitive version
was published in Proc. SIGGRAPH, Vol. 23, no. 3, 2004”
CHAPITRE 2. ARTICLES
15
2.2
Fast Tnangulated Importance Sampted Point Sets
Ce deuxième article n’a pas encore été soumis pour publication. Les auteurs sont Charles
Donohue et Victor Ostromoukhov. L’article représente une continuation logique du premier ar
ticle, dans laquelle la problématique est étendue pour inclure la connectivité des points d’échan
tillonnage, au sens de la triangulation de Delaunay.
2.2.1
Résumé
Cet article présente une extension au système d’échantillonnage proposé dans [ODJO4], qui
génère une bonne distribution d’échantillons à partir d’une fonction de densité d’importance.
Notre extension consiste à générer efficacement une bonne triangulation des points d’échan
tillonnage résultants, au sens de Delaunay. Contrairement aux méthodes générales de triangu
lation de Delaunay, notre méthode exploite le jeu de subdivisions de tuiles triangulaires utilisé
par ce système, afin d’en extraire une accélération considérable. Nous proposons un algorithme
rapide, qui s’exécute en temps linéaire par rapport au nombre de points générés, en pire cas, ce
qui ne peut être accompli par aucun autre algorithme de triangulation de Delaunay connu. Plu
sieurs domaines en infographie pourraient profiter d’un tel système d’échantillonnage associé à
notre algorithme de triangulation, comme le rendu de terrain, le traitement de géométrie 3D et
la compression d’images.
Mots Clés
: Échantillonnage d’importance, Triangulation Delaunay, Bruit bleu, Tuiles de Pen
rose.
CHAPITRE 2. ARTICLES
16
2.2.2
L’Article
Fast Triangulated
Importance Sampled Point Sets
Abstract
Ibis paper presents an extension to the importance sampling sys tem proposed in[ODJO4J, which generates a good sampling pattem given an importance density function in 2D. Dur extension consists in efficiently generating a Delaunay triangulation of the resulling sampling points. As opposed to general triangulation algorithms, our mclhod harnesses the triangle subdivision scheme uscd in the ahove mentioned sampling system, in order10obtain a considerable speedup.We propose a fast algorithm Ihat runs in worst-case linear lime with regards tu the desired number of points, something Ihal cannol be achievcd with any known Delaunay triangulation algo rilhm. There are many areas in computer graphies that can benefil from such a sampling systcm in association wilh Ibis triangulation algorilhm, such as terrain rendering, 3D gcomelry processing, and image compression.
Keywords: Importance Sampling, Delaunay Triangulation, Blue Noise, Penrose Tiling.
1
Introduction
In the paper [ODJO4), a novel melhod is proposed10 gencrate a set
of discrete sampling points, given a 2D importance dcnsity func tion. The points gencrated exhihit a local bluc-noise distribution, which roughly means thal the points do not have alignmcnls or principal directions, and lhat they are are al a minimal distance wilh respecl to each other. Since Ibis system is founded on the Penrose tues, and because of ils lies wilh quasicryslallography, Ibis system shall henceforth be namedQnusisantpler, for the sake of brevily. The name also slems from Ihe systcm’s potential use in quasi-Monlc-Carlo inlegration. The point sets generated by the Quasisampler can be useful in many computer graphies contexls, namcly in image compression, where thc image could be resam pIed in an approach similar10[DACB96]; and in remeshing, whcrc thc geomctry could he resampled within a planar cmbedding, such as proposcd in {AUVDIO3j.
In cerlain typical use-cases of theQuasisampler, a triangulation of the rcsulting sampling poinls must be oblained. Consider for cx-ample the case of digital elevalion map rendering: an importance function based on the viewing position, Ihe terrain curvalure, and other such factors is passcd10lhcQuasisainpler, which relurns a set of points. In orderturender Ihe terrain to the display,atrian gular mesh must be crealed, using thesc poinls as vertices. II is oflen desirable Ihat Ihe resulting triangulation avoid narrow trian gles (‘siivers’). In Ibis conlext, Ihe Delaunay Iriangulation, which maximizes Ihe minimum angles of Ihe Iriangles, can be considered desirable.
There are several algorilhms to build a Delaunay triangulation of set ofn poinls. The more naive approaches, like incremental algorithms such as in [GS83j, typically run in0(n2). There are more efficient ones thal can run in0(,t 10git)worst case, such as the Shamos and Hoey’s divide-and-conquer approach [SH751,For
tune’s sweep-line algorithm [for86], or a randomized incrcmenlal algorilhm augmenled wilh a search structure, such as in [Dev9Sl. These are ail gencral triangulation algorithms, in the sense that Iheir
input point sets are considcrcd lobe provided by an arbitrary black-box.
In Ibis paper,wepresent an algorithm that cnn efficienlly build De launay triangulations of Ihe poinls gcneraled bythe Quasisampler.
Using a white-box approach, our technique exploils certain propcr lies that arise from Ihe hicrarchical subdivision process within the
Quasisanipler,in order 10 obtain the desired triangulation in0(n).
We also show how the algorithm gives fast results in practice, in comparison wilh other methods.
The paper is organized as follows. TheQuasisamptersystcm which our mcthod exlendsisbriefly explained in Section 2. Our triangu lation algorithm is presented in Section 3, accompanied by resuits in Section4.Conclusions and future work follow inSectionS.
2
The Quasisampler
In order10explainhowour triangulation algorithm works, we must first make a brief review of theQuasisampler, as introduced in [ODJO4]. The lhree basic steps thal thc syslem takes are illustrated in Figure 2.
First, an adaptive tue subdivision scheme is used10build an initial structure. Ibis resuits in a subdivision tree in which the leaf depths are modulated by the underlying function. The subdivision mies are based on the Penrose lues [Pen79], but the tues are aIl triangu lar, save for n pair of infinitesimal pentagonal tues. This makes for a hierarchic structure that can be built onlyout of triangular sub divisions. Also, the subdivision raies are such that ail angles are Charles Donohue
University of Montreal
Victor Ostromoukhov Universily of Montreal
Figure I An cxample of our triangulalion shown in blue, wilh ils dual in red. These are respeelively equivalent10theDelaunay tri angulalion and thc Voronoi diagram.
CHAPITRE 2. ARTICLES
L]
Input OutputImportance Sampling System
o o
ç
p
17
multiples of-,so the trigonometric opcrations can be tabulated
for specd.
Thcn, the verticcs of this structure arc numbercd, using the Fi bonacci numbcr system [Knu97]. Thc numbcrs arc uscd as a thresh old against thc importance function, in order to obtain the desired local density of points. The numbcring of the vertices is bascd on their position in the hicrarchy, and the ordinal numbering of the ver tices cnsurcs a lincar response of point dcnsity svith regards to thc importance values.
Finally, the system applies prccalculated correction vectors to the points. This tends to ‘relax’ the points with respect to thcir neigh bots and breaks the inhcrent structures in thc point set. But no prox imity qucries are ncedcd, as the vectors are applied to each point indcpcndently of its ncighbors. Thc correction vectors are storcd in a table. It tuas obtained using an iterative optimization process which involves Lloyd’s relaxation scheme [Llo$3].
We are lcft svith a discretc sample distribution, in which the lo cal point density is proportional to thc importance density function. Also, the local distributions of points have a bluc-noise spectral profile [U1i87;HOKOII,which equatcs to a low anisotropy and no principal directions or alignments. Ibis kind of distribution can be very effective in computer graphies, especiaily considering the fact that the human visual perception system is very sensitive to such ulignmcnts.
Several existing methods can be used to gcnerutc point sets with bluc noise propertics. The techniques that give good quality te suits, such as Lloyd’s relaxation buscd techniques, tend to bc slosv, whercus thc fauter techniques gcnerully fuil to mccl Ihe blue-noise requirements. TheQuasisampler in a fast approximation, yct it is amongst the bcst in terms of quality. Thc possibility of gencruting thcse good distributions ut such a high spced opens the door to many applications which were previously considered unfeusible. But, us is, the system generutes u cloud of points, uvithout thc conncctiv
ity information that is useful in many applications. We addrcss the conncctivity issue in this paper.
3
Triangulation Algorithm
In order to extract conncctivity and proximity information from a point set, it in oftcn useful to build a Dclaunay triangulation of thc set. For u set S of points in the Euclidean plane, the Delaunay tri angulation can be defincd as tise unique triangulation DT(S) of S such that no point in S is insidc thc circumcirclc of any triangle in DT(S). It eau ulso be dcfincd as the dual of the Voronoi diagram of S, as illustrutcd in Figure 1. The Delaunay triangulation is the target of our algorithm, and it can be built very quickly by harncss ing certain intrinsic propcrties of the Quasisampler. Thc main ideus behind our triangulation algorithm follow.
First, theQuasisampler uses a triangular subdivision schcmc in or der to provide the required density of output points. Ibis structure can be transformed into a proper triangulation by making sure no T-cdgcs remain. Sincc u strict set of rulcs is used to build this struc ture, it is possible to crcutc such u triangulation in linear timc, with regards to the number 0f triangles. Second, flot ail vcrtices in the structure uvill be considcrcd asactive sumpling points bccausc of the thrcsholding process, so thesc must bc climinuted from the trian gulation. The supposition we make ut this point is thut thc conncc tivity of the triangulation of the final point distribution will be vcry similur to thc conncctivity of the structure mcntioned ahovc. The QutssisampÏer displuccs the points svith correction vectors, which can leave us with an invalid topology, but we suppose that this cas bc corrcctcd in constant time ut the local (cdge) level. Finally, we can observe that the connectivity information that stems from the original structure, is vcry close to thc Deluunay connectivity after the points arc displaced. Afler a finite numbcr of conditionul edge flips, every edge is in the Dcluunay set.
Tue Subdivision
Threshold
Correction Vectors
CHAPITRE 2. ARTICLES
18
Figure 3: T-edge climination. Before on the left, after on thc right. The edges that have been added arc shown in red.
3.1 Our Algorithm
Herc is how thc aigorithm works. The prciiminary step is the
mi
tialization of thc Quasisampler, over the given importance dcnsity function, as shown in Figure 2. lnstead of simply using thc out put points, we wili use the tue subdivision tree structure which the systcm employs intcmally.
3.1.1 Base Triangulation
The first stcp is to ereatc u valid triangulation from thc underiying sampling structure, meaning there should not bc any T-edges. An efficient way of obtaining sueh u triangulation is to iterute through thc tue subdivision trce of the Quasisanipler in a width-first man ner; this bas the effect of cnforcing the following ruic: no two ad jacent triangles, which are slated to be subdivided ut a subsequent lcvel, will ever be ut more than one level of subdivision apart, at any timc during the traversai of the trcc. This svay, whenever a new ver tex nceds to be addcd to the current triangulation, it is assured that wc only need to spiit two triangles along their common cdge, which is a trivial operation. Also, on the borders of ureas at diffcrcnt lcvcls of subdivision, the triangulation remains valid becausc the triangles on both sides are spiit. This holds truc no mattcr how many lcvels of subdivision this border jumps. An example of this operation is shosvn in Figure 3. So, in order to build our base triangulation, we iterate through the Quasisampler’s subdivision trce, succcssively splitting the edges of 16e triangles according to the tilc’s geomctry, while making sure that eaeh ncw vertex holds a reference to thc ‘sampling’ tile from which it bas spawned.
Figure 6: Edge-flip test. If fit±O> sethcn the edgc e is flipped.
The triangulation obtained alibis point inciudes evcry vertex in thc tiling. The second stcp consists in the extraction of theinactive
vertices from thc triangulation. Thcsc arc the potcntial sumpling points that fail the thrcsholding step. An examplc of this stcp is shows in Figure 4. This proccss is fairly straightforward; We itcr ate through ail thc ‘sampling’ tues, and those that have failcd thc thresholding test arc markcd for extraction. finding these vertices in the triangulation is simple, beeause wc have stored rcfcrence to thc latter. The removul of a vertex from the triangulation involves thc re-triangulation of the hole it gencrates, which can be donc with or without enforcing a Delaunay constraint. We have opted for a simple grecdy re-triangulation, bccuusc the end result is thc same, while it is less computationaliy intensive hecause we avoid the cir cumcircle tests. When this greedy approach is chosen, speciai atten tion must he brought to collincar points in the rc-triangulated arca. Thc original Penrose tiling has alignmcnts in the 10 principal di rections, but, dcpending on thc numerieat precision chosen for the point representution, somc collinear points might appear siightly non-eollinear, which cun result in triangle siivers. These triangles have an unstable orientation, and ean be problematic for thc prcd icates uscd in further opcrations on the triangulation. Fortunatcly, simple coilinearity test avoids these situations, using u numerical preeision based on the icvel of subdivision at thc offending point. This deeimated triangulation svill serve as the foundation for our final triangulation.
3.1.3 Minimum Angle Edge-Fiips
The vertices of the resulting triangulation svili need to be displaccd by the vcctors provided by the sampling system; this can cause an invalid topology ut certain vertices, as shosvn in Figure 5. This lcads us to the next step in the aigorithm, which is a finite number of conditional edge-flips of thc current triangulation.
The process consists in iterating through ail the edges of thc trian gulation, and for cach one, calculating the angles at thc vertices of cach opposing side ofboth adjacent triangles, us shown in Figure 6. If these angles sum to more thansr, then the edge is flipped across the two triangles. This bas the effcct of maximizing thc minimum angles in the triangles, which brings us doser to a Delaunay trian gulation, which huppens to be minimum angle maximizing. The iteration across ail edges represents a single pass, which can cave some edges that are stili flot in the Delaunay set. In order to obtain u propcr Delaunay triangulation, a certain number of thcsc cdge flip passes must be made successively. Note that each iteration cun be constrained to tise local neighhorhood of the edges that wcre fiippcd in the iast iteration, which can greatiy reduce the number of tests from one iteration 10 the next.
—
I
- \, -S-,
Z
)K
\-.-\
.‘a.\:3.1.2 Inactive Vertex Removal
Figure 4: inactive vertex extraction. Before on the ieft, after on the right. Blue vertices have passed the thrcshoiding process.