Université de Montréal
Diversité et structure du zooplancton: importance pour la
conservation de la biodiversité aquatique en zone urbaine
par
El-Amine Mimouni
Département de Sciences Biologiques Faculté des Arts et des Sciences
Thèse présentée à la Faculté des Études Supérieures et Postdoctorales en vue de l’obtention du grade de Philosophiæ Doctor (Ph.D.)
en Sciences Biologiques
Résumé
L'écologie urbaine est un nouveau champ de recherche qui cherche à comprendre les structures et les patrons des communautés et des écosystèmes situés dans des paysages urbains. Les petits plans d’eau sont connus comme des écosystèmes aquatiques qui peuvent contenir une biodiversité considérable pour plusieurs groupes taxonomiques (oiseaux, amphibiens, macroinvertébrés), ce qui en fait des écosystèmes intéressants pour les études de conservation.
Cependant, la biodiversité du zooplancton, un élément central des réseaux trophiques aquatiques, n’est pas entièrement connue pour les plans d’eaux urbains et devrait être mieux décrite et comprise. Cette étude a évalué les patrons de biodiversité des communautés zooplanctoniques dans des plans d’eau urbains sur l’Ile de Montréal et leurs sources de variation. Des suggestions pour l’évaluation et la conservation de la biodiversité sont aussi discutées.
La biodiversité zooplanctonique des plans d’eaux urbains s’est avérée être assez élevée, avec les cladocères et les rotifères montrant les contributions à la diversité gamma et bêta les plus élevées. Sur l’ensemble des plans d’eau, il y avait une corrélation négative entre les contributions à la bêta diversité des cladocères et des rotifères. Au niveau de chaque plan d'eau, la zone littorale colonisée par des macrophytes s'est avérée être un habitat important pour la biodiversité zooplactonique, contribuant considérablement à la richesse en taxons, souvent avec une différente composition en espèces. Les communautés zooplanctoniques répondaient aux facteurs ascendants et descendants, mais aussi aux pratiques d’entretien, car le fait de vider les plans d’eau en hiver affecte la composition des communautés
Les communautés de cladocères dans ces plans d’eau possédaient des quantités variables de diversité phylogénétique, ce qui permet de les classer afin de prioriser les sites à préserver par rapport à la diversité phylogénétique. Le choix des sites à préserver afin de maximiser la diversité phylogénétique devrait être correctement établi, afin d’eviter de faire des choix sous-optimaux. Cependant, pour des taxons tels que les cladocères, pour lesquels les relations phylogénétiques demeurent difficiles à établir, placer une confiance absolue dans un seul arbre est une procédure dangereuse. L’incorporation de l’incertitude phylogénétique a démontré que, lorsqu’elle est prise en compte, plusieurs différences potentielles entre la diversité phylogenétique ne sont plus supportées.
Les patrons de composition des communautés différaient entre les plans d’eau, les mois et les zones d’échantillonnage. Etant donné les intéractions sont significatives entres ces facters; ceci indique que tous ces facteurs devraient êtres considérés. L’urbanisation ne semblait pas sélectionner pour un type unique de composition des groupes alimentaires, étant donné que les communautés pouvaient changer entres des assemblages de types alimentaires différents. Les variables environnementales, surtout la couverture du plan d’eau en macrophytes, étaient des facteurs importants pour la biodiversité zooplanctonique, affectant la richesse spécifique de divers groupes taxonomiques et alimentaires. Ces variables affectaient aussi la composition des communautés, mais dans une moindre mesure, étant des variables explicatives modestes, ce qui indiquerait le besoin de considérer d’autres processus.
Abstract
Urban ecology is an emerging research field that seeks to understand the structures and patterns of communities and ecosystems located in urban landscapes. Small waterbodies are known as aquatic ecosystems that can harbour notable biodiversity for various taxonomic groups (birds, amphibians, macroinvertebrates), making them interesting ecosystems for conservation studies.
However, the biodiversity of zooplankton, a central element of aquatic trophic networks, is still not entirely known for urban waterbodies and should be better described and understood. This study examined the biodiversity patterns of zooplanktonic communities in urban waterbodies on the Island of Montreal and their sources of variation. Suggestions for biodiversity assessment and for biodiversity preservation are also discussed.
Zooplankton biodiversity urban waterbodies proved to be quite high, with cladoceran and rotifer taxa showing the highest contributions to gamma and beta diversity. Across waterbodies, there was a negative correlation between the contributions to cladoceran and rotifer beta diversity. Within waterbodies, the littoral zone showing macrophytes proved to be an important habitat for zooplankton biodiversity, considerably contributing species richness, often with a different species composition. Zooplankton communities responded to bottom-up and top-down forces, but also management practices, as waterbody emptying in winter affected zooplankton community composition.
Cladoceran communities in these waterbodies showed varying amounts of phylogenetic diversity, which allowed them to be ranked in order to prioritize sites to preserve with regards to phylogenetic diversity. Selection of sites to preserve in order to maximize
choices. However, for taxa such as Cladocera, for which phylogenetic relationships remain difficult to establish, placing absolute confidence in a single tree is a dangerous procedure. Incorporation of phylogenetic uncertainty showed that, when it is taken into account, then several potential differences in phylogenetic diversity were not supported anymore.
Community composition patterns differed between waterbodies, months and sampling zones. Due to the presence of significant interactions between these factors, this indicates that all these factors should be considered. Urbanization did not seem to select for a single type of feeding group composition, as communities in waterbodies could shift between assemblages with different feeding types. Environmental variables, especially waterbody macrophyte coverage, were important factors for zooplankton biodiversity, positively affected species richness of various taxonomic groups and feeding groups. These variables also affected community composition, but to a lesser extent, being modest predictor variables, indicating the need to consider other processes.
Keywords: Biodiversity, zooplankton, community structure, urban ecology, littoral zone, phylogenetic diversity, evolutionary heritage, phylogenetic uncertainty, site conservation, cladoceran diversity, urban waterbodies, species richness, feeding groups, conservation management
Table des matières
Résumé ... i
Abstract ... iii
Table des matières ... v
Liste des tableaux ... ix
Liste des figures ... x
Liste des sigles et abréviations ... xiii
Remerciements ... xv
Chapter 1 ... 1
Introduction ... 1
1.1 Freshwater and its biodiversity ... 2
1.2 The importance of small waterbodies ... 4
1.3 Human interactions with waterbodies ... 7
1.4 Importance of ponds for the conservation of urban biodiversity ... 10
1.5 Study sites ... 16
1.6 Structure and objectives of this thesis ... 18
Chapter 2 ... 21
Assessing aquatic biodiversity of zooplankton communities in an urban landscape ... 21
2.1 Abstract ... 22
2.2 Introduction ... 23
2.3 Methods ... 26
2.3.1 Study sites and sampling design ... 26
2.3.2 Taxonomic analyses ... 29
2.3.3 Data analyses ... 30
2.4 Results ... 33
2.4.3 Contribution of sites, zooplankton groups and taxa to beta diversity ... 39
2.4.4 Analyses of variance and interactions ... 44
2.4.5 Redundancy analysis ... 48
2.5 Discussion ... 50
2.6 Acknowledgements ... 56
Chapter 3 ... 57
Phylogenetic diversity and its conservation in the presence of phylogenetic uncertainty: ... 57
A case study for cladoceran communities in urban waterbodies ... 57
3.1 Abstract ... 58
3.2 Introduction ... 59
3.3 Methods ... 63
3.3.1 Study sites and zooplankton sampling and analysis ... 63
3.3.2 Sequence acquisition and phylogenetic inference ... 64
3.3.3 Phylogenetic diversity measure ... 66
3.3.4 Incorporating phylogenetic uncertainty in PD estimation ... 67
3.4 Results ... 69
3.4.1 Cladoceran species richness and community composition ... 69
3.4.2 Sequence acquisition and phylogenetic inference ... 71
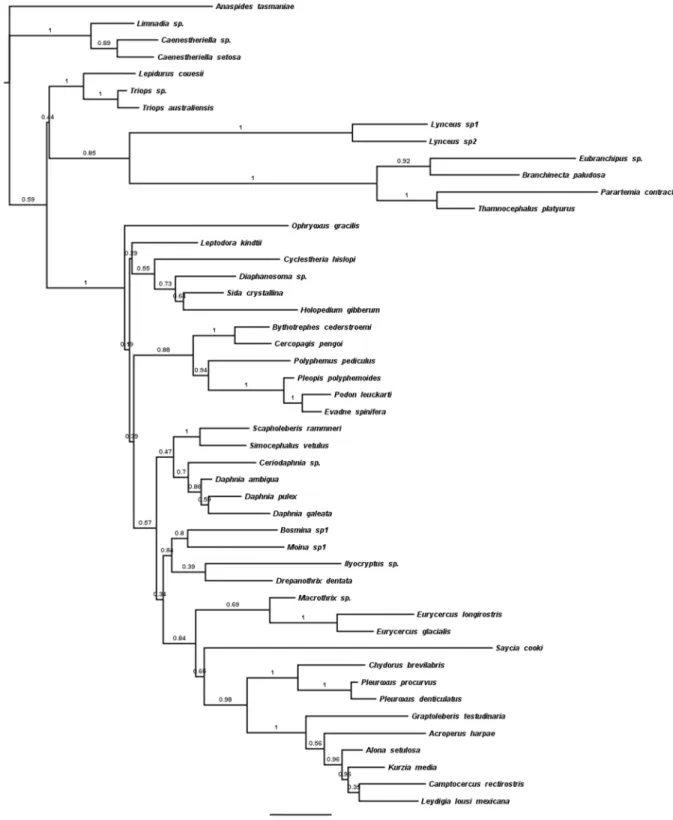
3.4.3 Phylogenetic relationships among the Cladocera ... 71
3.4.4 Site selection and biodiversity preservation ... 74
3.4.5 Phylogenetic uncertainty and PD comparison ... 77
3.5 Discussion ... 80
3.6 Acknowledgments ... 89
Chapter 4 ... 90 Spatio-temporal variation of community composition and feeding groups of zooplankton in
4.3.1 Study sites and sampling design ... 95
4.3.2 Taxonomic analyses ... 98
4.3.3 Zooplankton feeding groups ... 99
4.3.4 Analyses of variance ... 100
4.3.5 Zooplankton-environment relationships ... 101
4.4 Results ... 103
4.4.1 Waterbody environmental characteristics ... 103
4.4.2 Zooplankton taxa and feeding group diversity ... 105
4.4.3 Consistency of community composition through time ... 112
4.4.4 Effects of urbanization on zooplankton feeding groups ... 116
4.4.5 Relationships between zooplankton biodiversity and environmental features ... 120
4.5 Discussion ... 127
4.6 Acknowledgements ... 134
Chapter 5 ... 136
Conclusion ... 136
5.1 General discussion ... 137
5.2 Assessing aquatic biodiversity of zooplankton communities in an urban landscape ... 138
5.3 Phylogenetic diversity and its conservation in the presence of phylogenetic uncertainty: a case study for cladoceran communities in urban waterbodies ... 141
5.4 Spatio-temporal variation of community composition and feeding groups of zooplankton in urban waterbodies of a North American city ... 144
5.5 Perspectives ... 147
Literature cited ... 150
Appendix 1 – List and codes of the sampled zooplankton taxa along with the number of occurrences in the pelagic and littoral zones and overall in the waterbodies ... i
Appendix 2 – Table comparing the number of taxa reported in this study to other studies of urban and natural waterbodies and lakes ... iv Appendix 3 – List of species used in the phylogenetic study and their GenBank accession
Appendix 4 – List of cladoceran taxa with their occurrences over the summer period and each considered month ... vii Appendix 5 – List of recorded zooplankton taxa with their number of occurrences and their associated feeding group ... viii
Liste des tableaux
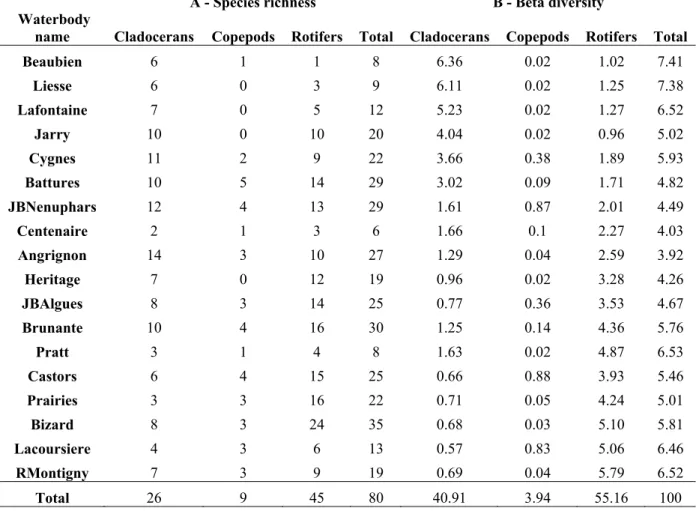
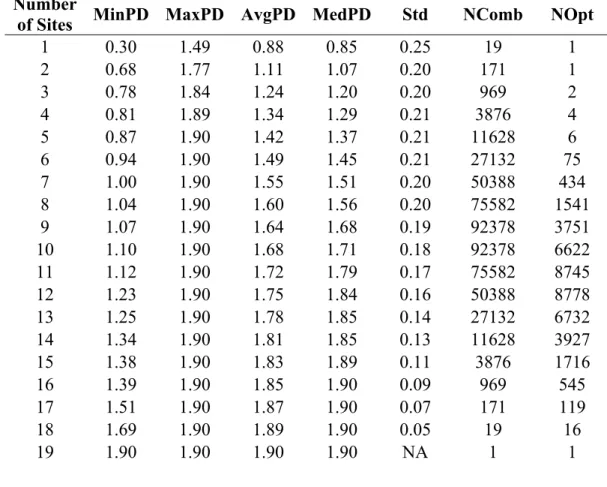
Table 2.1: General characteristics of the landscape and management practices, water quality, trophic conditions, fish and macroinvertebrates variables of the 18 studied urban waterbodies. ... 35 Table 2.2: Contributions of the zooplankton community and taxonomic assemblages of each studied waterbody to species richness (A) and beta diversity (B) in the urban region. Values for beta diversity correspond to the contributions of studied sites (LCBD) and zooplankton assemblages (SCDB) to beta diversity; they were divided by the total sums-of-squares and multiplied by 100 to obtain percentages. ... 37 Table 3.1: Estimates of species richness (SR) and phylogenetic diversity (PD) for urban cladoceran communities based on the MCC tree and 95% quantile-based intervals of PD according to the posterior distribution. ... 70 Table 3.2: Minimum amount of PD preserved (MinPD), maximum amount of PD preserved (MaxPD), average amount of PD preserved (AvgPD), median amount of PD preserved (MedPD), standard deviation of all PD values (Std), number of combinations of PD (NComb) and number of optimal combinations of PD (NOpt) for each number of sites that can be preserved. ... 75 Table 4.1: General characteristics of environmental and morphometric variables for the 19 urban waterbodies sampled. ... 104 Table 4.2: Number of taxa of each assemblage (Rotifera, Cladocera, Copepoda), as well as the total number of zooplankton taxa, recorded in the 19 sampled waterbodies for each month (June, July, August) and the total summer survey. ... 106 Table 4.3: Zooplankton feeding groups recorded in the 19 sampled waterbodies, along with the number of taxa included in each feeding group (RRotifera: Raptorial Rotifera, MRotifera: Microphagous Rotifera, SGCladocera: Substrate-grazing Cladocera, SFCladocera: Seston-filtering Cladocera, CCladocera: Carnivorous Cladocera, RCopepoda: Raptorial Copepoda, SSF: Stationary and suspension-feeding Copepoda). ... 109 Table 4.4: Significant variables, standardized regression coefficients (b), and adjusted R2
(R2adj) based on multiple regressions either using all the variables, or only variables retained
after forward selection, for the different zooplankton taxonomic groups and feeding groups. Only significant models are reported. Area: surface (m2), Depth: mean depth (m), Secchi:
Liste des figures
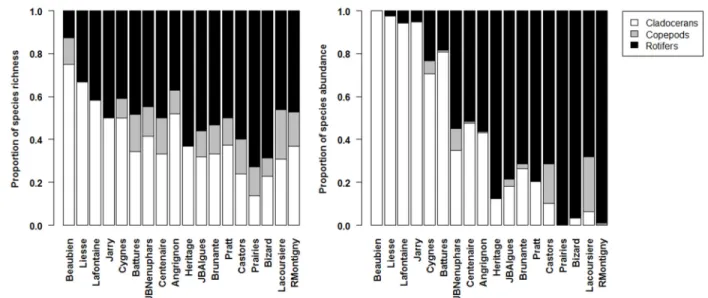
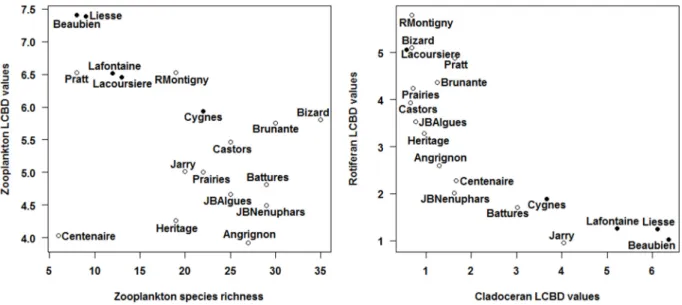
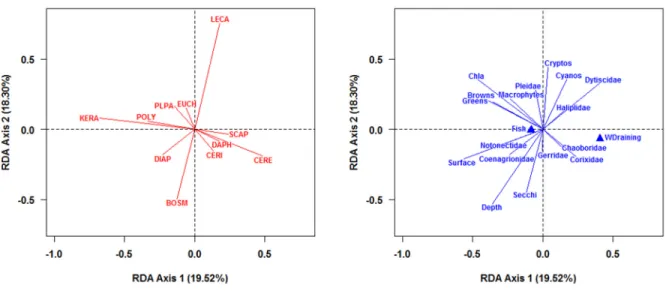
Figure 2.1: Geographic location and distribution of the 18 sampled waterbodies during the summer of 2010 on the Island of Montreal (Quebec, Canada). Modified from Pinel-Alloul and Mimouni, 2013. ... 27 Figure 2.2: Barplots showing the proportional species richness (left) and species abundance (right) between the zooplankton assemblages (Cladocerans, Copepods and Rotifers) for the 18 waterbodies. ... 38 Figure 2.3: Scatterplots showing the relationship between zooplankton species richness and zooplankton LCBD values (left) and cladoceran and rotifer LCBD values (right) for the 18 waterbodies. The names of the waterbodies are indicated next to each point. Waterbodies which had sampling units with significant LCBD valyes are represented by a filled circle. ... 40 Figure 2.4: Barplot of the SCBD values in percentages for each of the 81 zooplankton taxa recorded across the 18 waterbodies with values sorted in decreasing order. Taxa with SCBD values higher than the average SCBD (1.25%) are indicated in black and taxa with values lower than the average SCBD value are in white. For taxon codes, see Appendix 1. ... 43 Figure 2.5: Average species richness (±1SE) within the pelagic and littoral zones for the 14 waterbodies with a well-developed littoral zone. Pelagic means are indicated with an open circle and littoral means with a full circle. ... 45 Figure 2.6: Interaction map showing the attribution of zooplankton sampling units to groups as determined by a k-means partitioning applied to the Jaccard dissimilarity principal coordinate axes (a, 20 groups) and the Hellinger-transformed zooplankton communities (b, 11groups). Numbers for each sampling unit correspond to the partition to which it belongs. Site names are noted on the abscissa and sampling units (P1-P3 from pelagic zone and L1-L3 from littoral zone) on the ordinate. Numberings have meaning when compared within waterbodies as they represent paired sampling units, but not across waterbodies. ... 47 Figure 2.7: Ordination plots of the RDA model describing zooplankton communities and all three sets of environmental variables. Panel a) shows species vectors and panel b) shows environmental variables (vectors for continuous variables and centroids for qualitative variables). The first canonical axis accounted for 19.52% and the second axis for 18.30% of the explained variation. In order to retain only important taxa and improve legibility, only taxa that were well-explained by the analysis and well-represented in the two-dimensional space
Figure 3.3: Median and 95% intervals of the PD rank for the 19 sites sampled for cladoceran communities for the Bayesian posterior distribution of trees. ... 79 Figure 4.1: Geographic location and distribution of the 19 waterbodies sampled during the summer of 2011 on the Island of Montreal (Quebec, Canada). Modified from Mimouni et al., 2015. ... 97 Figure 4.2: Barplots showing the proportional abundances of the zooplankton feeding groups (RRotifera: Raptorial Rotifera, MRotifera: Microphagous Rotifera, SGCladocera: Substrate-grazing Cladocera, SFCladocera: Seston-filtering Cladocera, CCladocera: Carnivorous Cladocera, RCopepoda: Raptorial Copepoda, SSF: Stationary and suspension-feeding Copepoda) for the months of June (A), July (B) and August (C) in the 19 sampled waterbodies. ... 111 Figure 4.3: Interaction map showing the attribution of zooplankton taxonomic composition data to groups as determined by a k-means partitioning applied to the Jaccard dissimilarity principal axes for each month sampled (A: June, B: July and C: August). Numbers for each sampling unit correspond to the group to which it belongs. Site names are noted on the abscissa and sampling units (P1-P3 from pelagic zone and L1-L3 from littoral zone) on the ordinate. Sampling units with significant LCBD values are drawn in red with a circle around the number. ... 113 Figure 4.4: Distance biplot based on the CAP ordination of the zooplankton communities constrained by the groups, as determined by k-means clustering. In order to interpret only species that contribute to discriminating groups and to improve legibility, taxa with small loadings on the canonical axes were not drawn. See Appendix 5 for the names of the taxa. . 115 Figure 4.5: Interaction map showing the attribution of zooplankton sampling units to groups as determined by a k-means partitioning applied to the Hellinger-transformed feeding groups data for each month sampled (A: June, B: July and C: August). Numbers for each sampling unit correspond to the group to which it belongs. Site names are noted on the abscissa and sampling units (P1-P3 from pelagic zone and L1-L3 from littoral zone) on the ordinate. ... 117 Figure 4.6: Distance biplot based on the CAP ordination of the zooplankton communities constrained by the groups, as determined by k-means clustering. In order to improve legibility, the vectors for the feeding groups CCladocera, RCopepoda and SSF, which had small loadings on the canonical axes, were not drawn. ... 119 Figure 4.7: Ordination plots of the RDA model describing zooplankton communities and the environmental variables retained by forward selection. The first canonical axis accounted for 14.66% and the second axis for 9.91% of the variation in zooplankton community composition. The left panel shows the species vectors for raptorial rotifers and seston-filtering cladocerans, and the right panel shows the species vectors for microphagous rotifers and substrate-grazing cladocerans. In order to retain only important taxa and improve legibility, only taxa that were well explained by the analysis and well represented in the two-dimensional
Figure 4.8: Venn diagram showings showing the partitioning of the variation in zooplankton species richness (A) and zooplankton community composition (B) between the environmental variables retained by forward selection. The values reported are adjusted coefficients of multiple determination. ... 126
Liste des sigles et abréviations
ANOVA: Analysis of variancecm: Centimetre m: Metre
m2: Square metre
mL: Millilitre L: Litre
LCBD: Local contribution to beta diversity loge: Natural logarithm
MANOVA: Multivariate analysis of variance MCC: Maximum clade credibility
mtDNA: Mitochondrial DNA NA: Not available
PD: Phylogenetic diversity
r: Pearson’s correlation coefficient R2
adj: Adjusted coefficient of multiple determination
RDA: Redundancy analysis
SCBD: Species contribution to beta diversity SE: Standard error
TP: Total phosphorus µg: Microgram
Remerciements
Je tiens, en premier lieu, à exprimer toute ma gratitude à mes deux codirectrices Mme Pinel-Alloul et Mme Beisner pour l’encadrement, le soutien et la confiance qu’elles m’ont accordés dans la réalisation de cette thèse mais, également, pour leurs encouragements et leur disponibilité tout au long de ces cinq années de mon cursus de doctorant.
Je voudrais, ensuite, adresser mes sincères remerciements à Mr Legendre tout d’abord pour avoir accepté de présider mon jury mais surtout pour ses précieux conseils, ses avis pertinents ainsi que pour les discussions toujours aussi fructueuses que j’ai eu le plaisir d’avoir avec lui et qui m’ont permis d’avancer dans l’analyse de mes résultats.
Je voudrais, également, témoigner ma profonde reconnaissance à Mr Borcard qui a su me communiquer son amour pour les biostatistiques et qui m’a donné l’opportunité d’enseigner cette matière durant quatre années consécutives. Je tiens à le remercier pour sa confiance ainsi que pour l’assurance qu’il m’a transmise et qui m’ont permis de me perfectionner dans cette matière.
Un grand merci également à Ginette Méthot pour son aide précieuse sur le terrain mais surtout pour sa fine expertise dans le domaine de l’identification du zooplancton.
Merci à Adrien André, Léo Derémiens, Nicolas Dedieu, Joseph Nzieleu-Tchapgnouo Anne-Hélène Lejeune et Lama Aldamman pour leur assistance sur le terrain mais aussi pour leur bonne humeur qui a contribué à la formation d’un groupe dynamique et sympathique et à la création d’une atmosphère particulièrement agréable lors de la campagne d’échantillonnage. Une pensée spéciale à Louise Cloutier pour sa présence parmi nous et nos discussions
Mes remerciements vont également à Mr Amyot pour nous avoir ouvert les portes de son laboratoire et nous avoir prêté certains équipements utiles pour les campagnes d'échantillonnage.
J’adresse, également, mes sincères remerciements à Mr Simon Joly pour sa relecture enrichissante de mon article sur la phylogénie des cladocères et pour ses conseils avisés.
Je remercie aussi les membres de mon comité conseil (Marc Amyot, Antonella Cattaneo) et de mon jury de thèse (Simon Joly, Pierre Legendre, Matthew Leibold) pour leurs commentaires constructifs.
Ce travail n’aurait pu être mené à bien sans le soutien financier de différents organismes: le fonds Etienne-Magnin du département de Sciences biologiques, la FESP, le GRIL et les fonds du CRSNG et du FQRNT octroyés par mes co-directrices. Je tiens à les en remercier.
Enfin, je dédie cette thèse de doctorat à mes parents que j’ai eu la chance d’avoir à mes côtés et qui, grâce à leurs encouragements et leur soutien indéfectible et quotidien, m’ont permis d’aller jusqu’au bout de cette thèse.
Chapter 1 Introduction
1.1 Freshwater and its biodiversity
Water is an important and essential resource for human populations. Close to three quarters of the Earth’s surface is covered by water, with most of it being from the World Ocean (Shiklomanov and Rodda 2003, Kotwicki 2009). The Earth’s water reserves are estimated to be around 1 386 million km3 of water (Shiklomanov 2000). However water
resources are rather unevenly distributed between different compartments as although this number is high, fresh water represents only a small fraction of the world’s water reserves. It is estimated that approximately 97.5% of the Earth’s water is made up of saltwater (Shiklomanov 2000). Furthermore, even within the freshwater compartment, about two thirds of this water is locked in glaciers and ice caps and another third is made up of groundwater. This means other forms of fresh water, such as those that make up lakes, rivers and other freshwater ecosystems constitute less than 0.01% of the world’s freshwater resources. Consequently, fresh water that is directly available to human exploitation and use represents only a very small fraction of the Earth’s water reserves.
Water quality, use and management are pressing socio-economic and ecological issues that need to be addressed (Kuylenstierna et al. 1997, Gleick 1998, Johnson et al. 2001, Baron et al. 2002, Brooks and Brandes 2011). In addition to sources of water for drinking or sanitary purposes, freshwater ecosystems are also, among others, sources of irrigation water for agriculture, goods such as food and materials, hydroelectric power generation, as well as of
compartments, freshwater ecosystems constitute an indispensable resource for both the viability of human populations as well as a variety of ecological processes.
Additionally, freshwater ecosystems constitute important habitats that contain important amounts of biodiversity. Currently, freshwater animals represent approximately 126 000 species, or around 9.5% of the total number of animal species recognized globally (Balian et al. 2008). The number of freshwater vertebrate taxa is quite high and includes at least 12 740 fish, 4 294 amphibian, 567 bird and 124 mammal species. Together, freshwater vertebrates represent up to 35% of all described vertebrate species. However, vertebrates make up only a small portion (14.5%) of known freshwater biodiversity. The major portion of freshwater diversity is made up of invertebrate taxa that contribute notably more to it. Invertebrates consist of an extremely diverse group of animals, which are linked by the fact that they do not possess a backbone. Together, freshwater invertebrates make up to 107 295 described species (Balian et al. 2008). These values are most certainly underestimates of the actual diversity of freshwater ecosystems. Indeed, current knowledge of freshwater biodiversity is incomplete and its estimation is a work in progress. For several taxonomic groups, the number of described species has considerably increased over the years (Balian et al. 2010). Increased sampling and study in lesser-known regions, as well as taxonomic re-evaluations of more difficult taxa will most surely increase the number of freshwater species (Lévêque et al. 2005, Dudgeon et al. 2006, Balian et al. 2008). Consequently, despite representing a small fraction of the world’s water compartments, freshwater ecosystems contain considerable amount of diversity, making them important targets for conservation studies.
Freshwater ecosystems are heavily threatened by several factors which are linked with demand for their resources and increases in the human population. They face a number of threats such as organic pollution, habitat degradation and fragmentation, invasive species, increased water withdrawal and overexploitation of their resources. All of these have profoundly altered various physical, chemical and biological aspects of freshwater ecosystems (Carpenter et al. 2011). Consequently, several of the world’s freshwater ecosystems are noticeably modified by anthropogenic activities and pressures that also threaten freshwater biodiversity, leading several species to vulnerable or endangered status (Dudgeon et al. 2006, Darwall et al. 2009). Pronounced losses can be expected and projected extinction rates for North American freshwater fauna are as high as those in tropical forests, one of the world’s most endangered biomes (Ricciardi and Rasmussen 1999). Therefore, unless action is undertaken to better study and preserve these ecosystems, the resources and services they offer will be lost. This would call for increased awareness of freshwater biodiversity and its value, as well as the development and implementation of biodiversity conservation plans to prevent further biodiversity loss.
1.2 The importance of small waterbodies
Much of the interest in freshwater studies has concentrated on relatively large lakes and rivers. Relative to the interest that these ecosystems have garnered, other freshwater
now considered to be important ecosystems that play out a role in water balance, sedimentation and the carbon cycle (Downing et al. 2008, Downing 2010). Consequently, despite their smaller size, small lakes and ponds are underappreciated aquatic environments that should be included in research studies to obtain a better understanding of freshwater ecological patterns and processes.
Scientific interest in the biodiversity of these small waterbodies has also increased considerably over the last years (Oertli et al. 2009). This increase can be attributed to the fact that these small waterbodies represent important biological habitats that harbour substantial biodiversity. Indeed, ponds have been noted to contain several species labelled as rare or unique and can contribute noticeably to landscape diversity (Oertli et al. 2002, Williams et al. 2003, Wood et al. 2003). This high biodiversity can be the result of the heterogeneity in environmental conditions among these waterbodies, as they can vary considerably in terms of shapes, sizes, hydroperiod, and water quality, among others. The often large amount of heterogeneity displayed by ponds, along with their high numbers should create a wide array of habitats for various communities to develop, as well as to promote landscape biodiversity. Furthermore, ponds also represent key ecosystems that are especially amenable to the testing of ecological and evolutionary hypotheses (De Meester et al. 2005). Consequently, as we increase our knowledge of pond ecology, we also gain a deeper appreciation of the scientific resource and value they represent.
Despite this growing interest, increasing pressure owing to urban encroachment and agricultural intensification have led to a considerable decline in aquatic habitat numbers in many areas (Wood et al. 2003, Hassall 2014). Furthermore, affected waterbodies face a
changes in their trophic state and pH, habitat loss due to changes in land use, invasive species and global change (Brönmark and Hansson 2002, E.P.C.N. 2007, 2008). Additionally, ponds and small waterbodies are somewhat inadequately protected due to their small size which, with very few exceptions, excludes them from formal protection plans (Nicolet et al. 2007, E.P.C.N. 2008, Miracle et al. 2010, Möckel 2013, Hassall 2014). Furthermore, for waterbodies located in urban environments, human population density and the ensuing anthropogenic stressors may also have strong impacts. In these cases, inappropriate management of waterbodies or their surrounding environment can affect the communities they harbour.
Consequently, although they can be very numerous, contribute to important ecological processes and have the potential to harbour substantial amounts of biodiversity, ponds and other small waterbodies are amongst the least well-protected and least well understood freshwater ecosystems. Pond conservation can be carried out through various legislation and national efforts, but there is a need to study them further, as well as to develop conservation strategies directly for them. Efforts have been carried out to study, promote and preserve their biodiversity (Biggs et al. 1991, Biggs et al. 2005, Oertli et al. 2005b, E.P.C.N. 2007, 2008, Céréghino et al. 2008). However, this accumulation of knowledge is a work in progress and further scientific knowledge is needed, especially in the case of urban waterbodies. Further knowledge regarding species distribution patterns and their sources of variation is necessary to be able to properly evaluate their biodiversity potential, as well as to manage and preserve
1.3 Human interactions with waterbodies
Human interactions with ponds and small waterbodies are varied and have existed for quite a long time. The diverse relationship between man and ponds is seen in the countless functions and uses that they may derive from them (Rees 1997, E.P.C.N. 2008, Hassall 2014). Over time, humans have used ponds for several purposes, including as sources of food and drinking water, but also for more complex and elaborate uses such as irrigation ponds for agriculture, watering ponds for livestock, retention and sedimentation ponds, or ponds for a variety of industrial processes. These many uses of ponds by humans give them an amenity value and, in some cases, economic profit can be gained from the exploitation of their resources. Furthermore, these waterbodies have also been integrated as part of some societies’ culture and history. Consequently, these habitats also possess a social and cultural value, which should also be taken into account when assessing their value (Rees 1997, E.P.C.N. 2007, 2008, Boix et al. 2012). Waterbodies are therefore important elements of the local landscape that can share a deep bond with human society.
Furthermore, humans share an affective link with water, as the presence of water is usually perceived as a scenic, pleasant and aesthetic component that people usually enjoy. Humans often show preference towards certain kinds of waterbodies (Ulrich 1983, Herzog 1985, Bulut and Yilmaz 2009, White et al. 2010). Furthermore, aquatic environments can provide several benefits, affecting health and well-being, as well as serving as a place for recreational activities (Völker and Kistemann 2011, 2013). When this is the case, people want to have these waterbodies around them simply for the affectionate relationship they have with them and the therapeutic and aesthetic benefits they can draw from them. Likewise, another
estate appreciation, wherein property values can be affected by the proximity to the waterbody (Doss and Taff 1996, Luttik 2000, Mahan et al. 2000, Cohen et al. 2014). Consequently, despite considerable declines in the number of small waterbodies due to increase in urban space and agricultural intensification, small waterbodies can still hold a place for human society. Their numbers and uses in human-dominated environments are likely to be related to changes in human’s perception of them.
The presence of urban ecosystems means that they may provide ecosystem services, which can be both varied and important. These services are diverse and include direct use such as food and water sources, indirect uses such as noise reduction and water purification, as well as more psychological or emotional uses such as recreation, spirituality and population well-being (Bolund and Hunhammar 1999, Gómez-Baggethun and Barton 2013, Gómez-Baggethun et al. 2013). In the case of aquatic ecosystems, water treatment and the removal of contaminants and waste from the water by aquatic communities may be an interesting and less invasive practice to obtaining cleaner waters. Wetlands may reduce the amount of various elements such as nutrients, heavy metals and pesticides (Brix 1994a, Kohler et al. 2004, Rai 2008) that accumulate in urban waters. In addition to these services, ponds also may possess a social function, being sites where recreational activities such as swimming, fishing or gatherings can take place. Furthermore, their presence could also have therapeutic benefits that increase the health and well-being of people (Völker and Kistemann 2011, 2013, White et al.
biodiversity (Hassall 2014). These diverse functions further enhance the potential that can be gained from proper management of urban aquatic ecosystems.
However, the amount, value and limits of these services need to be assessed, as they may vary between cities for socio-economic and cultural reasons. Furthermore, the notion of urban ecosystems and their biodiversity are not always synonymous with benefits to human society. Indeed, ecosystem disservices, or aspects of ecosystems that are perceived as negative by humans, can also come into play and should be considered (Lyytimäki et al. 2008, Lyytimäki and Sipilä 2009, Gómez-Baggethun and Barton 2013, Gómez-Baggethun et al. 2013). Disservices of aquatic ecosystems include negative water quality and harbouring waterborne pathogens and diseases when polluted. Ponds can also develop cyanobacteria blooms, whose toxins can pose serious health risks to humans and pets (Waajen et al. 2014). Aquatic environments may attract wild animals and pests, and the water can become a breeding ground for biting insects such as mosquitoes. Finally, when considering the construction and arrangement of ponds, the safety of certain people, especially children, must be considered (Baxter et al. 1985, Emery 1986, Danks 2001). Consequently, even though urban ponds can provide several ecosystem services, these ecosystem disservices should not be neglected as they are part of these habitats.
Finally, the biological, economic and cultural values we attribute to these waterbodies sometimes clash with each other, as they can lead to conflicting management strategies for waterbodies. For example, the use of plants to take up contaminants or nutrients may involve their removal. Macrophytes may also be removed for visual and aesthetic purposes or because they may be considered as weeds. However, such actions should take into consideration the
wildlife, macrophytes play out several ecological roles in wetlands (Brix 1994a, 1994b, 1997). Likewise, exotic species often have negative impacts on the ecosystems in which they are introduced. However, part of the appeal of certain ponds can also include the presence of exotic or nonnative species, sometimes which can even form part of the waterbody’s history. If the historical value of these waterbodies is to be prioritized, then such macrophyte species must be considered as part of the ponds’ landscape (Rees 1997). Finally, prioritization of the biological value of the waterbody’s diversity could call for some waterbodies’ amenity usage to be altered or stopped, thus having potential economic or social impacts.
Thus, it becomes clear that the issue of biodiversity and its conservation for waterbodies located within urban environments can be a difficult issue due to their complex relationship with humans and the various stakeholder types that may be involved. Conservation plans are charged with the difficult task of weighing these different values and making informed decisions. The advantages and disadvantages of specific decisions regarding waterbody management should be carefully considered before any action is undertaken. If poorly informed practices are undertaken, then urban ecosystems can become more of a nuisance than an asset and much of their value can be lost. Indeed, under informed maintenance of waterbodies, education of the public, and when biodiversity is promoted, many of the ecosystem disservices and conflicts related to waterbody usage can be resolved.
and reclassification of land around the periphery as well as urban or rural-to-urban migration (Cohen 2004). By 2008, there were 19 megacities (cities with over 10 million inhabitants) in the world and as of 2015, there are currently 36 megacities in the world. Furthermore, there are over 500 agglomerations of over 1 million inhabitants (Brinkhoff 2003). However, urban population will continue to be distributed among urban areas of all sizes, including smaller population centers (Hardoy et al. 2001, Cohen 2004). Despite differing definitions of the term “urban” (McIntyre et al. 2000, Frey and Zimmer 2001, Cohen 2004), urbanization represents an important phenomenon for human society.
The presence of human populations and their associated activities have varied ecological effects on urban ecosystems and their associated biological communities. These effects can vary amongst taxonomic groups and land-use types (McKinney 2002, 2008, Alberti 2005). However, urban areas are not completely devoid of nature, as biodiversity can be seen in parks, ponds or even within unexpected places such as buildings, gardens or homes. These urban environments can be considerably different than more natural ones due to human presence and anthropogenic stressors, and they may also provide interesting ecological opportunities (Alberti et al. 2003, Alberti 2005, Kowarik 2011). Within urban ecosystems, biological communities may not be subjected to the same factors because of the presence of additional stressors not found in the natural environment.
Consequently, to obtain a better understanding of urban biodiversity patterns, as well as the structure and function of populations, communities and ecosystems in urban landscapes, these issues need to be taken into account (Pickett et al. 1997, Collins et al. 2000, Grimm et al. 2000, McDonnell and Hahs 2013). Urban waterbodies represent complex ecosystems that
perception, which may affect their management and viability. Indeed, public perception of ecosystems and their willingness to change it can be a strong force that affects ecosystems, as landscapes valued for their appearance are more likely to exist over the long-term in a human-dominated landscape (Nassauer 1997, Décamps 2001, Robertson and Hull 2001, Nassauer 2004). In some cases, people can employ certain practices or modify certain aspects of these waterbodies, which may not always have positive consequences for aquatic biodiversity. Furthermore, as humanity is increasingly more urbanized and owing to their proximity to city centers and human stressors, studying urban waterbodies may be the most direct approach for assessing the effects of anthropogenic stressors on biodiversity and communities, as well as developing management policies favouring biodiversity conservation.
An invaluable element of any conservation evaluation plan is the knowledge of what kind of biodiversity there is, how much of it there is, where it is located and how it varies. However, even though urban pond communities have been the focus of a range of various studies (Hassall 2014), the amount and type of biodiversity that is present in urban waterbodies is still relatively unknown. Additionally, the role that these waterbodies play as potential reservoirs of urban biodiversity should be further evaluated. Indeed, it seems that they may play an important role in biodiversity conservation, as some studies have report considerable amounts of biodiversity in urban environments for various aquatic communities (Ejsmont-Karabin and Kuczyńska-Kippen 2001, Santoul et al. 2009, Vermonden et al. 2009).
Since they are part of the urban landscape, humans will often interact with waterbodies and can have expectations regarding their appearance. This and the possible affective relationship between waterbodies and human populations can have a number of implications for environmental planning and design. In urban environments, waterbodies may be modified, removed or created in response to particular societal demands. These can be completely different from the ecological demands of waterbodies. In the case of aquatic environments, people show preferences for different attributes, such as its size, the presence of macrophytes, water color, transparency, whether water is moving or not, as well as visual cues (Wilson et al. 1995, Wherrett 2000, Nasar and Lin 2003, Nasar and Minhui 2004, Cottet et al. 2013). City officials and park managers may seek this information in order to rearrange or design new waterbodies so as to make them more appealing, and increase the number of visitors or their well-being.
Though such practices can satisfy citizens and give them a higher degree of well-being, they may have several negative consequences for the ecology of urban waterbodies. Indeed, if only human design preference is followed, homogeneity of waterbodies can occur. Currently, citizen and manager preferences tend toward larger waterbodies, with well-kept vegetation, preferably oligotrophic and whose water could be treated in order to obtain cleaner and clearer waters (Biggs et al. 1994, Nassauer 2004, Hassall 2014). The loss of ecological diversity of habitats due to these practices should have detrimental effects on landscape biodiversity. It has been suggested that conservation policies should consider all waterbody size ranges (Oertli et al. 2002), flow, size, and permanence regimes (De Bie et al. 2010) as well as early and late successional stages (Hassall et al. 2012) of ponds on the landscape. Consequently, a
diversity of waterbody types, aquatic biodiversity would be maximized. This would constitute an important aspect of biodiversity conservation plans.
Natural ecosystems within urban environments constitute attractive sites from which people can benefit. Indeed, they can be considered a peaceful getaway from the city life and a place to relax and reconnect with nature. In general, public perception of wetlands in their vicinity is positive and they are usually considered an asset (Kaplowitz and Kerr 2003, Manuel 2003, Johnson and Pflugh 2008). However, the benefits that people obtain from urban ecosystems and the relationship between site attractiveness and biodiversity is not completely known, and not necessarily direct. Biodiversity can be perceived and related to psychological well-being, but these differ between taxonomic groups, as well as people’s perception of diversity. Consequently, meeting both public well-being and biodiversity can be a difficult operation, as the relationship is surely multiple and very complex (Fuller et al. 2007, Dallimer et al. 2012). Furthermore, citizens mostly enjoy and preserve taxa that are visually attractive, or appeal to their emotions. Consequently, taxa that are less conspicuous, appealing or known to the general public can be excluded from conservation plans. This may especially be true for taxa such as zooplankton, which even though they are less conspicuous and known to the general public, remain important ecological actors and constitute an essential component of freshwater ecosystems.
waters (Peretyatko et al. 2009, Teissier et al. 2011), or as biological tools to assess water quality or contamination by waterborne parasites (Gannon and Stemberger 1978, Walseng et al. 2003, Nowosad et al. 2007). Furthermore, zooplankton have also been strongly advocated as biological indicators of ecological quality (Jeppesen et al. 2011). Consequently, the study of their ecology and biodiversity patterns should be an important part of aquatic ecosystem studies. However, while zooplankton communities in deeper, larger lakes are well studied, the ecology of zooplankton communities in urban environments remains largely unknown.
From the few studies that have focused on various components of urban zooplankton communities, different aspects of their ecology can be understood. Their communities and diversity are related to environmental characteristics such as land use, water chemistry and aquatic vegetation (Dodson et al. 2005, Dodson 2008), but they can be affected and modified by human activities (Langley et al. 1995, Moore et al. 2000, Van Meter and Swan 2014). However, despite exposure to anthropogenic stressors and human activities, urban waterbodies can contain noticeable amounts of zooplankton biodiversity and are not necessarily less diverse than their more natural or undamaged counterparts (Langley et al. 1995, Ejsmont-Karabin and Kuczyńska-Kippen 2001) and thus they may represent important reservoirs for zooplankton biodiversity. Finally, strong seasonal variation can be observed (Burdíková et al. 2012). These studies show urban zooplankton communities as diverse and dynamic assemblages that vary in response to various factors, both natural and anthropogenic.
More studies are needed to establish a reference point for zooplankton communities in urban waterbodies, as well as allow a better definition of their biodiversity and their sources of variation. Indeed, even though several studies have been conducted on urban pond
(Hassall 2014). Given the importance of zooplankton communities in natural aquatic environments, increased knowledge of their ecology in urban environments will provide a better idea of urban pond functioning, help understand the effects of anthropogenic stressors on aquatic communities, as well as determine the biodiversity potential of urban ponds.
1.5 Study sites
The city of Montreal (45.46 - 45.69ºN, 73.50 - 73.90ºW) is located in the Canadian province of Quebec. The city is an island located at the junction of the Saint Lawrence and Ottawa rivers. With a surface area of approximately 499.19 km2, it is not amongst the largest
freshwater islands in the world. However, it is the most densely populated freshwater island in the world, with a population of 1 886 481 people in 2011 (Statistics Canada 2012). Furthermore, it is the second most populous city in Canada and amongst the ten most populous cities of North America. Several waterbodies are present on the island, some artificially created, and serving a variety of socio-economic functions. Many of these waterbodies are used for leisure or recreational activities, and are often visited by people. During the summers of 2010 and 2011, a group of 20 waterbodies of various types were sampled to evaluate zooplankton biodiversity in these aquatic habitats. The waterbodies were sampled in July of 2010 and in June, July and August of 2011. These waterbodies were quite distant from each other and were not connected to each other, which imply that they should not form a
While interest in pond biodiversity has seen an increase over the last years (Oertli et al. 2009), there is a lot of uncertainty around the term “pond” itself, as it refers to a wide array of small waterbody types (Biggs et al. 2005, De Meester et al. 2005, Oertli et al. 2005a, Boix et al. 2012). The majority of our studied waterbodies fall into this broad category, although the larger ones could also be considered small lakes and thus, all will usually be referred to as “waterbodies”. Furthermore, given that one of the interests of our study was in assessing and determining the biodiversity present in aquatic habitats within an urban environment, we wanted to include the full variety of urban aquatic habitats to which zooplankton communities are exposed.
The sampled waterbodies covered a wide range of types and included both permanent and temporary waterbodies, as well as three wetlands. Based on observations in 2010 and a visual campaign that focused on the vegetation cover and dominance in 2012, fourteen waterbodies had aquatic vegetation in the littoral zone composed mainly of emergent (Phragmites, Typha, Scirpus, Lythrum, Equisetum, Sparganium, Pontederia, Butomus, Alisma), floating (Nymphaea, Nymphoïdes, Lemna, Wolffia) or submerged (Potamogeton, Ceratophyllum, Anacharis (Elodea), Utricularia, Myriophyllum, Valisneria, Najas) plants and some Characeae algae (Nitella flexilis, Chara vulgaris). They also showed a variety of substrate types, with some of these waterbodies being lined with soil, mud, gravel and sometimes bare concrete. On average, waterbody size (surface and mean depth) were variable. However, except for a single waterbody, most were shallow, usually no deeper than 1.91 m. Fish communities were noted as being present in all but three waterbodies.
1.6 Structure and objectives of this thesis
The main interest of this study was to evaluate the biodiversity potential and understand biodiversity patterns of zooplankton communities of waterbodies located in an urban setting. Further interests include the determination of the most important sources of zooplankton biodiversity variation, an assessment of the conservation value of waterbodies, as well as suggestions for biodiversity preservation. This doctoral thesis is organized into five chapters. The first chapter introduces the general setting and places the study in the current ecological context. The following three chapters are presented as research articles, each with a different research objective. The fifth chapter concludes on the study and underlines what it has brought to the advancement of knowledge regarding small waterbody ecology, while also suggesting possible openings and perspectives.
The first research objective was to examine biodiversity patterns of zooplankton communities across eighteen waterbodies in the urban landscape of Montreal to determine the main sources of variation in urban zooplankton communities. Indeed, given the possible importance of aquatic biodiversity in urban ponds, a solid understanding of aquatic species distributions in urban aquatic habitats will be necessary to advance urban ecology and preserve biodiversity in cities. We tested the hypothesis that, within zooplankton taxonomic groups (rotifers, cladocerans and copepods), asexual and fast-growing species such as rotifers and cladocerans would contribute more to biodiversity than sexual and slow-growing species
urban lakes, we expected communities to respond to multiple abiotic and biotic environmental conditions, but that management practices would also play an important role. To verify these claims, a multi-scale sampling design at regional (among waterbodies) and local (littoral and pelagic zones within each waterbody) scales was applied. These questions do not only help evaluate the biodiversity potential of urban waterbodies, but will also be important in guiding future management practices to best favour urban biodiversity and water quality.
The second research objective was to explore the phylogenetic diversity of cladocerans communities in urban waterbodies on the Island of Montreal and suggest conservation plans to best preserve phylogenetic diversity of aquatic communities. We also evaluated the consequences of phylogenetic uncertainty on phylogenetic conservation and how it would affect the prioritization of sites. To verify this, we sampled nineteen waterbodies in the months of June, July and August of 2011 in order to determine cladoceran species assemblages. Based on DNA sequences from two mitochondrial genes, phylogenetic trees for the sampled species and several other cladocerans taxa were inferred using Bayesian inference. Using the posterior distribution of trees, we considered the extent to which uncertainty in the phylogenetic tree affected the results and how comparison of phylogenetic diversity between sites could be carried out. We found that waterbodies on the Island of Montreal showed variability with regards to phylogenetic diversity and that careful selection of which sites to prioritize could lead to preserving a maximal amount of phylogenetic diversity. However, when phylogenetic uncertainty was taken into account, several potential comparisons between sites were not given any support. Consequently, in the presence of phylogenetic uncertainty, prioritization ranks become unresolved and prioritization should thus be determined more cautiously.
estimates of phylogenetic diversity and conservation decisions to avoid making suboptimal choices.
The third and last research objective was to describe and understand monthly variation in community composition and feeding group patterns, as well as explain richness and diversity patterns of zooplankton communities in a set of 19 urban waterbodies that were followed monthly, from June to August of 2011. The small size and relatively high rates of population increase means that zooplankton comprises a dynamic ecological component that can change over time. Considering the fact that species composition can change over time, we tested the hypothesis that this relationship between waterbodies and their littoral zones changes over time. By characterizing communities using information on species feeding ecology, we also tested the hypothesis that urbanization and anthropic stressors in urban waterbodies would lead to a single feeding group pattern. Finally, knowledge of the main drivers of zooplankton species richness and community composition will be crucial in allowing the elaboration of biodiversity conservation plans. To this end, we used a set of five environmental variables (total phosphorus concentration, surface area, mean depth, mean Secchi depth and macrophyte cover), which have been noted as being important for aquatic biodiversity in order to see how they affected zooplankton species richness in our urban waterbodies.
Chapter 2
Assessing aquatic biodiversity of zooplankton communities in an urban landscape
Authors: El-Amine Mimouni, Bernadette Pinel-Alloul and Beatrix E. Beisner
Publié en décembre 2015 dans la revue Urban Ecosystems Volume 18, numéro 4, page 1353-1372
2.1 Abstract
Aquatic ecosystems are common in urban environments. A solid understanding of aquatic species distributions in urban habitats will both advance urban ecology and preserve biodiversity in cities. In particular, zooplankton are central components of aquatic food webs and their biodiversity patterns thus warrant further characterization and understanding. We examined sources of variation and biodiversity patterns of zooplankton communities across eighteen waterbodies in the urban landscape of Canada’s large island city of Montreal. We report a total of 80 zooplankton taxa of which rotifers and cladocerans were major contributing taxa to biodiversity. We found a lack of agreement between contributions of individual waterbodies to rotifer and cladoceran beta diversity. Littoral vegetated zones proved to be important habitats for zooplankton biodiversity, contributing considerably to the species richness pool, often with a different species composition. Further variation in zooplankton community composition was attributable to local factors such as waterbody size, algal biomass and composition, and macroinvertebrate predators, but also to urban management practices such as waterbody draining during winter. We show that urban waterbodies can represent important reservoirs of biodiversity. Management practices favouring a large diversity of permanent and temporary habitats with littoral vegetated zones should be incorporated in urban design and conservation plans.
2.2 Introduction
Freshwater ecologists have traditionally focused on large waterbodies, such as lakes, streams and rivers. In contrast, shallow lakes and ponds, occurring far more frequently than larger lakes (Downing et al. 2006, Downing 2010) and often in urban environments, are less studied. Recently, a high potential for endemicity and species richness, especially in urban ponds and man-made waterbodies has been revealed, with important consequences for landscape biodiversity (Langley et al. 1995, Maier et al. 1998, Ejsmont-Karabin and Kuczyńska-Kippen 2001, De Bie et al. 2010). Indeed, the amount of environmental heterogeneity across urban landscapes, coupled with the large number of waterbodies in many cities should allow for the creation of a complex mosaic of ecosystems within which biodiversity is promoted at local and regional scales. The high overall contribution of small urban waterbodies to diversity, in line with the SLoSS (“Single Large or Several Small”) debate, would call for their study and inventorying to enable their conservation (Oertli et al. 2002). Furthermore, ponds also represent key ecosystems that are especially amenable to the testing of ecological and evolutionary hypotheses (De Meester et al. 2005, De Bie et al. 2012). As such, a number of programs have been developed to assess and monitor their ecological status and biodiversity in Europe (Moss et al. 2003, Oertli et al. 2005, Declerck et al. 2006, Céréghino et al. 2008). However, relative to the knowledge gained on small man-made lakes and urban ponds in Europe, knowledge about aquatic biodiversity in urban environments is scant in North America, where cities are, by nature, structurally different.
In the field of “urban ecology” a better understanding of biodiversity patterns, as well as the structure and function of populations, communities and ecosystems in urban landscapes
communities in urban environments may be exposed to suites of factors that are considerably different from those occurring in more natural environments. Thus, their biodiversity merits investigation for this reason. Furthermore, owing to their proximity to city centers and human stressors, studying urban waterbodies may be the most direct approach for assessing the effects of anthropogenic stressors on biodiversity and communities, as well as developing management policies favouring biodiversity conservation.
The use of zooplankton communities, both as indicators of water quality and biodiversity in aquatic systems, is appealing because these communities tend to respond quickly to changes in their environment such as watershed land-use, water chemistry and trophic status (Pinel-Alloul et al. 1990, Patoine et al. 2002, Dodson et al. 2005). Additionally, in temporary ponds, habitat permanence and hydroperiod length can also affect both zooplankton species richness and community composition (Serrano and Fahd 2005, Boven and Brendonck 2009, Drenner et al. 2009). Zooplankton communities respond to food web changes in algal resources as well as to predation by fish and invertebrates, which makes them key actors in aquatic food webs, playing a fundamental role in the flow of nutrients from algae and bacteria to higher trophic levels (McQueen et al. 1986, Finlay et al. 2007, Gélinas et al. 2007).
These intimate relationships with both their biotic and abiotic environments have enabled the use of zooplankton as bioindicators of water quality (Gannon and Stemberger
play a role in human health, being able to reduce protozoan pathogen activity through grazing (Fayer et al. 2000, Connelly et al. 2007), but also by affecting pathogen growth and incidence (Tamplin et al. 1990, De Magny et al. 2011). As such, increased knowledge of zooplankton communities and the factors structuring these biota in urban ecosystems can be of direct benefit to humans by enabling and guiding more natural and safer management practices for aquatic environments.
In this study, we used zooplankton, central players in aquatic food webs, to identify and describe patterns of variation in diversity across a variety of waterbodies in Montreal (QC), a large Canadian city. With respect to urban biodiversity patterns, we asked (i) which zooplankton taxonomic groups (rotifers, cladocerans and copepods) and (ii) which habitats (waterbodies) and zones (littoral vs. pelagic) contributed the most to the aquatic diversity of the regional species pool (gamma diversity) as well as to beta diversity? As rotifers and cladocerans reproduce mainly by asexual reproduction (parthenogenesis) and have short generation times, while copepods reproduce through obligatory sexual reproduction and have long generation times, we expected that rotifers and cladocerans would have larger populations and dominate zooplankton communities, therefore contributing more than copepods to gamma and beta diversity. Given that littoral zones favour zooplankton biodiversity in more natural north temperate lakes (Walseng et al. 2006), we predicted that urban waterbodies containing a vegetated littoral zone would contribute more to gamma diversity, and that more complex littoral zones would support more species and a different community composition than the pelagic zone. Finally, we asked (iii) which factors, amongst a suite of measured environmental variables, including land-use and management techniques,
urban lakes, we expected communities to respond to multiple abiotic and biotic environmental conditions (Pinel-Alloul et al. 1995), but that management practices would also play an important role. These questions do not only help evaluate the biodiversity potential of urban waterbodies, but will also be important in guiding future management practices to best favour urban biodiversity and water quality.
2.3 Methods
2.3.1 Study sites and sampling design
Between the 7th and the 23rd of July 2010, 18 waterbodies of various types (including
both permanent and temporary waterbodies, as well as three wetlands), distributed over the Island of Montreal (Quebec, Canada) (45.46 - 45.69ºN, 73.50 - 73.90ºW), were sampled to evaluate zooplankton biodiversity in urban environments (Figure 2.1). These waterbodies were selected to represent the various freshwater ecosystems observed on the Island of Montreal and are surveyed by the city water-quality monitoring program (Réseau de Suivi du Milieu Aquatique: http://ville.montreal.qc.ca), providing us with data about management practices in each waterbody and human residential density in the surrounding landscape.
Figure 2.1: Geographic location and distribution of the 18 sampled waterbodies during the summer of 2010 on the Island of Montreal (Quebec, Canada). Modified from Pinel-Alloul and
To permit multiple comparisons of zooplankton community composition patterns both among and within waterbodies, we applied a multi-scale sampling design at regional (among waterbodies) and local (littoral and pelagic zones within each waterbody) scales. The littoral and pelagic zones of each waterbody were sampled separately by randomly choosing three sampling points in the littoral zone, along with three pelagic points in the open-water area directly in front of these, resulting in a total of six sampling points per waterbody. Zooplankton was sampled at each sampling location from a small anchored boat using a 3 L bucket that was dipped ten times to arm’s length in surface water. The 30 L total water sampling unit was subsequently filtered through a 54 µm mesh size plankton net. Organisms were first narcotized with carbonated water and fixed with pure formaldehyde.
Maximum depth and water transparency were measured using a Secchi disk at the three pelagic sampling points, with the results averaged to obtain a single waterbody estimate. Phytoplankton biomass, estimated as total chlorophyll a, as well as biomass for four spectral groups of algae (Greens: chlorophytes, Cyanos: cyanophytes containing phycocyanin, Browns: diatoms + chrysophytes + dinoflagellates, Cryptos: cryptophytes + cyanophytes containing phycoerythrin) was also determined at these same pelagic sampling points using a bbe FluoroProbe (Beutler et al. 2002, Longhi and Beisner 2009).
To assess the abundance of potential invertebrate predators, these were sampled at the same sampling points as zooplankton. Littoral macroinvertebrates were sampled with a
and preserved in 75% ethanol solution and stained with Rose Bengal solution. The presence or absence of fish in each waterbody was confirmed by city managers, visual observations and occasional captures during sampling.
2.3.2 Taxonomic analyses
In the laboratory, zooplankton sampling units were kept in formaldehyde for one month to fix the organisms and then transferred to a 75% ethanol and 5% glycerol solution to avoid desiccation, being concentrated into 25 mL scintillation vials and stained using Rose Bengal solution. Except for when densities were too high, a quarter of each well-mixed zooplankton sampling unit was taken using a pipette with a large-mouthed tip and transferred to a Ward counting wheel (Ward 1955). Taxa were enumerated under a Leica Wild M3B stereomicroscope and identified with a Wild Heerbrug microscope to the finest possible taxonomic resolution (species and genus) using taxonomic keys for Rotifera (Edmondson 1959, Stemberger 1979, Nogrady et al. 1995, Haney et al. 2010), Cladocera (Brooks 1959, Hebert 1995, Haney et al. 2010) and Copepoda (Smith and Fernando 1978, Hudson and Lesko 2003).
Macroinvertebrate sampling units were again separated onto a 500-µm mesh sieve to eliminate small detritus and organic matter in the laboratory. Macroinvertebrates were sorted and counted under a dissecting microscope, being identified to family level using Merritt and Cummins (1996) and Smith (2001). For each sampling unit, total abundances of insect larvae known to be potential predators of zooplankton (Chaoboridae, Corixidae, Notonectidae, Gerridae, Veliidae, Pleidae, Haliplidae, Dytiscidae, Coenogradidae, Aeshnidae, Libellulinae) were estimated.
2.3.3 Data analyses
Diversity analyses – Gamma diversity was estimated as the cumulative species richness (Gaston and Spicer 2004) of all sampled waterbodies in the urban area and partitioned to estimate the contribution of sites and zooplankton taxonomic groups (Cladocera, Copepoda, Rotifera). Total beta diversity was expressed as the variance of the Hellinger-transformed community data table across all sampling units (Legendre et al. 2005). Total beta diversity was partitioned into species contributions (SCBD: degree of variation of individual taxa across the study area) and local contributions (LCBD: comparative indicators of the ecological uniqueness of the sampling units) by calculating the marginal sums of squares of the transformed zooplankton community data-table (Legendre and De Cáceres 2013). In our case, the sums of squares were computed for all 108 sampling units and all recorded taxa, and these values were summed according to waterbody identity and zooplankton taxonomic groups (cladocerans, copepods and rotifers).
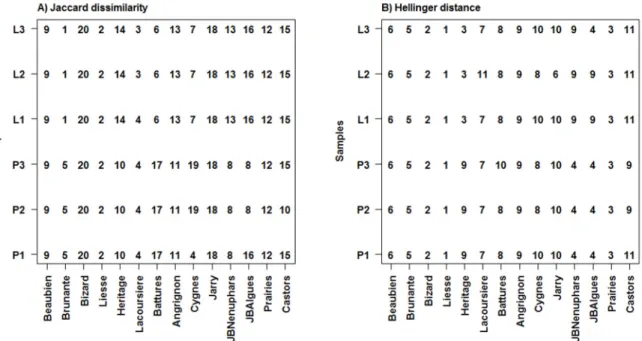
Univariate and multivariate analyses of variance – To evaluate the differences in zooplankton beta diversity and community composition in waterbodies with a vegetated littoral zone, we considered a suite of biodiversity metrics. These metrics included the Euclidean distance between species richness of sampling units, the Jaccard dissimilarity (Jaccard 1908) in taxonomic composition between sampling units and the Hellinger distance (Rao 1995) in taxonomic densities between sampling units. These three metrics represent a
using ANOVA (in the univariate case for species richness) and MANOVA (in the multivariate cases for the Jaccard and Hellinger metrics). Tests for homoscedasticity and homogeneity of the variance-covariance matrices were done using Levene’s test (univariate case) and the method outlined in Anderson (2006) (multivariate case). In all three cases, these tests were not significant (p-value > 0.05). To account for the pairing in our sampling units, we performed paired comparison tests using the method described by Legendre in an unpublished appendix to the paper by Escobar-Briones et al. (2008). To adequately test for differences between zones, only sites with a littoral zone presenting either submerged or emergent rooted macrophytes were considered. The factors “Site” and “Zone” were crossed and replicated sampling allowed for the testing of an interaction between them. These factors were coded as orthogonal Helmert contrasts and used in order to carry out two-way MANOVA. In all cases, the algorithm of McArdle and Anderson (2001), which computes the F-statistic by using the Gower-centered distance matrix, was used, alleviating the need for any correction for negative eigenvalues. Tests of the interaction were done by using the Helmert variables coding for the interaction as explanatory variables, with the Helmert variables coding for both studied factors (“Site” and “Zone”), as well as the principal components for the 28 axes that did not have null eigenvalues of the regression of dummy variables representing the pairs of sampling units onto the factor “Site”.
Interpreting interactions - We interpreted the interaction between the factors “Site” and “Zone” in the univariate case for species richness using an interaction plot. To further explore the multivariate interactions, interaction maps (Legendre et al. 2010) were created, by attributing numbers to the sampling units according to their groups as determined by a